http://dx.doi.org/10.5012/bkcs.2013.34.3.815
Chemical Imaging Analysis of the Micropatterns of Proteins and Cells Using Cluster
Ion Beam-based Time-of-Flight Secondary Ion Mass Spectrometry and Principal
Component Analysis
Hyun Kyong Shon,† Jin Gyeong Son,†,‡ Kyung-Bok Lee,§ Jinmo Kim,† Myung Soo Kim,# Insung S. Choi,‡,* and Tae Geol Lee†,*
†Center for NanoBio Convergence, Korea Research Institute of Standards and Science (KRISS), Daejeon 305-600, Korea *E-mail: [email protected]
‡Department of Chemistry, KAIST, Daejeon 305-701, Korea. *E-mail: [email protected] §Division of Life Science, Korea Basic Science Institute (KBSI), Daejeon 305-333, Korea
#Department of Chemistry, Seoul National University, Seoul 151-742, Korea Received November 3, 2012, Accepted December 11, 2012
Micropatterns of streptavidin and human epidermal carcinoma A431 cells were successfully imaged, as received and without any labeling, using cluster Au3+ ion beam-based time-of-flight secondary ion mass spectrometry (TOF-SIMS) together with a principal component analysis (PCA). Three different analysis ion beams (Ga+, Au+ and Au3+) were compared to obtain label-free TOF-SIMS chemical images of micropatterns of streptavidin, which were subsequently used for generating cell patterns. The image of the total positive ions obtained by the Au3+ primary ion beam corresponded to the actual image of micropatterns of streptavidin, whereas the total positive-ion images by Ga+ or Au+ primary ion beams did not. A PCA of the TOF-SIMS spectra was initially performed to identify characteristic secondary ions of streptavidin. Chemical images of each characteristic ion were reconstructed from the raw data and used in the second PCA run, which resulted in a contrasted – and corrected – image of the micropatterns of streptavidin by the Ga+ and Au+ ion beams. The findings herein suggest that using cluster-ion analysis beams and multivariate data analysis for TOF-SIMS chemical imaging would be an effectual method for producing label-free chemical images of micropatterns of biomolecules, including proteins and cells.
Key Words : Chemical imaging, Protein and cell micropatterns, ToF-SIMS, PCA
Introduction
Label-free chemical imaging analysis of biomolecules and cells is highly desirable in biological research and techno-logy, as any type of labeling can jeopardize their biological functions.1 In particular, research areas2 that require pattern generation of biomolecules and cells on surfaces demand the production of highly contrasted, label-free chemical images of patterned adsorbates that are generated at each fabrication step.3 As a result, various imaging techniques that do not involve labeling have been developed to visualize of protein patterns.4 Among these techniques, time-of-flight secondary ion mass spectrometry (TOF-SIMS) imaging is a powerful technique for producing chemical images of patterns of biomolecules “as received” due to its high molecular speci-ficity, high surface sensitivity and submicron spatial resolu-tion.5 However, its usefulness for imaging protein patterns is undermined by the low yield of characteristic secondary ions generated by atomic primary analysis ion beams, such as Ga+, Cs+, Ar+, In+.6 Rather than atomic-ion analysis beams, cluster-ion or polyatomic analysis beams7 have recently been used in the bio-imaging of tissues to obtain an increas-ed yield of characteristic secondary ions from biomolecules.8 Although protein patterning is crucial to various applications
of biosensors and biomaterial engineering, there have been few studies of imaging cellular or protein patterns using cluster-ion or polyatomic analysis beams in TOF-SIMS imaging analysis.
Recently, multivariate analysis (MVA) has been success-fully used in the identification, classification and quanti-fication of adsorbed proteins, and in the detection of the adsorbed protein conformation and low amounts of adsorbed protein, by reducing the complexity of the data sets.9 To maximize the information obtained from TOF-SIMS data of proteins, it is essential to use this MVA technique for protein studies, because the cluster-ion analysis beam still cannot generate intact molecular secondary ions of proteins or even fragment ions when the protein molecular weight is in the thousands dalton.
In this paper, we imaged a micropattern of human epider-moid carcinoma A431 cells, as received and without any labeling, using an Au3+ analysis ion beam in TOF-SIMS. To demonstrate that the cluster ion, Au3+, is superior to atomic ions for obtaining chemical images of micropatterns of bio-molecules in TOF-SIMS, we compared three different ana-lysis ion beams, Ga+, Au+ and Au3+, and employed a princi-pal component analysis (PCA)9 method to obtain label-free TOF-SIMS chemical images of micropatterns of streptavidin.
These micropatterns of streptavidin were generated by micro-contact printing (μCP) and were used for subsequent cell patterning.2b,10 We chose micropatterns of streptavidin as a model system because they are widely been used as a universal platform for fabricating biomolecular patterns, mainly due to the strong interaction between streptavidin and biotinylated molecules.10
Experimental
Materials. 6-Hex-1-enyltrichlorosilane was purchased from Gelest, Inc. Pentafluorophenol (PFP) and 1-ethyl-3-(dimethylamino)propylcarbodiimide (EDC) were purchased from Aldrich. Poly(ethylene glycol)amine (mPEG-amine, MW 5000) was purchased from Shearwater, Co. (+)-Bio-tinyl-3,6,9-trioxaundecanediamine (biotin-amine) and TRICT-conjugated streptavidin were purchased from Pierce. Biotin-conjugated GRGDSPK (biotin-Gly-Arg-Gly-Asp-Ser-Pro-Lys; biotin-GRGDSPK) peptide was synthesized from Pep-tron, Inc. (Korea).
Formation of PFP-Activated Substrates. A piranha-cleaned glass substrate was immersed in an anhydrous 2 mM hexane solution of 6-hex-1-enyltrichlorosilane for 30 min (Piranha solution: a mixture of H2SO4 and 30% H2O2 (4:1).
Safety note: Piranha solutions can react violently with organic materials). After the formation of vinyl-terminated SAMs, the substrate was rinsed with hexane and dried under a stream of argon. The terminal vinyl groups were then oxidized to carboxylic acid groups by immersing the sub-strate in an aqueous solution of KMnO4 (0.5 mM), NaIO4
(19.5 mM), and K2CO3 (1.8 mM) at room temperature for 24
h. The substrate was removed from the oxidant and rinsed separately with NaHSO3 (0.3 M), water, HCl (0.1 M), water,
and ethanol. The surfaces of carboxylic acid group-terminat-ed glass substrates were activatgroup-terminat-ed by immersing the sub-strate into an ethanol solution of EDC (0.1 M) and PFP (0.2 M) for 30 min. Each PFP-activated glass substrate was then rinsed with ethanol, dried under a stream of argon, and used immediately thereafter.11
Microcontact Printing (µCP) of Biotin-Amine. PDMS
stamps were prepared according to a method in the literature using Sylgard 184 silicone elastomer (Dow Corning).12 Before its use, the PDMS stamp was oxidized by an oxygen plasma cleaner (Harrick PDC-002, medium setting) for 1 min. After inking, the amine-terminated biotin ligand (biotin-amine, 10 mM in ethanol) was printed by placing the PDMS stamp into contact with the PFP-activated glass substrates for 60 sec. The sample was then immersed immediately into a solution of mPEG-amine (10 mg/mL, 0.1 M sodium bicarbonate) for 30 min and rinsed with distilled water. After the generation of the biotin pattern, the samples were immersed in a solu-tion of TRITC-conjugated streptavidin (0.1 mg/mL) in phos-phate-buffered saline (PBS, pH 7.4) containing 0.1% (w/v) BSA and 0.02% (v/v) Tween 20 at room temperature. After 60 min, the samples were removed, and washed several times with PBS and distilled water.11,13 The streptavidin patterns were subsequently incubated with biotin-GRGDSPK
in PBS (0.1 mg/mL) containing 0.1% (w/v) BSA and 0.02% (v/v) Tween 20 for 60 min.13
Cell Patterning. Human Epidermoid Carcinoma A431 cells were grown in Dulbecco’s modified Eagle’s medium (DMEM, Gibco BRL) supplemented with 10% fetal bovine serum (FBS, Gibco BRL) at 37oC in 5% CO2. Cells were
seeded on a RGD peptide-patterned glass substrate at a density of 1-5 × 10⁵ cells/mL. After 1 h, loosely adhered cells were gently rinsed away with cell culture media and attach-ed cells were culturattach-ed for 24 h. The cells were fixattach-ed with 3.7% formaldehyde in PBS for 10 min at room temperature.13 Fluorescence and optical images were acquired on an LMS 510 laser scanning confocal microscope (Carl Zeiss, Germany). ToF-SIMS Analysis. ToF-SIMS measurements were obtained with a TOF-SIMS V instrument (ION-TOF GmbH, Germany) using 25-keV Ga+/Au+/Au3+ primary ions
(aver-age current of 0.44/0.64/0.07 pA, pulse width of 7.4/6.3/11.7 ns and repetition rate of 10 kHz) in the low-current bunched mode. The analysis area of 500 × 500 μm2 was rastered by primary ions and was charge-compensated for glass-slide samples by low-energy electron flooding. The primary ion dose was kept at the same amount of 5.8 × 10¹¹ ions/cm2 to ensure static SIMS conditions. The number of primary ions was 1.45× 10⁹ and was used for estimating the detected secondary ion yields of the streptavidin-patterned and PEG-patterned regions. Mass resolution was usually higher than 7000 in positive mode. The mass calibration of the positive ion spectra was internally performed by using the H+, H2+,
CH3+, C2H2+, C3H3+, C4H4+, and C5H5+ peaks.
PCA Analysis. A PCA of the TOF-SIMS images was performed using PLS_Toolbox v. 3.5β (Eigenvector Research, Manson, WA) for MATLAB (MathWorks, Inc., Natick, MA). Raw data of images were auto-scaled before the PCA pro-cess.
Results and Discussion
A schematic representation of the procedure used for generating the micropatterns of the streptavidin and cells is depicted in Figure 1(a). Glass slides surfaces patterned with streptavidin and poly(ethylene glycol) (PEG) were fabri-cated in four steps: generation of self-assembled monolayers (SAMs) terminating in carboxylic acid groups; the activa-tion of the carboxylic acid groups by pentafluorophenol (PFP); μCP of the biotin-containing amine compound; and passivation of the surface with the mPEG- containing amine compound. After the generation of the streptavidin pattern, a biotinylated RGD peptide (biotin-GRGDSPK) was used to promote cellular adhesion onto the streptavidin-patterned regions before cell seeding.
The highly contrasted TOF-SIMS images shown in Figure 1(b) and 1(c) verify the existence of cells exclusive to the streptavidin-patterned (i.e. RGD-patterned) regions. The bright regions in Figure 1(b) identify the areas in which PEGs were present, and the bright regions in Figure 1(c) identify the areas in which A431 cells were present, as the TOF-SIMS images were the principal component (PC) 1
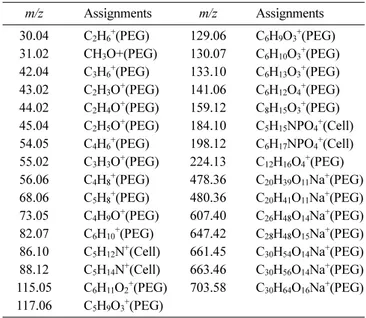
scores image of the PEG and the PC 2 scores image of the A431 cells. These scores images were reconstructed using PCA with PEG-characteristic and cell membrane-charac-teristic positive secondary ions. Table 1 provides a peak list of the all characteristic positive secondary ions needed to generate PC 1 and PC 2 scores images of the cell patterns. PEG-characteristic and cell-membrane-characteristic ions, rather than streptavidin- or RGD peptide-characteristic ions, were used for the reconstruction of the PCA scores images, mainly due to the weak intensities of the characteristic peaks from the patterned regions. These regions were largely buried below the cells, making them difficult to detect, whereas the strong intensities of the characteristic secondary ions
gene-rated from the PEG and cell membrane were easily identi-fied from the spectra. For comparison with the TOF-SIMS images, a fluorescence image was obtained by confocal microscopy with the aid of tetramethylrhodamine isothio-cyanate (TRITC) labeling,10 and was overlapped with an optical image of the cellular patterns, as shown in Figure 1(d).
The Au3+ ion-beam-based image was compared with the
images obtained using the atomic primary analysis ion beams, Ga+ and Au+. Figure 2(a) shows the total positive-ion images of the micropatterns of streptavidin obtained from the same area using the Ga+, Au+ and Au3+ ion beams. Of interest, the
bright regions in the Ga+ and Au+ images correspond to the dark regions in the Au3+ image. This suggests that the bright
regions of each total ion image do not simply represent the actual regions of streptavidin.
For a better data interpretation, the first PCA run was performed on each set of raw data, and its two respective PCs, the PC 1 and PC 2 scores images, were obtained (Figures 2(b) and (c)). Initially, peaks with an intensity greater than 3.4 × 10⁵ counts/sec were automatically selected from the Ga+, Au+ and Au3+ spectra. After reconstruction of
Figure 1. (a) Schematic representation of micropatterns of streptavidin and cells. (b and c) TOF-SIMS and (d) fluorescence images of micropatterns of human epidermoid carcinoma A431 cells. TOF-SIMS images are the PC 1 scores image for PEG and the PC 2 scores image for A431 cells.
Table 1. Peak list of PEG-Characteristic and cell-membrane-characteristic positive secondary ions used for PC 1 and PC 2 scores images of the cell patterns
m/z Assignments m/z Assignments 30.04 C2H6+(PEG) 129.06 C6H9O3+(PEG) 31.02 CH3O+(PEG) 130.07 C6H10O3+(PEG) 42.04 C3H6+(PEG) 133.10 C6H13O3+(PEG) 43.02 C2H3O+(PEG) 141.06 C6H12O4+(PEG) 44.02 C2H4O+(PEG) 159.12 C8H15O3+(PEG)
45.04 C2H5O+(PEG) 184.10 C5H15NPO4+(Cell)
54.05 C4H6+(PEG) 198.12 C6H17NPO4+(Cell)
55.02 C3H3O+(PEG) 224.13 C12H16O4+(PEG) 56.06 C4H8+(PEG) 478.36 C20H39O11Na+(PEG) 68.06 C5H8+(PEG) 480.36 C20H41O11Na+(PEG) 73.05 C4H9O+(PEG) 607.40 C26H48O14Na+(PEG) 82.07 C6H10+(PEG) 647.42 C28H48O15Na+(PEG) 86.10 C5H12N+(Cell) 661.45 C30H54O14Na+(PEG) 88.12 C5H14N+(Cell) 663.46 C30H56O14Na+(PEG) 115.05 C6H11O2+(PEG) 703.58 C30H64O16Na+(PEG) 117.06 C5H9O3+(PEG)
Table 2. Data set of the peak list for the PCA calculations m/z m/z m/z m/z m/z 26.02 53.04 72.05 97.04 120.09 27.02 54.05 73.07 98.06 129.11 29.04 55.02 74.07 99.07 130.07 30.04 56.05 76.03 100.08 131.07 31.02 57.07 79.06 101.08 136.09 39.02 58.07 81.0 102.06 156.16 41.04 59.05 82.07 104.07 159.10 42.04 61.01 83.09 106.09 170.07 43.06 62.06 84.09 107.05 170.17 44.05 66.05 85.05 110.08 196.97 45.03 67.06 86.10 111.06 225.00 46.07 69.07 87.03 112.08 242.95 47.00 70.07 88.04 114.10 50.01 71.07 95.09 117.06
Figure 2. (a) Total positive-ion images of micropatterns of streptavidin. (b and c) PC 1 and PC 2 scores images. (d and e) Chemical images and line profiles of characteristic secondary ion (C10H11N2+) of streptavidin. (f) PC 1′ scores images obtained by
2nd PCA run with fifteen characteristic secondary ions of
the images from the raw data, a total of 68 peaks were selected for a data set, based on the image contrast of each of the ions.
Table 2 shows the data set of the peak list for the PCA calculations. Two principal components (PCs), PC 1 (account-ing for 55.76/69.06/51.11% of the variance) and PC 2 (accounting for 13.55/4.69/19.41% of the variance), were sufficient to explain the Ga+/Au+/Au3+ data set. As expected,
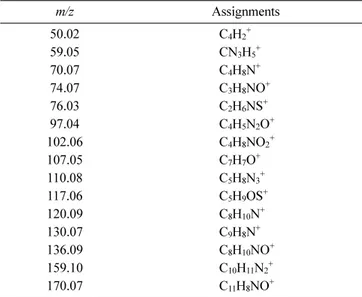
the contrasting pattern of each PC 1 scores image was iden-tical to that of each total ion image. Based on the PCA results and the image contrast of each of the ions, fifteen characteristic secondary ions of streptavidin were identified. This good correlation indicates that all 15 peaks originated from the same molecule (i.e., streptavidin) because the load-ings show the relationship between the PCs and the peaks in the TOF-SIMS data set. The assignments of the 15 peaks are shown in Table 3.
As a representative case, the chemical image and line profile of C10H11N2+ are presented in Figures 2(d) and (e),
respectively. Interestingly, there was a more intense signal at the outer boundaries of all streptavidin micropatterns in the chemical image and line profile obtained using an Au3+
analysis beam. Figure 4 shows that this non-uniformity of the intensity only occurred in the TOF-SIMS chemical image (Figs. 4(b) and (d)) and, not in the fluorescence image (Figs. 4a and c). This non-uniformity in the TOF-SIMS chemical image would be real due to the intrinsic nature of the micro-contact printing technique and the high surface sensitivity of the TOF-SIMS technique.
Comparing the chemical images of each ion with the total ion images made it clear that the image of the total positive ions obtained by the Au3+ primary ion beam corresponded
well to the actual image of the micropatterns of streptavidin. On the other hand, the total positive-ion image by the Ga+ or Au+ primary ion beams corresponded poorly to the real image of the micropatterns of streptavidin. In addition, compared to the detected secondary ion yield by the Ga+ ion, the C10H11N2+
yield was enhanced by 87 times in the patterned regions and by 19 times in the nonpatterned regions when the Au3+ ion
beam was used, although high-molecular weight fragments of streptavidin were not detected.
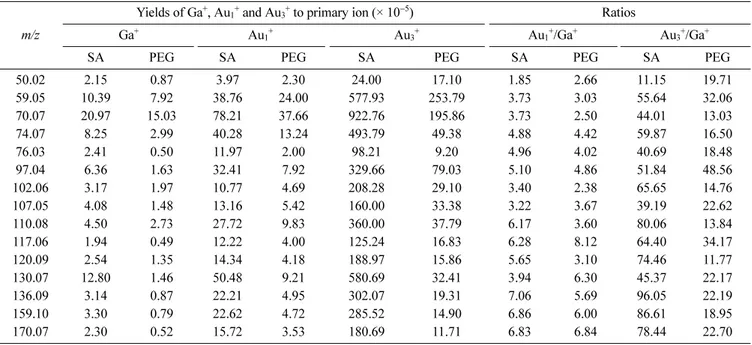
Table 4 shows the detected secondary ion yield of fifteen characteristic secondary ions of streptavidin. The second PCA run was performed with only fifteen characteristic secondary ions of streptavidin from the Ga+ and Au+ raw data. New PC 1’s (called PC 1') scores images were obtained and are shown in Figure 2(f). These images clearly indicate that the two PC 1's scores images correspond well to the real image of the micropatterns of streptavidin, as does the Au3+
PC 1 scores image.
Conclusions
This paper demonstrates that the Au3+ cluster-ion analysis
Table 3. Peak assignments of characteristic secondary ions of streptavidin m/z Assignments 50.02 C4H2+ 59.05 CN3H5+ 70.07 C4H8N+ 74.07 C3H8NO+ 76.03 C2H6NS+ 97.04 C4H5N2O+ 102.06 C4H8NO2+ 107.05 C7H7O+ 110.08 C5H8N3+ 117.06 C5H9OS+ 120.09 C8H10N+ 130.07 C9H8N+ 136.09 C8H10NO+ 159.10 C10H11N2+ 170.07 C11H8NO+
Figure 3. Loading plots of the first (PC 1) and second (PC 2) principal components for the characteristic secondary ions of streptavidin. The peaks correlate well with each other since the loading values of the 15 peaks are all positive in PC 1 and all negative in PC 2.
Figure 4. (a and c) Fluorescence image and its line profile (AA′) of micropatterns of streptavidin. (b and d) TOF-SIMS chemical image and its line profile (BB′) of characteristic secondary ion (C10H11N2+)
beam is well suited to producing label-free TOF-SIMS chemical images of micropatterns of biomolecules and cells, in an as-received state. The detected secondary ion yields in the patterned region were sufficiently enhanced to obtain an excellent and accurate chemical image of micropatterns of streptavidin without the need for any labeling. In addition, a contrasted and corrected image of micropatterns of strep-tavidin can be obtained using Ga+ or Au+ with two PCA runs. This study suggests that using cluster-ion analysis beams and multivariate data analysis for TOF-SIMS chemical imaging would be an effective means of producing label-free chemical images of micropatterns of biomolecules and cells. Acknowledgments. This work was supported by the Bio-Signal Analysis Technology Innovation Program (grant no. 2012-0006053), the Pioneer Research Program (2012-0009541) the Converging Research Center Program (grant no. 2012K001504) and the Development of Characterization Techniques for the Nano-Materials Safety project of the Korea Research Council of Fundamental Science & Techno-logy (KRCH).
References
1. Pacholski, M. L.; Winograd, N. Chem. Rev. 1999, 99, 2977. 2. (a) Kumar, A.; Abbott, N. L.; Kim, E.; Biebuyck, H. A.; Whitesides,
G. M. Acc. Chem. Res. 1995, 28, 219. (b) Mrksich, M.; Whitesides, G. M. Trends. Biotechnol. 1995, 13, 228. (c) Blawas, A. S.; Reichert, W. M. Biomaterials 1998, 19, 595.
3. Makohliso, S. A.; Léonard, D.; Giovangrandi, L.; Mathieu, H. J.; Ilegems, M.; Aebischer, P. Langmuir 1995, 15, 2940.
4. (a) Jin, G.; Tengvall, P.; Lundström, I.; Arwin, H. Anal. Biochem. 1995, 232, 69. (b) Wadu-Mesthrige, K.; Xu, S.; Amro, N. A.; Liu, G. Langmuir 1999, 15, 8580. (c) Yip, C. M.; Brader, M. L.; Frank, B. H.; DeFelippis, M. R.; Ward, M. D. Biophys. J. 2000, 78, 466. (d) Jordan, C. E.; Frutos, A. G.; Thiel, A. J.; Corn, R. M. Anal.
Chem. 1997, 69, 4939. (e) Fulghum, J. E. J. Electron. Spectrosc. Relat. Phenom. 1999, 100, 331. (f) Hagenhoff, B. Biosens. Bio-electron. 1995, 10, 885.
5. (a) Ostrowski, S. G.; Bell, C. T. V.; Winograd, N.; Ewing, A. G. Science 2004, 305, 71. (b) Tourovskaia, A.; Barber, T.; Wickes, B. T.; Hirdes, D.; Grin B.; Castner, D. G.; Healy, K. E.; Folch, A. Langmuir 2003, 19, 4754. (c) Belu, A. M.; Yang, Z.; Aslami, R.; Chilkoti, A. Anal. Chem. 2001, 73, 143. (d) Revzin, A.; Russell, R. J.; Yadavalli, V. K.; Koh, W.-G.; Deister, C.; Hile, D. D.; Mellott, M. B.; Pishko, M. V. Langmuir 2001, 17, 5440. (e) Michel, R.; Lussi, J. W.; Csucs, G.; Reviakine, I.; Danuser, G.; Ketterer, B.; Hubbell, J. A.; Textor, M.; Spencer, N. D. Langmuir 2002, 18, 3281.
6. Castner, D. G. Nature 2003, 422, 129.
7. (a) Winograd, N. Anal. Chem. 2005, 77, 142A. (b) Gillen, G.; Roberson, S. Rapid Comm. Mass Spectrom. 1998, 12, 1303. (c) Weibel, D.; Wong, S.; Lockyer, N.; Blenkinsopp, P.; Hill, R.; Vickerman, J. C. Anal. Chem. 2003, 75, 1754. (d) Kollmer, F. Appl. Surf. Sci. 2004, 231-232, 153.
8. (a) Touboul. D.; Halgand, F.; Brunelle, A.; Kersting, R.; Tallarek, E.; Hangenhoff, B.; Laprévote, O. Anal. Chem. 2004, 76, 1550. (b) Sjövall, P.; Lausmaa, J.; Johnsson, B. Anal. Chem. 2004, 76, 4271.
9. (a) Wagner, M. S.; Graham, D. J.; Ratner, B. D.; Castner, D. G. Surf. Sci. 2004, 570, 78. (b) Wagner, M. S.; Castner, D. G. Langmuir 2001, 17, 4649. (c) Smentkowski, V. S.; Keenan, M. R.; Ohlhausen, J. A.; Kotula, P. G. Anal. Chem. 2005, 77, 1530. 10. Park, T. J.; Lee, K.-B.; Lee, S. J.; Park, J. P.; Lee, Z.-W.; Lee, S.
Y.; Choi, I. S. J. Am. Chem. Soc. 2004, 126, 10512.
11. (a) Park, J. P.; Lee, S. J.; Park, T. J.; Lee, K.-B.; Choi, I. S.; Lee, S. Y.; Kim, M.-G.; Chung, B. H. Biotechnol. Bioprocess Eng. 2004, 9, 137. (b) Lee, Z.-W.; Lee, K.-B.; Hong, J.-H.; Kim, J.-H.; Choi, I.; Choi, I. S. Chem. Lett. 2005, 34, 648.
12. Xia Y.; Whitesides, G. M. Angew. Chem. Int. Ed. 1998, 37, 551. 13. (a) Hyun, J.; Ma, H.; Banerjee, P.; Cole, J.; Gonsalves, K.; Chilkoti,
A. Langmuir 2002, 18, 2975. (b) Lahann, J.; Balcells, M.; Rodon, T.; Lee, J.; Choi, I. S.; Jensen, K. F.; Langer, R. Langmuir 2002, 18, 3632. (c) Lee, K.-B.; Kim, D. J.; Lee, Z.-W.; Woo, S. I.; Choi, I. S. Langmuir 2004, 20, 2531.
Table 4. Detected secondary ion yields for characteristic streptavidin fragments. SA indicates the streptavidin-patterned regions and PEG indicates the PEG-patterned regions
m/z
Yields of Ga+, Au1+ and Au3+ to primary ion (× 10−5) Ratios
Ga+ Au1+ Au3+ Au1+/Ga+ Au3+/Ga+
SA PEG SA PEG SA PEG SA PEG SA PEG
50.02 2.15 0.87 3.97 2.30 24.00 17.10 1.85 2.66 11.15 19.71 59.05 10.39 7.92 38.76 24.00 577.93 253.79 3.73 3.03 55.64 32.06 70.07 20.97 15.03 78.21 37.66 922.76 195.86 3.73 2.50 44.01 13.03 74.07 8.25 2.99 40.28 13.24 493.79 49.38 4.88 4.42 59.87 16.50 76.03 2.41 0.50 11.97 2.00 98.21 9.20 4.96 4.02 40.69 18.48 97.04 6.36 1.63 32.41 7.92 329.66 79.03 5.10 4.86 51.84 48.56 102.06 3.17 1.97 10.77 4.69 208.28 29.10 3.40 2.38 65.65 14.76 107.05 4.08 1.48 13.16 5.42 160.00 33.38 3.22 3.67 39.19 22.62 110.08 4.50 2.73 27.72 9.83 360.00 37.79 6.17 3.60 80.06 13.84 117.06 1.94 0.49 12.22 4.00 125.24 16.83 6.28 8.12 64.40 34.17 120.09 2.54 1.35 14.34 4.18 188.97 15.86 5.65 3.10 74.46 11.77 130.07 12.80 1.46 50.48 9.21 580.69 32.41 3.94 6.30 45.37 22.17 136.09 3.14 0.87 22.21 4.95 302.07 19.31 7.06 5.69 96.05 22.19 159.10 3.30 0.79 22.62 4.72 285.52 14.90 6.86 6.00 86.61 18.95 170.07 2.30 0.52 15.72 3.53 180.69 11.71 6.83 6.84 78.44 22.70