저작자표시-비영리-변경금지 2.0 대한민국 이용자는 아래의 조건을 따르는 경우에 한하여 자유롭게 l 이 저작물을 복제, 배포, 전송, 전시, 공연 및 방송할 수 있습니다. 다음과 같은 조건을 따라야 합니다: l 귀하는, 이 저작물의 재이용이나 배포의 경우, 이 저작물에 적용된 이용허락조건 을 명확하게 나타내어야 합니다. l 저작권자로부터 별도의 허가를 받으면 이러한 조건들은 적용되지 않습니다. 저작권법에 따른 이용자의 권리는 위의 내용에 의하여 영향을 받지 않습니다. 이것은 이용허락규약(Legal Code)을 이해하기 쉽게 요약한 것입니다. Disclaimer 저작자표시. 귀하는 원저작자를 표시하여야 합니다. 비영리. 귀하는 이 저작물을 영리 목적으로 이용할 수 없습니다. 변경금지. 귀하는 이 저작물을 개작, 변형 또는 가공할 수 없습니다.
경제학 석사 학위논문
Cognitive Style and Task Complexity
for Interface Design
: Decision Support for Swine Farm
양돈 농가의 의사결정 지원을 위한 인터페이스
개발: 인지양식과 과업복잡성을 중심으로
2019년 2월
서울대학교 대학원
농경제사회학부 지역정보전공
유 지 혜
Abstract
Cognitive Style and Task Complexity for Interface Design
: Decision Support for Swine Farm
Jihye You Program in Regional Information Department of Agricultural Economics and Rural Development Seoul National University
Recently, agricultural industry has adopted information technology to improve production efficiency. As the information environment becomes more and more saturated, information system users’ decision-making performance declines because of information overload occurs. User interface is one of possible way of increasing users’ decision-making performance. This study examines the effects of interface designs that are matched or mismatched with cognitive styles and the effects of interaction between task complexity and decision-making performance. To achieve the aim of the present study, this study designed both of simple and complex tasks by field-dependent preferred prototype and field-infield-dependent preferred prototypes.
The prototype used for this study was developed to resemble the systems that are used in the swine-farming industry. The results showed that a match/mismatch between the user interface and the cognitive style had a significant effect on task time but not on task score. Furthermore, no significant interaction effect of task complexity was found for both the task score and the task time.
Keyword: Cognitive Style, Task Complexity, User Interface,
Decision-making, Information System, Agriculture, Swine Farm
Table of Contents
Chapter 1. Introduction ··· 1
1.1 Study Background ··· 1
1.2 Purpose of Research ··· 4
Chapter 2. Literature Review ··· 5
2.1 Cognitive Load Theory ··· 5
2.2 Cognitive Fit Theory ··· 8
2.3 Cognitive Styles ··· 10
2.4 Task Complexity ··· 12
Chapter 3. Theoretical Framework ··· 15
3.1 The Relationship between Cognitive Styles and Interface Design ··· 15
3.2 The Influence of Task Complexity on Performance ··· 18
Chapter 4. Research Model and Hypotheses Development ···· 21
Chapter 5. Research Methodology ··· 25
5.1 Experiment Design ··· 25
5.2 Matched/Mismatched of Interface with Cognitive Styles ·· 25
5.3 Task Complexity ··· 28
Chapter 6. Data analysis and Results ··· 34
6.1 Data Collection ··· 34
6.2 Demographic Information ··· 35
6.3 Descriptive Statistics of Major Variables ··· 36
6.4 Correlation Analysis ··· 38 6.5 Hypothesis Test ··· 40 Chapter 7. Discussion ··· 48 7.1 Summary of Findings ··· 48 7.2 Academic Contributions ··· 50 7.3 Practical Suggestions ··· 54
7.4 Limitations and Future Study ··· 57
References ··· 59
Appendix A. Interface Design ··· 73
Appendix B. Survey of Study ··· 101
Appendix C. Task Questionnaire··· 104
Appendix D. Survey of Study: Cognitive Load ··· 112
Appendix E. Survey of Study: Hidden Figures Test ··· 115
List of Figures
Figure 1. Basic model of cognitive fit theory ··· 9
Figure 2. Research model for the present study ··· 21
Figure 3. Interface design principles used to develop an interface for each cognitive style ··· 29
Figure 4. Example of a field-dependent preferred prototype design ··· 30
Figure 5. Example of a field-independent preferred prototype design ··· 31
Figure 6. Mean task completion scores for matched and mismatched interfaces ··· 42
Figure 7. Mean time taken per task for matched and mismatched interfaces ··· 44
Figure 8. Mean cognitive load for matched and mismatched interfaces ··· 46
List of Tables
Table 1. Summary of implications for user interface designs that matched users’ cognitive styles ··· 27Table 2. Number of cognitive style classifications ··· 35
Table 3. Participants’ demographic information ··· 36
Table 4. Descriptive statistics for the major variables ··· 37
Table 5. Correlation analysis results for the major variables ··· 39
Table 6. Description of the variables ··· 41
Table 7. Regression analysis results (y = task score) ··· 43
Table 8. Regression analysis results (y = time per task) ··· 45
Table 9. Regression analysis results (y = cognitive load) ··· 47
1
1. Introduction
1.1 Study background
Recently, the importance of precision in farming has increased because the agricultural industry has adopted information technology to improve production efficiency (Batte & Arnholt, 2003). Information technology has had a particularly significant effect on the agricultural industry. There are many information systems available to enable livestock conditions to be monitored by farmers. Farmers can collect relevant data through these systems and thus improve cost efficiency within their businesses (Banhazi, Babinszky, Halas, & Tscharke, 2012).
The swine-farming industry is no exception to this trend. In particular, pigs are easily affected by environmental conditions compared to other livestock species (Pearce et al., 2013). Swine breeders are trying, therefore, to control swine-farm conditions in more precise and effective ways. Recently, many Korean swine farmers have accepted internet of things (IoT) technology for managing their farms more efficiently (Jang, Lee, & Choe, 2014).
The use of information systems, however, does not always lead to increased work efficiency. As the information environment becomes more and more saturated, users may start to find the data-searching process confusing (Davenport & Beck, 2001). In addition, the layout of
2
information within a system can be complicated, with too much data appearing on the screen, leading to information overload for the user (Yigitbasioglu & Velcu, 2012). The user’s decision-making performance declines when information overload occurs (Chewning Jr. & Harrell, 1990).
Additionally, systems which are currently used in the agricultural sector have often been developed without any consideration for user-friendliness (McCown, Carberry, Hochman, Dalgliesh, & Foale, 2009). Increased development within the field of interface design may provide a solution and improve decision-making performance (Tufte, 1985). A well-designed user interface can positively influence users’ decision-making performance (Tegarden, 1999), enabling users to search information resources more effectively (White & Iivonen, 2001).
People gather, analyze, and interpret information in different ways (Harrison & Rainer Jr., 1992). The various methods that individuals employ to organize and process such information have been labeled cognitive styles. It has been found that each cognitive style is associated with a different level of decision-making performance (Riding & Sadler‐Smith, 1997). Nevertheless, cognitive styles are often ignored by interface designers. To address this gap in interface design, it is crucial that research is carried out to ensure that user interfaces are
3 compatible with users’ cognitive styles.
To address this limitation, this study aims to design an intuitive user interface for use in swine farm management systems by taking both users’ cognitive styles and the issue of task complexity into account.
Specifically, this study examines decision-making performance and cognitive load for potential users who are involved in animal husbandry, animal biotechnology, and veterinary science, and are interested in farming. By designing the user interface based on previous studies, and then examining the potential users’ decision-making performance and cognitive load, this study hopes to recommend a user interface design for the agricultural sector, especially the swine-farming industry.
4
1.2 Purpose of the research
This paper attempts to analyze the effect of interface design, based on cognitive styles and task complexity, on users’ decision-making performance. Taking cognitive styles theory and task complexity theory into account, a user interface was designed to verify the effect of interface design on users’ decision-making performance and cognitive load. To achieve this goal, the study addressed the following questions:
RQ1: Is decision-making performance affected by the matching or mismatching of user interface design with cognitive styles?
RQ2: Is cognitive load affected by the matching or mismatching of user interface design with cognitive styles?
RQ3: In relation to task complexity differences, what is the difference in the effect of matching or mismatching of the user interface design with cognitive styles on users’ decision-making performance?
In summary, this study examines the effect of interface design on users’ decision-making performance and cognitive load. Using theories about cognitive style and task complexity drawn from previous studies, an interface was designed to verify the effect of each cognitive style and the matched or mismatch of interface design with cognitive style.
5
2. Literature Review
2.1 Cognitive load theory
Cognitive load theory is an instructional theory that provides a link between the human cognitive structure and problem-solving processes. Each individual has a cognitive architecture with a limited capability for processing information, and this limitation can cause cognitive load (Paas, Van Gog, & Sweller, 2010). The theory suggests a framework of instructional design for conceptualizing working memory and long-term memory, which play a key role in human cognitive architecture (Sweller, 2004).
Working memory is the location of recurring mental activity with a limited capacity for processing information (Miller, 1956). Working memory cannot store every item of information and has difficulty with certain types of information processing such as recalling, combining, or comparing it with other information. Miller’s study (1956) suggested that working memory has the capacity to save about five to nine items of newly-acquired information and can process about two to four items of that same information. By contrast, the long-term memory can save larger quantities of information, more permanently than working memory. The information stored in long-term memory is stored in the form of structures which are called schemas (Gick &
6
Holyoak, 1983). When people process unfamiliar information, schemas can help to decrease the load on the working memory by comparing the information with previously-acquired schemas.
However, cognitive schemas which have been saved in the long-term memory and recovered for comparison with the new information are treated in the working memory. There are three main types of cognitive load which influence working load: intrinsic
cognitive load, extraneous cognitive load, and germane cognitive load.
Intrinsic cognitive load occurs because of the inherent complexity of learning new material (Sweller, 1994). Learners save the perceived information in the shape of schemas in their long-term memory and incur intrinsic cognitive load when they deal with the intrinsic complexity of the information. The amount of intrinsic cognitive load is determined by the interaction of the various elements of information (Bannert, 2002). For example, in the case of learning mathematics, learning the mathematical symbols involves low element complexity because symbols such as plus and minus can be learned separately. By contrast, calculating liner differential equations involves relatively high element complexity because it requires a knowledge of functions and equations.
7
Extraneous cognitive load is generated by the way the information (i.e., the learning material) is presented (Chandler & Sweller, 1991). When learners receive information in an inappropriate format, extraneous cognitive load causes adverse effects on educational attainment (Paas, Tuovinen, Tabbers, & Van Gerven, 2003). Hence, this type of cognitive load can be modified by changing the learning materials or teaching method.
Intrinsic cognitive load and extraneous cognitive load are inseparably linked. If the intrinsic cognitive load of coursework is low, there will be no difficulty in dealing with a high extraneous cognitive load resulting from the design of the learning material, because the total cognitive load is within the working memory’s capacity.
A further type of cognitive load is germane cognitive load. Unlike intrinsic or extraneous cognitive load, germane cognitive load does not represent an obstacle for learners. Germane cognitive load affects the processing and composition of schemas (Sawicka, 2008). Germane cognitive load is caused by the learner’s effort to understanding the material (Renkl & Atkinson, 2003). As previously mentioned, a schema is a compilation of knowledge from the learner’s previous experience. The effort to understand information increases the cognitive load and the effort affects the structuring of the schema
8
(Sweller, Van Merrienboer, & Paas, 1998). Thus, germane cognitive load seems to increase differently from other cognitive loads.
In summary, human memory consists of long-term memory and short-term memory. Human memory has a limited capacity for cognition. Therefore, if a certain task demands more effort than the working memory has the capacity to deal with, cognitive load will hinder the successful completion of that task. One possible way to reduce cognitive load is to develop instructional systems that consider the working memory’s capacity.
2.2 Cognitive fit theory
The basic concept of cognitive fit is drawn from problem-solving theory. Cognitive fit refers to the task of problem-solving problems and suggests that the way the task is presented affects task performance (Umanath & Vessey, 1994; Vessey, 1991).
Task performance is the outcome of the interaction between the problem-solving task and the problem representation format. The problem representation format relates to the complexity in the task environment, and this complexity is lowered when the problem-solving process of problem representation format (Vessey, 1991).
9
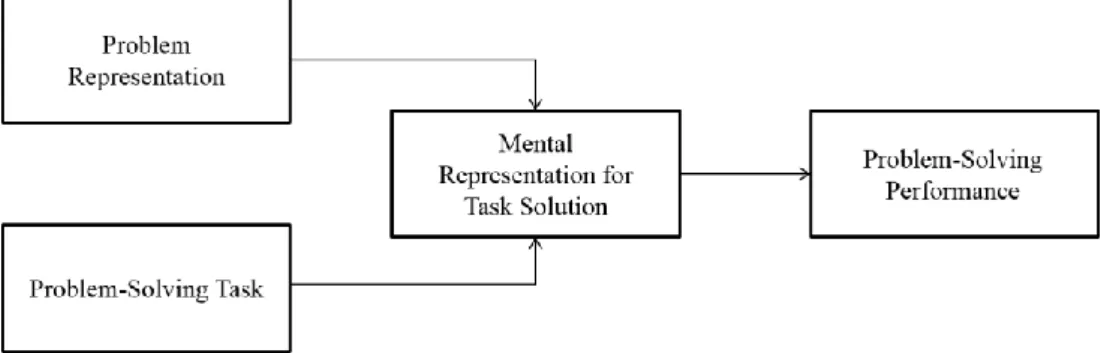
Figure 1. Basic model of cognitive fit theory (Vessey, 1991)
Figure 1 shows the basic cognitive fit model originally suggested by Vessey (1991). This model posits that problem-solving performance is the result of interaction between problem representation and the problem-solving task. According to the basic model of cognitive fit theory, problem representation and the problem-solving task are elements of a problem-solving process involving a mental representation which is the outcome of a correspondence between the elements of the problem-solving process. Vessey (1991) interprets the mental representation for task solution as “the way the problem is represented in human working memory”. A mental representation includes a knowledge or perception of how to solve the task (Chandra & Krovi, 1999). Mental representation for task solution affects the working memory, the decision-making process (Kelton, Pennington, & Tuttle, 2010), and cognitive style (Archer, Head, Wollersheim, & Yuan,
10 1996).
Based on the cognitive fit theory, the level of fit between the data presentation format and the problem-solving task affects task-completion performance. Therefore, a presentation format that improves the performance of one task may not improve the performance of a different task (Zhu & Watts, 2010). Originally, cognitive fit theory was developed to explain the conflicting results of tasks which involved comparing the problem representation formats of graphs and tables (Vessey, 1991). Nowadays, cognitive fit theory is being applied in various fields such as e-commerce (Hong, Thong, & Tam, 2004), decision support systems (Erskine, Gregg, Karimi, & Scott, 2018), and social media analytics (Zhu & Watts, 2010).
2.3 Cognitive Style
Cognitive style suggests that each person uses different means of understanding and compiling information (Rayner & Riding, 1997). An individual’s cognitive style refers to the ways in which he or she collects, judges, and comprehends information (Harrison & Rainer Jr., 1992). This notion is important because the same information may be processed and interpreted in various ways according to individuals’ different cognitive styles (Vessey & Galletta, 1991). Therefore,
11
cognitive styles explain why individuals perform differently on the same tasks. A previous study has examined the effects of different cognitive styles upon perception, learning, task-solving abilities, and decision-making skills (Kirton, 2004).
A number of different cognitive styles have been identified by various researchers; for example, field dependent versus field independent (Witkin, Moore, Goodenough, & Cox, 1977), verbal versus visual (Riding & Ashmore, 1980), scanning versus focusing (Gardner, 1961), holistic vs. analytic (Richard Riding & Sadler‐Smith, 1992), and others
A cognitive style approach has been applied to issues within the field of education (Witkin et al., 1977). In this field, cognitive styles and learning styles are interchangeable. Usually, cognitive style is more evident in academic research papers, whereas learning style is more apparent in practical use (Liu & Ginther, 1999). In the previous literature, both cognitive styles and learning styles have been seen to affect ways of processing or organizing information (Riding & Cheema, 1991).
In addition, studies relating to business organizations have placed significant emphasis on cognitive style because of the potential impact of differences in employees’ cognitive styles on work performance
12
(Kirton, 1976). It was discovered that managers who recognize their employees’ cognitive styles can find ways to increase both their work performance and productivity. It can be argued, therefore, than an understanding of cognitive style is crucial to the improvement of business outcomes and decision-making performance (Volkema Gorman, 1998).
2.4 Task complexity
People carry out various tasks in the course of their lives and complexity is one of the characteristics of tasks (Liu & Li, 2012). Task complexity is regarded as a crucial factor in human achievement and behavior (Payne, 1976).
When conducting an information- and design-related study, it is important to give some thought to task complexity. According to information-processing principles, if task complexity increases, the person carrying out the task must select new ways of processing the information and these choices will affect decision-making outcomes. (Bettman, Johnson, & Payne, 1988). Moreover, the importance of task complexity is not confined to design-related matters; it can also be relevant when establishing task-related aims or assessing task performance (Campbell, 1991).
13
In terms of motivation theories, task complexity has a moderate effect on the completion of difficult tasks (Wood, Mento, & Locke, 1987). Task complexity concerns the number of actions that need to be completed and the unique information cues that an individual has to deal with in order to complete the task (Wood, 1986). A previous study found that, as task complexity increases, the demands of information processing and the load on the cognitive source increase (Klemz & Gruca, 2003). Performing a task with high complexity, involving the risk of information overload, will eventually decrease concentration on the task (Speier, Valacich, & Vessey, 1999). In addition, high task complexity skews performers’ judgment (Bonner, 1994).
In previous studies, many different aspects of task complexity were considered important. For example, Pierce and Dunham's (1976) study suggested that task complexity has psychological significance and affects task identity. The researchers emphasize certain psychological dimensions of tasks, such as the task place between the task and the individual. In a similar vein, Campbell and Gingrich (1986) stress the importance of observing the task-doer and the task when judging task complexity. Additionally, people’s perceptions of task complexity have been seen to have objective characteristics. Objective complexity defines a task’s complexity in terms of its objective task
14
qualities. Objective task characteristics that contribute to task complexity include the information load, information diversity, and the rate of information change (Payne, 1976).
15
3. Theoretical Framework
3.1 The relationship between cognitive styles and
interface design
Because computers and the Internet are now major elements of everyday life, the importance of user interfaces has increased (Calvary et al., 2003). A user interface is the communication medium between systems and users, so the user interface is an important part of any system (Chalmers, 2003; Hasan & Ahmed, 2007). Systems are types of software that are used to operate computers and other devices.Systems involve invisible codes, but provide user interfaces with graphical elements that can be viewed on screens. Computers can communicate with users via user interface elements such as menus, icons, graphically-portrayed data, screen layout, and alert messages. Even a system that employs advanced technology is useless if the user does not understand it.
When developing an information system with a user interface, the elements of the interface present information that is contained in the system. People have their own cognitive styles due to their different ways of processing, understanding, and reorganizing information (Felder & Spurlin, 2005) and information might be understood
16
differently by users depending on their cognitive styles (Vessey & Galletta, 1991).
Previous studies have largely focused on the education field. Riding and Sadler‐Smith (1992) examined students’ learning performance based on their cognitive styles and the information presentation format. They divided cognitive styles into holistic–analytic dimensions. Their results showed that the presentation format can have an impact on learning performance. They suggested that learning materials which consider cognitive styles may improve the effectiveness and efficiency of learning. In Pillay and Wilss' (1996) study, they suggested ways of enhancing students’ learning performance with computer assisted instruction (CAI). Their study examined the effect of instructional material that was matched or mismatched with students’ cognitive styles. Cognitive styles were divided into four types; holistic, analytic, verbal, and visual. They found that students who were given learning materials that matched their cognitive styles performed better than students with mismatched learning materials. Another study examined the relationship between cognitive styles and e-learning, focusing on the students’ emotions (Huang, Hwang, & Chen, 2016). The researchers assumed that emotion is a factor that affects learning performance. The study’s results
17
indicated that, in cases where students received e-learning materials which matched their cognitive styles, the students experienced more positive emotions than students who received mismatched materials.
Although many studies concluded that learning materials that match cognitive styles affect performance positively, they have not always showed significant results. Massa and Mayer (2006) investigated the interaction between multimedia instruction and cognitive styles. They supposed that the matched group would perform better in the multimedia environment than the mismatched group, but they found that there was no significant effect of matched or mismatched multimedia instruction in relation to participants’ cognitive styles.
Previous studies have insisted that performance can be affected by learning materials regardless of whether or not they match individuals’ cognitive styles. These studies were mainly conducted in the field of education and few concerned the agricultural sector. Hence, our study applies the concept of materials that are matched or mismatched with individuals’ cognitive styles to determine the effects on performance, especially with regard to systems used in the agricultural sector.
18
3.2 The influence of task complexity on performance
Task complexity is one of the features that impact the relationship between the problem representation format and problem-solving performance. According to Wood (1986), task complexity is one of the main factors affecting human performance. Thus, it is important to identify the complexity of the task. Many previous studies have defined the complexity of tasks according to task characteristics (Campbell, 1988; Schwab & Cummings, 1976; Steinmann, 1976). This study uses Campbell’s (1988) definition of task complexity as its theoretical basis. Campbell (1988) established four characteristics of a complex task. The first characteristic of a complex task is multiple paths, meaning that, when there are many paths to a preferred outcome, task complexity increases. The second characteristic is multiple outcomes. If the required outcomes of a task increase, the task complexity also increases. The third characteristic is the friction between paths. The complexity of a task may increase when the achievement of one desired result conflicts with another desired result. The final characteristic is uncertainty, which can increase task complexity by expanding the possible paths to achievement of the desired outcomes.
19
Furthermore, Campbell (1988) emphasized that the complexity of a task must be considered because it relates to the interaction between the task doer and the task properties. Task complexity has an impact on the task doer’s memory workload (Jacko & Salvendy, 1996). For high task complexity, the task doer requires more information (Klemz & Gruca, 2003). According to Norman and Bobrow (1975), when the amount of information exceeds the memory’s capacity for processing information, performance is moderated. Compared with the level of task complexity, inadequate user interfaces have a greater influence on complex tasks than simple tasks (Mittelstädt, Brauner, Blum, & Ziefle, 2015). In the field of human-computer interaction, task complexity has been identified as important. Jacko and Ward (1996) studied the relationship between task complexity and performance using a hierarchical menu. Their study showed that, as the components of an interface increased, the increase became a threat to short-term memory and exerted a negative effect on decision-making performance. Xu et al. (2008) examined the impact of the presentation format, task complexity, and the degree of training on performance in dealing with computerized emergency operating procedures (EOPs). According to their results, task complexity has a significant effect on subjects’ operation performance. Both skilled and unskilled participants needed
20
more time and had a higher error rate when completing high-complexity tasks than when completing low-high-complexity tasks. In summary, task complexity affects an individual’s information processing ability and decision-making approach (Payne, 1976).
The cognitive styles and task complexity literature has provided the theoretical framework for this study. However, few of the studies have verified the effect of interface designs that are matched or mismatched with cognitive styles or the effect of task complexity on decision-making performance in an agricultural context. Therefore, we have employed the concepts of cognitive styles and task complexity in order to verify the effect of user interface design on decision-making performance using prototypes based on systems used in the swine-farming industry.
21
4. Research Model and Development of
Hypotheses
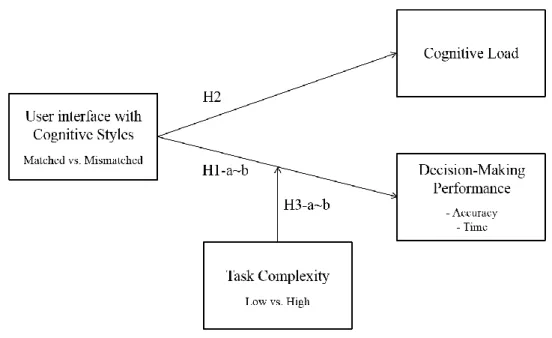
According to the previous studies and conceptual framework, this study proposes the following research model (Figure 2).
Figure 2. Research model for the present study
A variety of studies have verified the relationship between cognitive style and user interface design. Ford and Chen (2001) examined whether learning performance was affected by online systems that considered cognitive styles. They designed the different stimuli with either breadth or depth first design. With regard to cognitive styles, field-dependent individuals were found to have
22
superior performance under breadth conditions. By contrast, field-independent individuals were found to perform better under depth conditions. For each cognitive style, when individuals used an online system that matched their cognitive style, they obtained better results. Also, Ford (1995) verified the effect of concurrence between cognitive styles and learning systems on performance and efficiency. When conditions matched the cognitive styles of field-dependent people, the design incorporated a holistic designed stimulus. When conditions matched the cognitive styles of field-independent people, the design incorporated a serialistic designed stimulus. The results showed that matched conditions led to higher performance than did mismatched conditions.
The way information is presented affects decision-making performance (Tan & Benbasat, 1990; Tractinsky & Meyer, 1999). Cognitive fit theory supported the many studies which verified the relationship between information presentation and decision-making performance. Speed and accuracy are widely used variables for assessing decision-making performance (Dennis & Carte, 1998; Speier, 2006; Umanath & Vessey, 1994). Therefore, this study assumes that users can achieve better decision-making performance when the user interface design is matched with their cognitive style. Based on
23
previous studies, we suggest the following hypotheses:
H1-a: User interface designs that match cognitive styles will yield higher task completion scores than mismatched ones. H1-b: User interface designs that match cognitive styles will facilitate faster task completion times than mismatched ones.
As previously mentioned, people obtain better results when the learning situation matches their cognitive styles. When the situation matches their style, people can find and process information in their preferred ways (Riding & Sadler‐Smith, 1997). Cognitive overload is caused when people receive too much information to process or when they cannot easily find the desired information (Sweller, 1994). It seems likely that cognitive load may decrease if conditions match the individual’s cognitive style and the user interface. Based on this assumption, this study hypothesizes as follows:
H2: User interface designs that match cognitive styles will yield a lower cognitive load than mismatched ones.
Previous studies have suggested that the level of task complexity also affects decision-making performance (Paquette & Kida, 1988; Speier, Vessey, & Valacich, 2003; Topi, Valacich, & Hoffer, 2005).
24
Cognitive load theory focused on human working memory, cognitive load, and design insights (Sweller, 2004). According to Johnson and Payne (1985), cognitive load increases with increased task complexity, leading to a decrease in decision-making performance. Task complexity also plays an important role in information systems in the interaction between the information systems’ structure and system users’ performance (Jacko, Salvendy, & Koubek, 1995). In particular, with regard to information presentation, task complexity is related to the interaction between information systems and users (Xu et al., 2008). Therefore, this study formulates the following hypotheses:
H3-a: User interface designs that match cognitive styles will moderate task complexity scores.
H3-b: User interface designs that match cognitive styles will moderate the time taken to complete tasks relative to the tasks’ complexity.
25
5. Research Methodology
5.1 Experiment design
The aim of this study was to determine whether the concurrence between cognitive style and interface design had any effect on decision-making performance and cognitive load.
To verify the hypotheses, this study used a 2 x 2 experimental design, with one inter-subject factor and one intra-subject factor. The inter-subject factor was the concurrence between cognitive styles and
interface design at two levels (matched or mismatched). The
intra-subject factor was task complexity (simple or complex). Thus, all subjects performed a simple task and a complex task.
5.2 Concurrence between cognitive styles and
interface design
The method of determining matches between cognitive styles and interface design was driven by theory. Field-independent individuals have a tendency to finding information that they need in whole information. By contrast, field-dependent individuals have a tendency to process information holistically. Cognitive styles have typically been assessed using tasks in which subjects locate a simple figure within
26
complex figures. The group embedded figures test (GEFT) and hidden figures test (HFT) (French, Ekstrom, & Price, 1963) are commonly used to identify individuals’ cognitive styles. This study used the HFT instrument to assess subjects’ cognitive styles in relation to field dependence and independence. Participants were required to find five simple figures within complex shape configurations. In the HFT, 32 complex configurations are split into two sets of 16 complex configurations each. To score the HFT, the number of correct and incorrect answers are counted to produce a total score. Participants’ total scores were determined to establish their cognitive styles. Field-dependent individuals typically have more difficulty finding figures than field independent individuals. This tendency, field-independent individuals usually score higher than field dependent individuals.
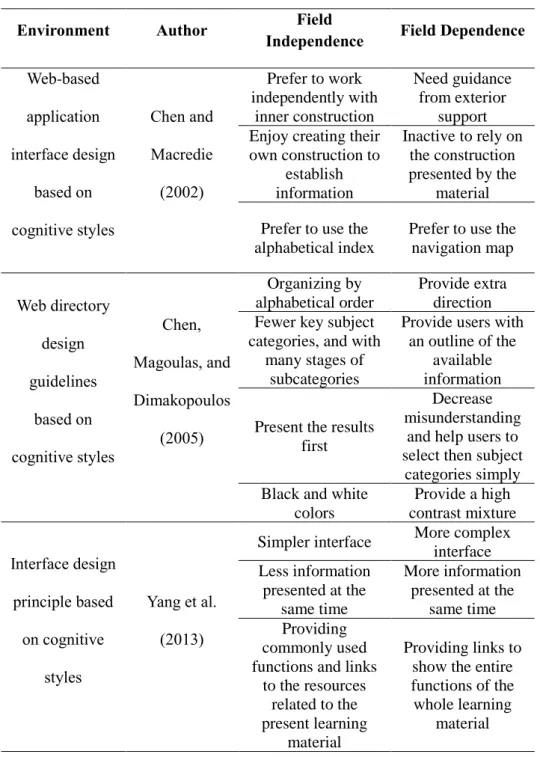
The prototype used for this study was developed to resemble the systems that are used in the swine-farming industry. This study applied the results of previous studies that examined the relationship between cognitive styles and user interface design (Chen et al., 2003; Chen & Macredie, 2002; Yang, Hwang, & Yang, 2013). Table 1 shows the summary of these previous studies. The studies’ stimuli details vary, but all were analyzed using an internet environment and applied cognitive styles.
27
Table 1. Summary of implications for interface designs that matched users’ cognitive styles
Environment Author Field
Independence Field Dependence
Web-based application interface design based on cognitive styles Chen and Macredie (2002) Prefer to work independently with inner construction Need guidance from exterior support Enjoy creating their
own construction to establish information Inactive to rely on the construction presented by the material Prefer to use the
alphabetical index
Prefer to use the navigation map Web directory design guidelines based on cognitive styles Chen, Magoulas, and Dimakopoulos (2005) Organizing by alphabetical order Provide extra direction Fewer key subject
categories, and with many stages of
subcategories
Provide users with an outline of the
available information
Present the results first
Decrease misunderstanding
and help users to select then subject
categories simply Black and white
colors Provide a high contrast mixture Interface design principle based on cognitive styles Yang et al. (2013)
Simpler interface More complex interface Less information presented at the same time More information presented at the same time Providing commonly used functions and links
to the resources related to the present learning
material
Providing links to show the entire functions of the whole learning
28
5.3 Task complexity
Task complexity characteristics followed Campbell’s (1988) definition. He claimed that there were three approaches: (1) general psychological, (2) interaction between task and task doer, and (3) the task complexity’s objective characteristics. We accommodated the object task complexity. According to Campbell (1988), who approached task complexity from an objective standpoint, information load, information multiplicity, or information exchange rate can cause task complexity to increase. He asserted that one of the characteristics of objective task complexity is multiple paths. Multiple paths mean there are several ways to achieve a desired aim. This study designed simple and complex tasks that incorporated the characteristic of multiple paths.
On a swine farm, farmers make decisions in different ways. For example, if the pig house’s temperature is lower than the pigs need, the farmer will try to increase the temperature. The farmer can solve this problem by operating heat lamps, reducing the minimum ventilator rate, or operating heat pads. Similarly, we designed a complex test with a number of different options for completing the task. In the simple test, there were fewer possible ways of completing the task. To resemble the business support systems used in the swine-farming industry, we designed the task with four categories: pig breeding management,
29
environmental management, feeding management, and disease control. For each category, we designed two types of tasks: a simple task and a complex task. Participants had to consider more factors in order to complete the complex task than the simple task.
5.4 Experimental procedure
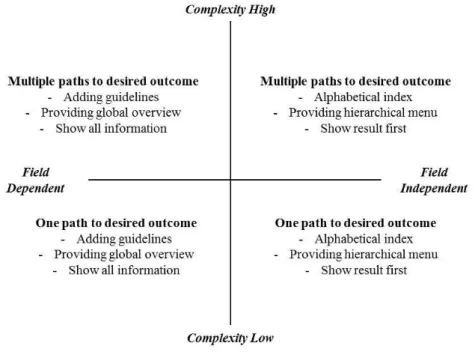
Based on previous studies, the present study applied recommended elements for user interfaces. Figure 3 shows the design principles which this study used in order to develop user interface designs for each cognitive style.
Figure 3. Interface design principles used to develop an interface for each cognitive style
30
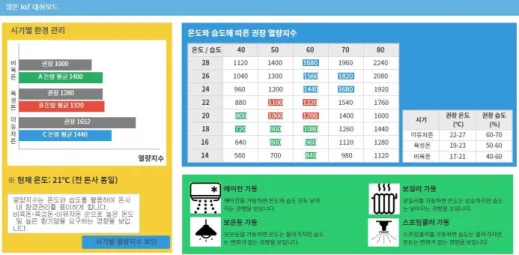
Both prototypes included the same options for completing the tasks. To complete the simple task, only one factor needed to be considered but, in the case of the complex task, there were various factors to consider. Two types of user interfaces for cognitive styles were designed. The field-dependent preferred prototype was designed to provide guidelines, offer a global overview, and show all the information at once (Figure 4). By contrast, the field-independent preferred prototype was designed with a hierarchical menu in Korean alphabetical order and showing exact results first (Figure 5).
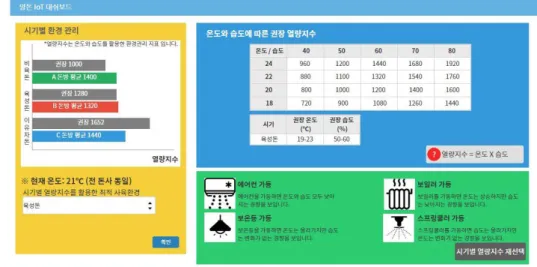
31
Figure 5. Example of a field-independent preferred prototype design
The independent variable was whether participants completed the tasks under matched or mismatched conditions. Matched conditions can be described as field-independent participants using a field-independent preferred user interface or dependent participants using a field-dependent preferred user interface. Mismatched conditions can be described as a field-independent participant using a field-dependent preferred user interface or a dependent participant using a field-independent preferred user interface.
Drawing on the previous studies’ results, the dependent variables selected for this study were decision-making performance and cognitive load. Decision-making performance was related to task outcomes and the time taken to complete tasks. The task score
32
depended on the number of correct answers. Task time was measured for each task. We measured cognitive load using the NASA-TLX (task load index). NASA-TLX was developed by Hart and Staveland (1988) for measuring perceived workload. NASA-TLX is one of the most widely-used instruments for the subjective measurement of cognitive load (Fischer, Lowe, & Schwan, 2008; Hilbert & Renkl, 2009; Smith et al., 2017). Demographic factors such as gender and grade were used as control variables. Also, knowledge of the swine-farming industry, cognitive style, the interface type that participants were given, and attendance at a premier research university were used as control variables. Attendance at a strong research university was used as a control because such a university provides professional research programs for training students. A strong research university contributes to the research field through collaborative research with various companies and public institutions. The undergraduate students from such a university had more opportunity to applying apprenticeships in research labs to training about graduate course. Hence, this study controlled for attendance at a premier research university.
Participants assigned to the two types of interface design took turns in using a dependent preferred interface design and a field-independent preferred interface design. For example, if the first
33
participant was given a field-independent preferred user interface, the second participant was given a field-dependent preferred user interface. The experiment used an online survey format to enable participants to access the experiment through a simple uniform resource locator (URL) address.
Participants were given the task question and the URL address. Participants could simulate using an internet browser such as Internet Explorer, Chrome, Firefox, and so on. Since the screen size can affect user performance (Chen et al., 2003; Maniar, Bennett, Hand, & Allan, 2008), we prevented participants from accessing the experiment via a mobile device. They were required to complete the task by accessing the URL. They cannot move on to the next task without answering or clicking on the embedded URL. After completing the tasks, participants were required to undergo a NASA-TLX assessment in order to analyze the cognitive load. After finishing the NASA-TLX assessment, participants were required to take the HFT test in order to determine each person’s cognitive style.
34
6. Data Analysis and Results
6.1 Data collection
This study conducted an experiment to collect data and examine the study’s hypotheses. Participants were recruited using advertisements asking for help in evaluating swine farm management systems, which were posted on the university’s website. A total of 171 subjects responded, but 25 were excluded because: (1) four participants provided answers that were irrelevant to the task, (2) three participants took longer than two hours per question. (3) five participants took less than 90 seconds to complete all the tasks, and one participant took more than 3 hours and 30 minutes. Therefore, this study analyzed data from 156 participants.
HFT was used to determine participants’ cognitive styles. Their average score was 0.08 (SD = 7.41). The separate scores varied from study to study. In this study, we calculated the median of the participants’ separate scores. Participants who scored lower than 0 were classified as field dependent and those with higher scores were classified as field independent. Table 2 shows the number of participants with each cognitive style and the concurrence of the interface with their cognitive style.
35
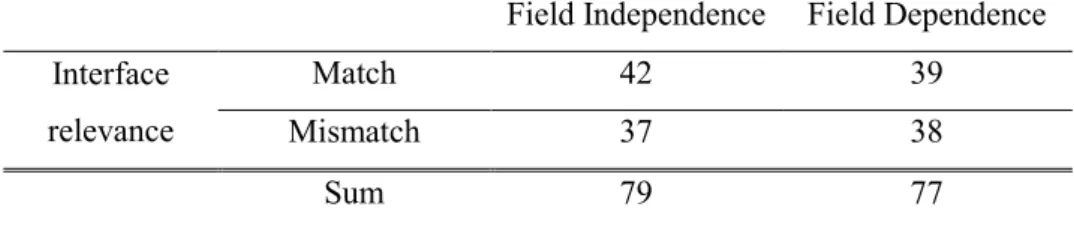
Table 2. Number of cognitive style classifications
Cognitive Styles
Field Independence Field Dependence Interface relevance Match 42 39 Mismatch 37 38 Sum 79 77
6.2 Demographic information
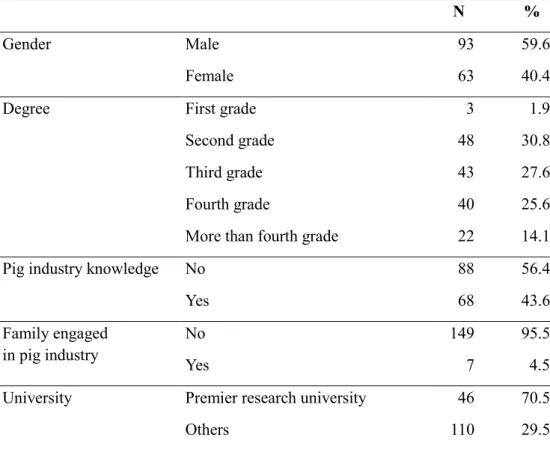
The subjects’ demographic characteristics are shown in Table 3. All the subjects in this study were undergraduate students. Their average age was 22.69 (SD = 2.46). Fifty-nine percent of the subjects were male and the majority of the subjects were sophomores. Fifty-six percent of the subjects had some knowledge of the swine-farming industry and the majority of subjects had no family engaged in the pork industry.
36
Table 3. Participants’ demographic information
N %
Gender Male 93 59.6 Female 63 40.4 Degree First grade 3 1.9 Second grade 48 30.8 Third grade 43 27.6 Fourth grade 40 25.6 More than fourth grade 22 14.1 Pig industry knowledge No 88 56.4
Yes 68 43.6
Family engaged in pig industry
No 149 95.5
Yes 7 4.5
University Premier research university 46 70.5 Others 110 29.5
6.3 Descriptive statistics for the major variables
The aim of this study was to investigate whether the match or mismatch of a user interface with the participant’s cognitive style is related to the participant’s decision-making performance and cognitive load. The effects of the relevance of cognitive style were analyzed using SPSS®.
Table 4 shows the descriptive statistics for the major variables. A correct answer counted as one point per question for both the simple
37
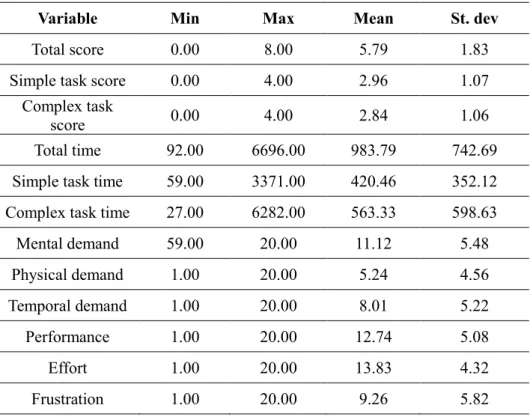
and complex tasks. The average task completion score was 5.79. The average score for the simple task was higher than for the complex task. The time taken to complete a task was measured in seconds and the average time taken to complete all the tasks was 16 minutes. Subjects took much longer to complete complex tasks than simple tasks. Cognitive load was checked with six subscales. Each of scale rated a scale from one to twenty.
Table 4. Descriptive statistics for the major variables
Variable Min Max Mean St. dev
Total score 0.00 8.00 5.79 1.83 Simple task score 0.00 4.00 2.96 1.07
Complex task
score 0.00 4.00 2.84 1.06 Total time 92.00 6696.00 983.79 742.69 Simple task time 59.00 3371.00 420.46 352.12 Complex task time 27.00 6282.00 563.33 598.63 Mental demand 59.00 20.00 11.12 5.48 Physical demand 1.00 20.00 5.24 4.56 Temporal demand 1.00 20.00 8.01 5.22 Performance 1.00 20.00 12.74 5.08 Effort 1.00 20.00 13.83 4.32 Frustration 1.00 20.00 9.26 5.82
38
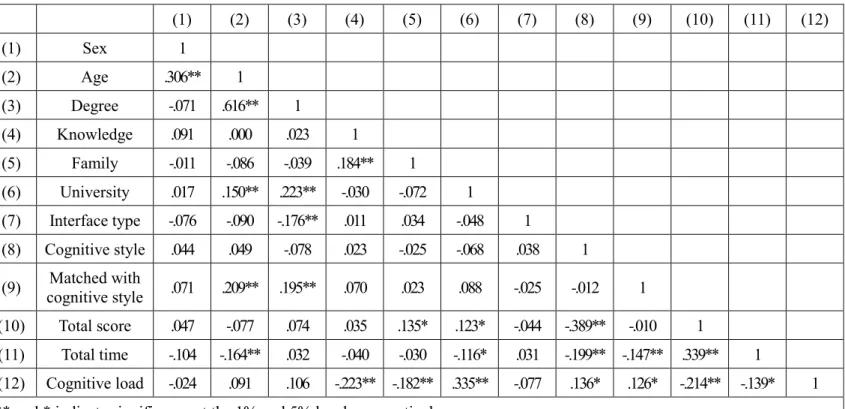
6.4 Correlation analysis.
This study performed a correlation analysis of the relationship between the major variables. The results of the correlation analysis are shown in Table 5. The correlation between age and degree was 0.616, showing strong correlation. This is because students usually enter university in their early twenties. If these two variables were used in regression analysis, they would cause multicollinearity so, in this study, only the degree variable was used in the regression analysis.
39
Table 5. Correlation analysis results for the major variables
(1) (2) (3) (4) (5) (6) (7) (8) (9) (10) (11) (12) (1) Sex 1 (2) Age .306** 1 (3) Degree -.071 .616** 1 (4) Knowledge .091 .000 .023 1 (5) Family -.011 -.086 -.039 .184** 1 (6) University .017 .150** .223** -.030 -.072 1 (7) Interface type -.076 -.090 -.176** .011 .034 -.048 1 (8) Cognitive style .044 .049 -.078 .023 -.025 -.068 .038 1 (9) Matched with cognitive style .071 .209** .195** .070 .023 .088 -.025 -.012 1 (10) Total score .047 -.077 .074 .035 .135* .123* -.044 -.389** -.010 1 (11) Total time -.104 -.164** .032 -.040 -.030 -.116* .031 -.199** -.147** .339** 1 (12) Cognitive load -.024 .091 .106 -.223** -.182** .335** -.077 .136* .126* -.214** -.139* 1 ** and * indicate significance at the 1% and 5% levels, respectively
40
6.5 Hypothesis test
This study’s goal was to verify the effect of the match or mismatch of a user interface with a user’s cognitive style. To achieve this goal, the study performed a regression analysis and Table 6 shows the variables that were used in the regression analysis.
41
Table 6. Description of the variables Variables
Dependent Variables
Task score Correct answer for each question= 1 Incorrect answer for each question = 0 (total number of questions = 8) Task time Seconds
Cognitive load 20-point Likert scale (1 = very low load, 20 = very high load)
Independent Variables
Matched with
cognitive style Mismatch = –1 Match = 1 Task complexity Simple task = –1
Complex task = 1 Matched with cognitive style* Task complexity Mismatch*Simple task = 1 Mismatch*Complex task = –1 Match*Simple task = –1 Match*Complex task = 1 Control variables Gender Male = 1 Female = 0 degree First grade = 1
Second grade = 2 Third grade = 3 Fourth grade = 4
More than fourth grade = 5
Knowledge Have prior knowledge of the pig = 1 No prior knowledge of the pig = 0 family Have family working in pig industry = 1
No family working in pig industry = 0 university Premier research university = 1
Others = 0
Cognitive style Field independent = 1 Field dependent = 2
Interface type Field independent preferred= 1 Field dependent preferred = 2
42
6.5.1 Task score
To analyze the effect of the match or mismatch of a user interface design with a user’s cognitive style on the task completion score, a regression analysis was performed as follows:
𝑌𝑠𝑐𝑜𝑟𝑒= 𝑎 + 𝑏1∗ 𝑋𝑚𝑎𝑡𝑐ℎ𝑒𝑑 𝑤𝑖𝑡ℎ 𝑐𝑜𝑔𝑛𝑖𝑡𝑖𝑣𝑒 𝑠𝑡𝑦𝑙𝑒+ 𝑏2∗ 𝑋𝑡𝑎𝑠𝑘 𝑐𝑜𝑚𝑝𝑙𝑒𝑥𝑖𝑡𝑦+ 𝑏3
∗ 𝑋𝑚𝑎𝑡𝑐ℎ𝑒𝑑 𝑤𝑖𝑡ℎ 𝑐𝑜𝑔𝑛𝑖𝑡𝑖𝑣𝑒 𝑠𝑡𝑦𝑙𝑒∗𝑡𝑎𝑠𝑘 𝑐𝑜𝑚𝑝𝑙𝑒𝑥𝑖𝑡𝑦+ 𝑏4∗ 𝑋𝐺𝑒𝑛𝑑𝑒𝑟+ 𝑏5∗ 𝑋𝑑𝑒𝑔𝑟𝑒𝑒 + 𝑏6∗ 𝑋𝑘𝑛𝑜𝑤𝑙𝑒𝑑𝑔𝑒+ 𝑏7∗ 𝑋𝑓𝑎𝑚𝑖𝑙𝑦+ 𝑏8∗ 𝑋𝑢𝑛𝑖𝑣𝑒𝑟𝑠𝑖𝑡𝑦+ 𝑏9∗ 𝑋𝑖𝑛𝑡𝑒𝑟𝑓𝑎𝑐𝑒 𝑡𝑦𝑝𝑒 + 𝑏10∗ 𝑋𝑐𝑜𝑔𝑛𝑖𝑡𝑖𝑣𝑒 𝑠𝑡𝑦𝑙𝑒+ 𝑏11∗ 𝑋𝑡𝑖𝑚𝑒 𝑝𝑒𝑟
Figure 6. Mean task completion scores for matched and mismatched
The means of the task completion scores for the two groups are illustrated in Figure 6. The simple task completion score was higher when
43
participants completed the task using an interface that matched their cognitive style.
The results of the regression analysis of the task completion scores is shown in Table 7. There was no significant difference in the task completion scores between the independent variables. Also, the effect of the interaction between the task completion scores and task complexity was not significant.
Table 7. Regression analysis results (y = task score)
Coefficient B S. E. Stand. B. t p-value (Intercept) 3.483 .342 10.182 .000 Match -.017 .058 -.016 -.303 .381 Match * complexity -.012 .056 -.011 -.211 .417 Task complexity -.116 .059 -.109 -1.966 .025* Time .002 .001 .183 3.223 .001** Gender .146 .116 .068 1.260 .104 Degree .019 .055 .019 .338 .368 Knowledge .045 .116 .021 .389 .349 Family .608 .276 .118 2.202 .014* University .244 .127 .105 1.917 .028* Cognitive style -.639 .114 -.301 -5.613 .000** Interface type -.050 .114 -.023 -.435 .332 R2 = 0.169, adj R2 = 0.139
44
6.5.2 Time
To analyze the effect of the match or mismatch of a user interface design with cognitive styles on the time taken to complete the tasks, a regression analysis was performed as follows:
𝑌𝑡𝑖𝑚𝑒= 𝑎 + 𝑏1∗ 𝑋𝑚𝑎𝑡𝑐ℎ𝑒𝑑 𝑤𝑖𝑡ℎ 𝑐𝑜𝑔𝑛𝑖𝑡𝑖𝑣𝑒 𝑠𝑡𝑦𝑙𝑒+ 𝑏2∗ 𝑋𝑡𝑎𝑠𝑘 𝑐𝑜𝑚𝑝𝑙𝑒𝑥𝑖𝑡𝑦+ 𝑏3
∗ 𝑋𝑚𝑎𝑡𝑐ℎ𝑒𝑑 𝑤𝑖𝑡ℎ 𝑐𝑜𝑔𝑛𝑖𝑡𝑖𝑣𝑒 𝑠𝑡𝑦𝑙𝑒∗𝑡𝑎𝑠𝑘 𝑐𝑜𝑚𝑝𝑙𝑒𝑥𝑖𝑡𝑦+ 𝑏4∗ 𝑋𝐺𝑒𝑛𝑑𝑒𝑟+ 𝑏5∗ 𝑋𝑑𝑒𝑔𝑟𝑒𝑒 + 𝑏6∗ 𝑋𝑘𝑛𝑜𝑤𝑙𝑒𝑑𝑔𝑒+ 𝑏7∗ 𝑋𝑓𝑎𝑚𝑖𝑙𝑦+ 𝑏8∗ 𝑋𝑢𝑛𝑖𝑣𝑒𝑟𝑠𝑖𝑡𝑦+ 𝑏9∗ 𝑋𝑖𝑛𝑡𝑒𝑟𝑓𝑎𝑐𝑒 𝑡𝑦𝑝𝑒 + 𝑏10∗ 𝑋𝑐𝑜𝑔𝑛𝑖𝑡𝑖𝑣𝑒 𝑠𝑡𝑦𝑙𝑒
The means of time taken for the two groups are illustrated in Figure 7. Participants finished tasks faster when they used the interface that matched their preferred cognitive style.
45
The results of the regression analysis for time taken are shown in Table 8. Participants completing tasks under matched conditions finished their tasks more quickly than under mismatched conditions (H1-b, one-tailed test, p < 0.05), but the effect of the interaction between task time and task complexity was not significant.
Table 8. Regression analysis results (y = time per task)
Coefficient B S. E. Stand. B. t p-value (Intercept) 139.318 37.685 3.697 .000 Match -11.174 6.468 -.095 -1.728 .043* Match * complexity -3.181 6.300 -.027 -.505 .307 Task complexity 35.500 6.300 .302 5.635 .000** Gender -14.387 13.040 -.060 -1.103 .135 Degree 6.649 6.213 .061 1.070 .143 Knowledge -6.771 13.014 -.029 -.520 .302 Family -14.325 31.071 -.025 -.461 .323 University -25.459 14.243 -.099 -1.788 .037* Cognitive style -32.870 12.676 -.140 -2.593 .005* Interface type 9.307 12.856 .040 .724 .235 R2 = 0.138, adj R2 = 0.109
46
6.5.3 Cognitive load
To analyze the effect of the match or mismatch of a user interface design with cognitive styles on cognitive load, a regression analysis was performed as follows:
𝑌𝑐𝑜𝑔𝑛𝑖𝑡𝑖𝑣𝑒 𝑙𝑜𝑎𝑑 = 𝑎 + 𝑏1∗ 𝑋𝑚𝑎𝑡𝑐ℎ𝑒𝑑 𝑤𝑖𝑡ℎ 𝑐𝑜𝑔𝑛𝑖𝑡𝑖𝑣𝑒 𝑠𝑡𝑦𝑙𝑒+ 𝑏2∗ 𝑋𝐺𝑒𝑛𝑑𝑒𝑟+ 𝑏3∗ 𝑋𝑑𝑒𝑔𝑟𝑒𝑒+ 𝑏4 ∗ 𝑋𝑘𝑛𝑜𝑤𝑙𝑒𝑑𝑔𝑒+ 𝑏5∗ 𝑋𝑓𝑎𝑚𝑖𝑙𝑦+ 𝑏6∗ 𝑋𝑢𝑛𝑖𝑣𝑒𝑟𝑠𝑖𝑡𝑦+ 𝑏7∗ 𝑋𝑖𝑛𝑡𝑒𝑟𝑓𝑎𝑐𝑒 𝑡𝑦𝑝𝑒+ 𝑏8 ∗ 𝑋𝑐𝑜𝑔𝑛𝑖𝑡𝑖𝑣𝑒 𝑠𝑡𝑦𝑙𝑒
The means of the cognitive load for the two groups are illustrated in Figure 8. Participants experienced a greater cognitive load when they used the interface that matched their preferred cognitive style.
47
The results of the regression analysis of cognitive load is shown in Table 9. There was no significant difference in cognitive load between the independent variables.
Table 9. Regression analysis results (y = cognitive load)
Coefficient B S. E. Stand. B. t p-value (Intercept) 8.281 1.266 6.541 .000 Match .334 .217 .115 1.538 .063 Gender -.185 .438 -.031 -.422 .337 Degree .036 .209 .013 .171 .432 Knowledge -1.169 .437 -.200 -2.674 .004* Family -1.664 1.044 -.119 -1.594 .057 University 2.007 .478 .316 4.194 .000** Cognitive style .957 .426 .165 2.248 .013* Interface type -.339 .432 -.059 -.785 .217 R2 = 0.216, adj R2 = 0.173
48
7. Discussion
7.1 Summary of findings
The main purpose of this study was to investigate the effects of interface designs that are matched or mismatched with cognitive styles and the effects of interaction between task complexity and decision-making performance. To verify our hypotheses, a 2 x 2 experiment was conducted and 156 responses were analyzed. The data was analyzed using regression analyses. The results showed that the match or mismatch of an interface with cognitive style had no effect on the task completion score, but did affect the time taken by participants to complete the task. In addition, there was no significant effect on cognitive load. Task complexity had a significant effect on both the task score and the time taken to complete the task, but the interaction effects were not significant for task score and time taken. Table 10 illustrates the results of the hypotheses tests.
49
Table 10. Hypotheses test results.
Hypothesis Support
H1-a User interface designs that match cognitive styles will yield higher task completion scores than mismatched ones.
Not Supported
H1-b User interface designs that match cognitive styles will facilitate faster task completion times than mismatched ones.
Supported
H2 User interface designs that match cognitive styles
will yield a lower cognitive load than mismatched ones.
Not Supported
H3-a User interface designs that match cognitive styles
will moderate task complexity scores. Not Supported
H3-b User interface designs that match cognitive styles will moderate the time taken to complete tasks
relative to the tasks’ complexity.
Not Supported
H1-a and H1-b relate to the effects of interfaces matched or mismatched with users’ cognitive styles on decision-making performance. As shown in Table 10, an interface matched or mismatched with a user’s cognitive style had a significant effect on the time taken to complete the task, but the hypothesis related to the task score (H1-a) was not supported.
H2 related to the effects of interfaces matched or mismatched with users’ cognitive styles on cognitive load. Interfaces matched or mismatched with cognitive styles had a no significant effect on cognitive load.
50
complexity and decision-making performance. There was no significant interaction effect on either task score or time taken to complete the task.
7.2. Academic Contributions
First, the present study is one of the first to examine the effect of a user interface based on cognitive styles on decision-making performance in the field of agriculture. With developments in information and communication technology (ICT), precision livestock farming has attracted increasing interest for increasing productivity and efficiency considering the sustainability of resources and animal welfare (Berckmans, 2006; Wathes, Kristensen, Aerts, & Berckmans, 2008; Werkheiser, 2018). Many studies on precision livestock farming have mainly investigated backend systems such as database systems, network protocols, and integration with other modules (Debauche et al., 2018; Eastwood, Chapman, & Paine, 2012; Ojha, Misra, & Raghuwanshi, 2015). Human-computer interaction and hypermedia learning are currently active and vibrant research fields in the context of a user interface with an individual’s cognitive styles with learning material. This is because a user interface is an important element to consider when developing information systems (Nikander et al., 2015). However, user interface design in the field of agricultural information systems has attracted less interest.
51
Therefore, this study contributes to the improvement of agricultural information systems by investigating user interface design based on cognitive styles.
Second, this study applied the notion of cognitive styles to the user interface of an agricultural information system. According to this notion, people process information quickly when it is presented in their preferred cognitive style. This study’s results indicate that users finished their tasks quickly when they were offered a user interface with their preferred cognitive style. Similarly, an agricultural information system with a user interface based on users’ preferred cognitive styles can improve their decision-making efficiency.
Third, this study supports the argument for the existence of the dilemma related to the speed-accuracy tradeoff. Existing literatures on decision-making performance argued that decision-makers often face a dilemma related to the speed-accuracy tradeoff (Chittka, Skorupski, & Raine, 2009; Rinkenauer, Osman, Ulrich, Müller-Gethmann, & Mattes, 2004; Wickelgren, 1977). This tradeoff explains the fact that if people complete a task quickly, they make mistakes more often than when they complete the task slowly. This study’s participants may also have experienced the dilemma related to the speed-accuracy tradeoff. This study’s results showed that participants who were offered a user interface with their preferred
52
cognitive style finished both simple and complex tasks quickly. However, the score was not significantly affected by a match between participants’ cognitive style and the user interface design. This study assumed that the speed-accuracy tradeoff might explain the obtained results.
A user interface designed based on participants’ preferred cognitive style should make it easier for them to find information without having to spend more cognitive effort. However, less cognitive effort can result in intuition-based decision-making (Calabretta, Gemser, & Wijnberg, 2017). Intuition refers to making a decision or judgment based on one’s gut feeling (Blackler & Popovic, 2015; Hodgkinson, Langan‐Fox, & Sadler‐Smith, 2008). Intuitively processing information can reduce the decision-making effort (Salas, Rosen, & Diaz Granados, 2010). However, intuition is the product of knowledge gained from experience (Diefenbach & Ullrich, 2015). This study’s participants did not have enough experience to develop a suitable intuition about the information systems used in the swine industry. Therefore, this study presumed that as the speed of acquiring information using the interface itself is increasing, the speed of problem-solving and the possibility of making a mistake are both increased.
Lastly, this study’s findings contribute to improving the usability of agricultural information management systems. For the last 20 years, ICT has been incorporated in the field of agriculture to increase farm productivity;
53
however, ICT is not yet widely used in this field. One reason is that farmers have relatively low educational attainment and face difficulties in using unfamiliar technologies (Cen & Zhang, 2010). In addition, farmers mainly work in rural areas that have poorer information and communication infrastructure than cities (Skerratt, 2010). The lack of infrastructure and low interest in ICT often limits the understanding and use of agricultural information systems (Zhang, Wang, & Duan, 2016).
Overall, even if systems are well developed, if a user does not realize their usefulness or necessity, they will remain useless. One possible way of improving system usability and accessibility is designing a user interface by considering human factors (Tory & Moller, 2004). In this context, this study investigated the influence of a user interface based on cognitive styles, one such human factor, on decision-making performance. The results indicate that designing a user interface based on cognitive styles, for example, with an intuitive layout, can be one of the possible ways to increase the usability of agricultural information systems.
54
7.3. Practical Suggestions
This study has implications for improving users’ decision-making performance through user interface design for agricultural and general information systems.
First, this study suggests the importance of the user interface as a factor that can increase decision-making performance in the field of agricultural. Studies on enhancing performance through a user interface based on cognitive styles have been actively carried out mainly in the field of educational psychology (e.g., Hederich-Martínez & Camargo-Uribe, 2016; Mebane & Johnson, 2017). Most previous studies on agricultural information systems have focused on system elements other than interfaces to improve the system utilization. However, poor user interfaces have often been noted as a problem in agricultural information systems (e.g., McCown, 2002; Lindblom et al., 2017; Devitt, 2018). The present study’s results highlight user interface research as one way to enhance the effectiveness of agricultural information systems.
Second, the present study proposes the need to design user interfaces differently depending on users’ cognitive styles. This study’s results show that users can make faster decisions when using an interface that matches their cognitive style. These findings can serve as a guide for interface design