Research Report 16-14
A Study on the Effects of Korea-China FTA on the Korea’s Petroleum Industry
Saesin Oh
Research Staff
Head Researcher: Research Fellow Saesin Oh
External Participant: Sang-kee Kim, Professor of Silla University
ABSTRACT 1. Research Purpose
The free trade agreement between Korea and China has come in effect from the end of 2015 after it had reached a final deal on November 2014 through over three years of negotiation. However, the agreement is considered to be insufficient in terms of market openness including petroleum sectors as one of the participants is a socialist state.
Since Korean petroleum industry has created substantial national wealth through exporting petroleum products manufactured using imported crude oil and taken advantage of geographical proximity for trading with China, the FTA negotiation would be hopeful but the result was disappointing,
Considered of the growth of Chinese petroleum industry, there are concerns that competitiveness of Korean petroleum products in the China market may get weaker if opening the market is delayed and Chinese exports of petroleum products to Korea will accelerate when both markets are completely open.
This study is aiming at researching opportunities and challenges Korea faces on trading petroleum products with China based on the FTA articles, and drawing conclusions that addresses requirements for related industries and governmental policies in Korea to realize the purpose of the FTA.
2. Summary
Korean and Chinese petroleum industries are comparable in many ways. The both have crude oil refinery capacities above each domestic demand while they all import much of crude oil abroad.
They differ, however, in growth rate of petroleum demand so as do their economic level and growth rate.
Korean petroleum industry shows sluggish growth of its oil refinery capacity as its domestic oil demand growth is slack and its foreign exports increase whereas Chinese petroleum industry invests in constructing new refineries based on rapid growth of its domestic petroleum consumption and its foreign exports are gradually increasing.
Further, Korea has four oil companies which are privately owned crude refiners while in China three national oil corporations (CNPC, Sinopec, CNOOC) with all of upstream and downstream assets are dominant and local and small refiners are on the way to slowly expand their market share.
Finally, pricing regime of the both countries needs to be discussed. In Korea, domestic prices of petroleum products are determined by the private refiners while despite a series of reforming of petroleum pricing regime, China still has the pricing mechanism that domestic fuel is priced by NDRC, a governmental branch of China.
When it comes to the both countries' international trading trends of petroleum products, gasoline, diesel, jet
fuel, lubricating base oil, and asphalt are main exports in Korea, showing continuously a surplus of total 10~20 billion dollars from 2010. China's petroleum product is usually making trade deficit as a whole although some products such as jet fuel, gasoline and diesel are showing trade surpluses.
In their bilateral trading between Korea and China, the former's exports to the latter is dominant. Korea recorded a surplus of 6.1 billion dollars in petroleum trading with China in 2010 and expanded it to 10 billion dollars in 2011. After then it was decreasing and low oil prices in 2015 even drew it down to 3.9 billion dollars.
Under these circumstances, the extent of petroleum market openness from Korea-China FTA that recently took effect is assessed as unsatisfactory. It is because most export products to China such as diesel, lubricating base oil and asphalt but jet fuel are classified into the sensitive or highly sensitive tracks. In addition, as MFN (Most Favored Nation) tariff rates were designated as basic rates that are applied to determining preferential rates of the FTA, it should be noted that the reality which execute rates of China that are applied to actual trading with Korea are lower than the MFN rates wasn't reflected in the agreement as opposed to FTAs that China already signed with other Asian countries such as ASEAN.
Another problem arises from that China petroleum market is lack of transparency and credibility. Considering China pricing mechanism of domestic petroleum that is determined by the government, market penetration of foreign petroleum companies to China may be impossible in fact if the government prices the domestic products lower than international oil prices as it did during the time of high oil prices. Further, China can increase domestic market share of its state-owned oil companies through overcoming their inefficiency based on their vertical integrated structure and government subsidies.
It should be also noted that Chinese competitiveness of petroleum products is being rapidly improved. As stated above, Chinese government are seeking to promote China petroleum industry as an export industry by forcing the domestic refineries to improve quality and efficiency of their products. In the mean time, it is envisaged that competitiveness of Chinese petroleum exports has been advanced through related indicators although it is still much weaker than from Korea. Chinese government also guided domestic refiners to upgrade their facilities by reinforcing quality standards of auto fuels for domestic use. Sulphur contents for gasoline and diesel are scheduled to regulate below 10ppm from 2017.
Despite these dynamics of Chines petroleum industry, the FTA between Korea and China is regarded as opportunities for new market creation to Korean petroleum industry as the latter has still considerable competitiveness advantage over the former. RCA (Revealed Comparative Advantage), TI (Trade Intensity) and TC (Trade Complementarity) indexes for the both countries petroleum trading are showing this reality well.
Thus, overcoming the challenges and exploiting opportunities the Korean industry faces in the FTA will be the key to maximizing the effect of market openness for the both countries.
Existing studies related to analysing the effects of Korea-China FTA have limitation in the aspects that they
have been worked without reflecting China's non-liberalized market features and under conditions where the both petroleum markets are completely open as a result of the FTA. From this perspective, this study is designed to analyze the effects theoretically using the game theory under consideration of China's petroleum market features. For these purpose three theoretical models are adopted: Model 1 assumes a situation where Country 1 having one private and monopolistic refiner signs FTA with Country 2 having the same type of a refiner. Model 2 considers other industrial environment in that Country 1 with one private and monopolistic refiner underwrites the agreement with Country 2 operating an vertically integrated state-owned oil company. Model 3 takes the world where Country 1 with one private and monopolistic refiner make the agreement with Country 2 operating an vertically integrated but privately owned oil company. Under these model structures, firm profit and social welfare of each country at sub-perfect Nash equilibrium are analyzed and some conclusions are made as follows.
Firstly, in the case of larger cost inefficiency of the vertically integrated firm in Country 2, the refiner's profit growth in Country 1 from FTA is highest in Mode 2 that most reflects petroleum industry structures in the both countries while it is highest otherwise in Model 3. It means that the both markets should be open as soon as possible for Korean refiners under the condition where Chines oil companies have much higher costs.
Secondly, social welfare growth of Country 1 from FTA is expected to be highest in Model 3 but to be lowest in Model 2. It means that Korea government doesn't have much incentive to remove petroleum tariffs between the both countries as soon as possible.
Finally, Model 3 is the best choice for growth of the social welfare and refiner's profit in Country 1 if inefficiency of the company in Country 2 is relatively small and thus petroleum market's liberalization and state- owned oil companies' privatization in China are the key for Korea to realize the world of Model 3.
Based on above analysis, following measures from Korean government and firms are required for Korea to take a full fruit from Korea-China FTA.
The first is that diversification of Korea refiners into upstream businesses such as shale gas development in China using Korea-China FTA should be considered as export competition of petroleum products in Asian market is getting strong.
Secondly, revision of rules of origin for lubricating base oil and accelerating tariff reduction of petroleum products in Korea-China FTA needs to be discussed in negotiations of the FTA additional process and RCEP as well as requiring China to liberalize its petroleum market.
Thirdly, considering the point that China doesn't impose any tariff on its crude oil imports, Korea needs to shift the existing tariff levied on its crude oil imports into the form of internal tax to prepare the future where tariff barriers of petroleum industry between the both countries are completely removed. In addition, based on recent experiences that China has heightened non-tariff barriers on imports from Korea due to the Korea's THAAD allocation issue, Korea is required to respond to such measures through strictly applying its fuel quality
regulations to China's exports of petroleum products.
3. Research Results and Policy Suggestions
If Korea wants to enjoy wholly positive effect of FTA with China, acceleration of market liberalization and equitable tariff reduction between the both countries are needed as well as enhancing Chinese market transparency should be preceded. To meet those requirements, Korea government needs to utilize additional negotiation process of Korea-China FTA or RCEP negotiation.
In addition, revision or utilization of petroleum related policies should be reviewed. Tariff imposed on crude oil imports that may become reverse discrimination to Korean petroleum products in domestic market should be reconsidered as the Chinese products are expected to increase exports to Korea in the long-term as a result of the FTA. Further, Korean certification process for automotive fuel quality is required to be reinforced as a non-tariff instrument to response to China's unexpected non-tariff measures.
Korean refiners are required to exploit the FTA for diversifying their oil related businesses considering intensifying competition of petroleum exports in Asia. To materialize this strategy, they should be committed to keep in touch with China oil companies.
Table of Contents
Chapter 1. Introduction··· 12
Chapter 2. Comparison of Korea’s and China’s Petroleum Industries ··· 13
1. Structure of Oil Market ··· 13
A. Supply and Demand of Petroleum ··· 13
B. Petroleum Corporations ··· 16
C. Price Framework ··· 19
2. Trade Structure of Petroleum Products ··· 20
Chapter 3. Korea-China FTA and Korea’s Oil Industry ··· 29
1. Major Agreed Descriptions for Korea’s Oil Industry··· 29
A. Agreed Descriptions for Petroleum Products ··· 29
B. Definition of the Country of Origin ··· 32
C. Differentiation from Existing China-led FTAs ··· 33
2. Problems of Market Conditions ··· 34
A. China’s Methods of Deciding Prices ··· 34
B. Characteristics of Petroleum Corporations ··· 35
C. Competitiveness of Petroleum Products ··· 39
Chapter 4. Analysis on Effects of Korea-China FTA ··· 46
1. Research Studies Regarding Korea-China FTA ··· 46
2. Theoretical Studies Applying the Asymmetry of Korea’s and China’s Oil Industries ··· 47
A. Model Overview ··· 47
B. Model 1: Vertically-integrated companies are non-existent in the oligopoly market ··· 47
C. Model 2: Vertically-integrated firms in the integrated oligopoly market ··· 55
D. Model 3: Vertically-integrated corporations in the oligopoly market ··· 61
E. Comparisons of Effects after Signing of FTA by Models ··· 67
3. Interpretations on the Results of Model Analysis ··· 70
Chapter 5. Countermeasures of Korea’s Oil Industry ··· 71
1. Business Diversification of Petroleum Companies ··· 71
2. Countermeasures by Korea ··· 72
A. Improvements in Negotiations··· 72
B. Improvements in Korean System ··· 77
Chapter 6. Conclusion ··· 80
References ··· 81
Appendix 1 ··· 86
Appendix 2 ··· 87
Appendix 3 ··· 88
List of Tables
Table 2-1. Korea’s Petroleum Products Supply-Demand Balance ··· 15
Table 2-2. China’s Petroleum Products Supply-Demand Balance ··· 15
Table 2-3. Refining Capacity of Korea’s Petroleum Corporations ··· 16
Table 2-4. Crude Oil Production by Companies in China ··· 17
Table 2-5. Current Status of Refinery Facilities by Chinese Companies ··· 18
Table 2-6. Changes in Price Framework of Chinese Petroleum Products ··· 20
Table 2-7. Exports of Korean Petroleum Products ··· 20
Table 2-8. Imports of Korean Petroleum Products ··· 21
Table 2-9. Exports of Chinese Petroleum Products ··· 23
Table 2-10. Imports of Chinese Petroleum Products ··· 24
Table 2-11. Percentages of Korea’s Petroleum Products Exports to China (Sum) ··· 26
Table 2-12. Percentages of Korea’s Petroleum Products Exports to China by Items (Sum) ··· 27
Table 3-1. Korea-China FTA Agreed Descriptions for Major Petroleum and Chemical Products ··· 30
Table 3-2. China’s Current Applied Rate and Korea-China FTA Conventional Rate ··· 31
Table 3-3. China’s Tariff Rates for Petroleum Products Against Major Asian Countries (As of 2016) ···· 33
Table 3-4. Current Status of Oil Production of Three Major Oil Companies in China ··· 36
Table 3-5. China’s Plans to Construct and Expand Refinery Facilities During the 13th Five-Year Plan ·· 37
Table 3-6. Changes in Development of China’s Oil Refinery Industry ··· 39
Table 3-7. Technical Index Changes of China’s Major Petroleum Corporations (Crude Oil) ··· 40
Table 3-8. Changes in Capacities of Chinese Refinery Facilities After the 2000s ··· 41
Table 3-9. Advanced Technology Levels of Intermediate Crude Oil Industries in Major Countries (As of 2013) ··· 41
Table 3-10. Comparisons of Technological Competitiveness of Major Countries’ Petrochemical Industries42 Table 3-11. RCA Index by Petroleum Products in Korea and China ··· 42
Table 3-12. Trade Intensity Index by Petroleum Products in Korea and China··· 43
Table 3-13. Trade Complementarity Index between Korea and China··· 44
Table 4-1. Comparisons Before and After an FTA Using Model 1 ··· 53
Table 4-2. Comparisons Before and After an FTA Using Model 2 ··· 60
Table 4-3. Comparisons Before and after FTA Using Model 3 ··· 66
Table 5-1. Major Issues Regarding RCEP ··· 73
Table 5-2. Strategies by Major RCEP Member Countries ··· 73
Table 5-3. MFN Tariff Rates of RCEP Member Countries in Petrochemical Sector ··· 76
Table 5-4. Comparisons of Quality Standards of Automobile Gasoline between Korea and China ··· 79
Table 5-5. Comparisons of Quality Standards in Automobile Diesel between Korea and China ··· 79
List of Figures
Figure 2-1. Crude Oil Supplies in Korea and China ··· 13
Figure 2-2. Crude Oil Refining Capacity in Korea and China ··· 14
Figure 2-3. Current Status of Refining Facilities by Chinese Companies ··· 18
Figure 2-4. Trade Balance by Korean Petroleum Products ··· 22
Figure 2-5. Trade Balance by Chinese Petroleum Products ··· 25
Figure 2-6. Korea’s Petroleum Products Exports to China ··· 25
Figure 2-7. Korea’s Imports of Chinese Petroleum Products ··· 27
Figure 2-8. Trade Balance Surplus of Korea’s Petroleum Products Exports to China ··· 28
Figure 3-1. Comparisons of Chinese Gasoline/Transportation Diesel Prices and International Crude Oil Prices 35 Figure 3-2. Asset Structures of China’s Two Major Petroleum Corporations (As of 2015) ··· 36
Figure 3-3. Refining Capacity by Chinese Oil Corporations During the 13th Five-Year Plan ··· 38
Figure 4-1. Overview of Model 1 ··· 48
Figure 4-2. Overview of Model 2 ··· 55
Figure 4-3. Overview of Model 3 ··· 62
Figure 4-4. Comparisons of Company Profit Effects after FTA by Models ( ) ··· 68
Figure 4-5. Comparisons of Company Profit Effects after FTA by Models ( ) ··· 69
Figure 4-6. Comparisons of Social Welfare Effects after FTA by Models ··· 69
Figure 5-1. Shale Gas and Other Natural Gas Production in Selected Countries in 2040 ··· 72
Figure 5-2. Comparisons of Lube Base Oil, Feedstock Prices, and Added Value Ratio ··· 75
Chapter 1. Introduction
Negotiations for the Korea-China FTA1 began in 2012 and resulted in a signed agreement in November 2014, following its ratification in the National Assembly. It has been effective since December 2015.
The FTA aims to eradicate all the institutional barriers hindering trade of products and services to boost economic activities among the two countries. However, for either political or economic reasons, both countries hope to protect some of their industries or alleviate economic impacts. Therefore, the agreement is inclined to be for gradual opening, incomplete markets rather than fully open markets. This may continue for some time because China is still under a communist system with an incomplete market framework. In comparison with other existing FTAs, then, the effectiveness of the Korea-China FTA has been relatively low.2 The Korean government announced that it had opened the market by more than 90%, based on the number of items sold in China, but unlike FTAs with the United States and European Union, which lifted more than 80% of tariffs from day one, the Korea-China FTA will only lift tariffs from 41% of items within 5 years and 71% within 10 years.
In addition, in order to protect Korea’s agricultural and fishery industry, the manufacturing industry is led by China, putting a damper on the expectations of related industries regarding their expansion of exports to China.
Korea’s petroleum industry is expected to be similarly affected.
The opening of the Chinese market plays a critical role in the advancement of Korea’s petroleum industry, which currently imports most resources from foreign countries. Korea’s petroleum industry has been creating value by exporting a large proportion of petroleum products, produced with imported crude oil, to overseas markets, while enjoying a strong trade presence with its close proximity to China. Korea’s petroleum industry has therefore paid keen attention to the results and timing of the Korea-China FTA more than other industries.
However, according to the FTA agreement, it will take more than 15 years for China to lift tariffs on most petroleum products. As this affects Korea’s leading export items, it is a disappointment to Korea’s oil refining companies that compete with other Asian countries, including Singapore, for shares of the Chinese market.
Meanwhile, in line with China’s economic growth and rising oil consumption, the number of its refining facilities has increased rapidly, raising its self-sufficiency and petroleum products exports. This growth coupled with delayed market opportunities mean that the presence of Korean petroleum corporations in China may become even weaker. Also, if China’s petroleum products become completely tariff-free after 15 years, more and more of them will be competing on the Korean market.
The following study focuses on identifying opportunities for Korea’s petroleum industry in China and examining possible responses that the industry and government should take. The study will consist of the following chapters. In Chapter 2, it will compare the petroleum industries of South Korea and China by taking a closer look at their petroleum market and trade structures. Specifically, it will compare and analyze the supply and demand of petroleum in Korea and China, characteristics of petroleum corporations, price systems of petroleum products, and imports and exports of petroleum products between the two countries. In Chapter 3, the problems involving the Korea-China FTA from the perspective of Korea’s petroleum industry will be examined.
We will look at local content requirements in the petroleum sector and issues stemming from certain regulations of the country of origin. We will also look at the problems related to China’s price framework (as it can impact the trade expansion of Korea’s petroleum corporations regardless of the FTA), the characteristics of petroleum corporations in China, and the competitiveness of Chinese petroleum products. In Chapter 4, we will evaluate the effects of opening more markets by designing several theoretical models and applying the petroleum market conditions of Korea and China. In Chapter 5, based on the aforementioned issues and theoretical implications, we will suggest some feasible measures to take at corporate and government levels. Lastly, Chapter 6 presents an overall analysis and comprehensive summary of research findings.
1 Free Trade Agreement
2 Korea-China FTA Slated to be Effective; Elimination of Tariffs to be Minimal due to Slow Market Opening; Iron and Fire Steel May Enjoy Great Benefits while Farmers and SME Face Damages Kyunghyang Shinmun (November 30, 2015)
Chapter 2. Comparison of Korea’s and China’s Petroleum Industries
1. Structure of Oil Market
A. Supply and Demand of Petroleum
Similarities and differences can be observed in comparing the supply and demand of petroleum products in South Korea and China. In terms of similarities, the two countries are high oil-consuming nations and have domestic crude oil refinery facilities with abundant economic power. As of the late 2015, the output of Korea’s and China’s crude oil refineries was approximately 3.11 million b/d and 14.26 million b/d, respectively. Since 2015, the consumption of petroleum products in both countries has hovered at around 20%.3 However, for the supply of crude oil—the major ingredient of petroleum products—both Korea and China rely heavily on oil markets overseas because of their lack of domestic oil resources. South Korea is fully reliant on foreign markets, while China’s dependence on crude oil imports has recently expanded to 60%.
In terms of differences, the two countries’ oil consumption stands in stark contrast due to differences in industrial structures, policies, economic levels, and economic growth rate. Except for last year’s sharp decline in oil prices in Korea, oil consumption has come to a standstill, with less than 1% of increase rate in oil consumption since 2010 in Korea, whereas China has shown a constant upward trend of more than 4% since 2010. China operates a domestic oil industry that has helped increase exports of petroleum products. Because of Korea’s stagnate oil industry, the construction of refinery facilities occurs at a slow pace. Conversely, the number of China’s refineries is increasing rapidly.
As shown in Table 2-1, the export volume of petroleum products in Korea has continued to increase, accounting for more than 40% of production in 2010 and expanding to 46% in 2014. Table 2-2 shows that since the 2000s, China has increased its share of exports in petroleum products. During the 2010s, it has shown an average annual growth rate of 2%, with the proportion of exports out of total production standing at 6%.
Even though China’s oil consumption has increased rapidly, the fact that it has been able to export more petroleum products is because its refining capacity has increased much faster than its oil consumption.
Figure 2-1. Crude Oil Supplies in Korea and China
(Unit: 1 mil. b/d)
Source: Petronet (www.petronet.co.kr), IHS China Energy Crude Oil Market Report (March 2016), IEA Monthly Oil Data Service (April 2016)
3 BP, Statistical Review of World Energy (June 2016)
원문 번역문 한국
중국
Korea China
수입 생산
Imports Production
Figure 2-2. Crude Oil Refining Capacity in Korea and China
Source: BP, Statistical Review of World Energy (June 2016)
원문 번역문
천b/d 1,000 b/d 한국
중국
Korea China
Table 2-1. Korea’s Petroleum Products Supply-Demand Balance
(Unit 1,000 b/d)
2005 2010 2011 2012 2013 2014
Average annual growth rate (By 2014) Production 2,373.7 2,396.2 2,513.1 2,589.2 2,517.4 2,575.0 1.8%
Imports 615.4 826.4 831.5 900.3 929.3 903.0 2.2%
Consumption 2,196.8 2,252.6 2,237.2 2,287.2 2,301.0 2,290.3 0.4%
Exports 792.5 970.0 1,107.2 1,202.3 1,145.6 1,187.7 5.2%
Exports/Production 33.4% 40.5% 44.1% 46.4% 45.5% 46.1% - Source: Facts Global Energy, Asia Pacific Data Book 3: Oil Product Balances Fall 2015
(December 2015)
Table 2-2. China’s Petroleum Products Supply-Demand Balance
(Unit: 1,000 b/d)
2005 2010 2011 2012 2013 2014
Average annual growth rate (By 2014) Production 5,881 8,369 8,821 9,116 9,572 10,077 4.8%
Imports 915 942 1,015 1,018 1,042 949 0.2%
Consumption 6,432 8,729 9,207 9,510 9,992 10,239 4.1%
Exports 370 547 535 491 574 593 2.0%
Exports/Production 6.3% 6.5% 6.1% 5.4% 6.0% 5.9% -
Source: Facts Global Energy, Asia Pacific Data Book 3: Oil Product Balances Fall 2015 (December 2015)
As the proportion of petroleum product exports from Korea and China continues to increase, the effects of the Korea-China FTA on Korea’s petroleum industry remains unclear. To clarify what effects it will have, it is necessary to examine oil companies, market systems, and the status of oil trade in more detail.
B. Petroleum Corporations
Petroleum corporations are largely categorized into oil developers and crude oil producers. Korea’s petroleum corporations are focused mostly on downstream activities, comprising four private crude oil firms. Chinese petroleum companies are made up of three public petroleum corporations, which retain both upstream and downstream interests, and some local petroleum corporations are seeking to expand their presence.
In Korea, petroleum corporations comprise SK Innovation, GS Caltex, S-Oil, and Hyundai Oil Bank. Among them, SK Innovation focuses partially on oil development, but most of its sales come from the refining sector. In other words, Korea’s petroleum corporations are all oil refining companies.4
Table 2-3 indicates the refining capacity of Korea’s petroleum corporations, and the oil refining capacity of each is directly linked with company size and market share.
Table 2-3. Refining Capacity of Korea’s Petroleum Corporations (Unit: 1,000 b/d) SK
Innovation GS Caltex S-Oil
Hyundai Oil Bank
Total
2010 1,115 760 580 390 2,845
2011 1,115 775 654 390 2,934
2012 1,115 775 669 390 2,949
2013 1,115 775 669 390 2,949
2014 1,165 785 669 390 3,009
2015 1,215 785 669 390 3,059
Source: Oil Chronicle 2015, Korea Petroleum Association (December 2015)
In China, state-owned petroleum corporations, such as China National Petroleum Corporation (CNPC), China Petroleum and Chemical Corporation (Sinopec), and China National Offshore Oil Corporation (CNOOC), which were established in the 1980s, are the oil market leaders. Initially, CNPC was built for inland oil development, Sinopec for refining, distribution, and petrochemicals, and CNOOC for marine oil development.
However, from the late 1990s, CNPC and Sinopec acquired refinery facilities and oil field assets, respectively, and the two organizations were combined to form a vertically-integrated upstream-downstream entity. CNOOC, with the acquisition of some refinery facilities, transformed into another vertically-integrated corporation.5
4 Oil development accounts for only 2% of SK Innovation’s total sales. The rest is generated from oil refining and petrochemicals (73% from the oil refining sector) (Business Report; May 16, 2016).
5 EIA, Country Report – China (May 14, 2015), pp. 4-5.
Table 2-4. Crude Oil Production by Companies in China
(Unit: 1,000 b/d)
2005 2010 2011
CNPC
2,293 (61%)
2,376 (57%)
2,438 (57%)
Sinopec
764 (20%)
828 (20%)
831 (20%)
CNOOC
388 (10%)
663 (16%)
659 (16%)
Others
341 (9%)
330 (8%)
319 (8%) Note: ( ) is the proportion.
Source: Global Data, China Oil Markets (August 2012)
The major sectors of China’s petroleum industry—oil exploration and development—are dominated by state- owned petroleum corporations. Three of them are responsible for over 90% of crude oil production. Until recently, CNPC produced most crude oil, close to 60%, Sinopec comes second at 20%, and CNOOC leapt forward from 10% in 2005 to 16% in 2011.
The major three state-owned petroleum corporations operate downstream oil refinery industries, while a large number of small-scale local refinery companies focus specifically on sales activities. The Chinese government has granted exclusive rights to public petroleum companies to operate crude oil imports and processing, leaving small-sized private oil companies room for improvement. However, due to a series of excessive investments in industries and prolonged economic recession, the Chinese government initiated extensive restructuring of the industrial sector, with the oil refinery industry at the heart of the changes. For example, to raise efficiency in the oil refinery industry antiquated refinery facilities were shut down, and in July 2015, as a means to spur competition, permission was given to some private refineries for crude oil imports and processing. As the government is set to expand the scope of permissions further, investments in local oil refinery companies are expected to accelerate in the foreseeable future.
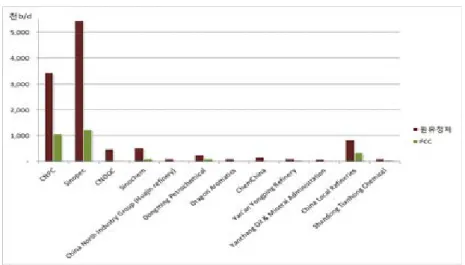
Figure 2-3 indicates the size of refinery facilities owned by petroleum corporations in China as of early 2015.
Of the state-owned petroleum corporations, the%age of crude oil refinery facilities operated by Sinopec have the largest at 47%, followed by CNPC (30%), CNOOC (4%), Sinochem (4%), and ChemChina (1%). The%age of small-and medium-sized companies stands at a total of 13%.
Figure 2-3. Current Status of Refining Facilities by Chinese Companies
Source: IHS Energy, Refining and Product Markets Asia Pacific (April 2015)
원문 번역문
천b/d 1,000 b/d
원유정제 Crude Oil Refining
Table 2-5. Current Status of Refinery Facilities by Chinese Companies
Corporations Atmospheric
Distillation FCC
CNPC 3,434,452 1,055,125
Sinopec 5,451,860 1,226,068
CNOOC 472,150 24,000
Sinochem 513,000 99,000
China North Industry Group (Huajin Refinery) 95,000 0
Dongming Petrochemical 228,000 85,000
Dragon Aromatics 85,500 0
ChemChina 152,950 0
Yan'an Yongping Refinery 85,500 32,000
Yanchang Oil & Mineral Administration 77,615 0
China Local Refineries 840,000 325,000
Shandong Tianhong Chemical 95,000 40,000
Total 11,531,027 2,886,193
Source: IHS Energy, Refining and Product Markets Asia Pacific (April 2015)
C. Price Framework
A huge difference exists between Korea and China in determining the prices of petroleum products consumed at the final stage. In Korea, after the liberalization of oil prices in 1997, petroleum corporations began setting domestic prices of petroleum products in consideration of international prices. However, the Korean government imposes oil taxes on gasoline, diesel, kerosene, heavy oil, and LPG, and these eventually determine the prices offered to gas stations. Therefore, the government serves as a contributor toward pricing through oil taxes to some extent, but as the amount of tax and tax rates are fixed, oil refinery companies play an absolute role in determining supply prices. Korea’s pricing system is somewhat problematic,6 but prices are nonetheless decided according to market mechanisms.
In China, albeit a series of price system reforms, the prices of petroleum products are still determined by the Chinese government.7 With the aim of stable economic growth, the government had wanted to reduce the exposure of its economy to the variabilities of the outside world. However, due to sudden increases in oil consumption, increases in smuggling taking advantage of international price differences, and severe losses of oil refinery companies, the Chinese government did all it could to link domestic oil prices with international prices.
In 1998, it modified the prices of gasoline and diesel every month in line with Singapore’s average prices of the previous month. Nevertheless, the gap between international and domestic prices still attracted speculative transactions, leading to the government’s reform of the price framework again in 2008. Based on the weighted average prices of New York, Rotterdam, and Singapore, when over an 8% change is indicated, the government intervened to adjust the gasoline and diesel prices within China at random times. In 2009, the adjustment of oil prices became flexible. The prices of gasoline and diesel within China were adjusted if the moving average prices in Brent, Dubai, and Indonesian Cinta changed more than 4% over 22 business days. However, from late 2010, the Arab Spring—a series of anti-government protests and uprisings that swept the Middle East and North Africa—drove international prices upward. As prices of petroleum products in China fell short of the growing international prices, another round of price adjustments took place in 2013. The moving-average change period was reduced drastically from 22 to 10 business days. Also, the fluctuation rate of the crude oil price was readjusted from 4% to 50 yuan/Mt (approx. USD 1/barrel). In January 2016, China announced a new price framework stipulating that if international prices do not go over 40 dollars per barrel, the prices of petroleum products may not align with international prices. As oil prices now continue to stay low, China is making strenuous efforts to protect its oil refinery industry, which remains inferior in terms of production costs.8
China’s price framework for petroleum products, compared with the past, tends to reflect international prices well, but given that prices are decided by the Chinese government, the benefits of signing an FTA remain
6 Since the latter half of 2014, due to an abrupt drop in international oil prices, the prices of gasoline and diesel supplied by oil refinery companies greatly declined. However, the lower gas prices failed to meet the standard, resulting in consumers complaining about oil taxes. According to Opinet (www.opinet.co.kr as of June 10, 2016), the proportion of taxes on gasoline in terms of final consumer prices was an average of 53% and 62% in 2014 and 2015, respectively. Diesel prices increased from 44% to 54%.
7 China’s transportation diesel prices are determined by the National Development and Reform Commission (NDRC), which is under the control of the Council of State, a state-led administrative institution.
8 China Oil, Gas & Petrochemicals (January 15, 2016), p.4.
uncertain for Korea’s oil industry. Therefore, in order to analyze the effects of Korea-China FTA and seek countermeasures, the price framework of China needs to be examined.
Table 2-6. Changes in Price Framework of Chinese Petroleum Products
Year Descriptions
1998 ∙ Petroleum product prices based on the previous month’s market prices in Singapore.
2001
∙ If the international petroleum product prices based on the market prices of the U.S., Europe and Singapore fluctuated more than 8%, the prices of domestic petroleum products were adjusted on a non-regular basis.
2009 ∙ If prices in Brent, Dubai, and Cinta fluctuated more than 4% every 22 business days, the prices of gasoline and transportation diesel were adjusted to match the crude oil price.
2013 ∙ If the price of standard crude oil (not disclosed) fluctuated more than 50 yuan/Mt, the prices of gasoline and transportation diesel were adjusted every 10 business days.
2016 ∙ If the international oil price stayed below 40$/bbl, the prices of petroleum products, such as gasoline and transportation diesel, were not adjusted to match the international price.
Source: IEA, Oil Market Report 2008. 12 - 2009. 1, Chen (2008a, 2008b), EIA, International Energy Data and Analysis: China, May 2015, China Oil, Gas & Petrochemicals (January 15, 2016) Reformatted by referring to the article written by Saesin Oh & Jaekyung Kim (2015)
2. Trade Structure of Petroleum Products
Petroleum products have made up the majority of Korea’s total exports since 2012. According to KITA,9 9 to 10% of petroleum products were exported between 2011 and 2013. Due to low oil prices, the amount went down to 6%, but this was still considered fairly high. Since 2010, petroleum products exports have stood at an average of 5 to 6%, but last year they only accounted for 4% amid declining oil prices. The total trade balance of petroleum products since 2010 has risen from USD 10 billion to 20 billion, serving as a key contributor to the advancement of the Korean economy.
Table 2-7. Exports of Korean Petroleum Products
(Unit: 1 mil. $)
2010 2011 2012 2013 2014 2015
Gasoline 3,441 6,304 7,650 7,546 7,767 5,192
Diesel 11,839 20,158 22,682 20,585 19,953 11,427
9 Reference: Trade Statistics (http://stat.kita.net as of May 20, 2016), KITA
Kerosene 614 1,131 993 896 461 271 Jet Fuel 6,446 10,514 11,547 10,905 10,575 6,967
Heavy Oil 1,909 3,574 3,309 2,144 1,040 360
Naphtha 2,513 3,646 3,412 4,066 3,332 2,591
LPG 168 194 287 224 242 190
Lube Base Oil 2,478 3,753 3,604 3,251 4,112 2,649
Asphalt 1,388 1,233 1,397 1,796 1,948 1,344
Petroleum
Products 30,796 50,508 54,881 51,414 49,429 30,991 Exports
(%age) 6.6% 9.1% 10.0% 9.2% 8.6% 5.9%
Source: Trade Statistics (http://stat.kita.net as of May 20, 2016), KITA
Table 2-8. Imports of Korean Petroleum Products
(Unit: 1 mil. $)
2010 2011 2012 2013 2014 2015
Gasoline 4 3 13 231 2 17
Diesel 85 153 680 1,150 638 40
Kerosene 31 56 29 13 5 1
Jet Fuel 0 25 1 32 0 0
Heavy Oil 1,548 1,874 3,351 4,859 5,944 2,532
LPG 4,313 5,657 5,576 5,089 4,850 2,638
Lube Base Oil 436 723 770 535 877 501
Asphalt 0 0 0 0 0 2
Naphtha 14,012 18,050 20,058 21,168 21,514 11,662
Petroleum
Products 20,430 26,540 30,480 33,076 33,831 17,393
Exports
(%age) 4.8% 5.1% 5.9% 6.4% 6.4% 4.0%
Source: Trade Statistics (http://stat.kita.net as of May 20, 2016), KITA
Figure 2-4 shows the trade balance by Korea’s petroleum products, with strong exports in gasoline, diesel, jet fuel, lube base oil, and asphalt products—the top three being diesel, jet fuel, and gasoline. Since 2012, heavy oil has turned from black to red, while naphtha and LPG have remained in the red because more of these are imported than exported. Naphtha has stayed in the red because it is an important ingredient in Korea’s petrochemical industry, a large contributor to Korea’s economy.
Kerosene, one of the items in the black, continues to show a decline in both exports and imports, while heavy oil constantly shows a rise in imports as exports of it drop.
Figure 2-4. Trade Balance by Korean Petroleum Products
Source: Trade Statistics (http://stat.kita.net as of May 20, 2016), KITA
원문 번역문
백만$ 1 mil.$
휘발유 등유 경유 항공유
Gasoline Kerosene Diesel Jet Fuel Heavy Oil
중유 납사 윤활기유 아스팔트
Naphtha Lube Base Oil Asphalt
In China, the trade size of petroleum products is smaller than that of Korea, but considering its economic growth and the growth of refinery facilities, it is anticipated to outpace Korea in the future. Currently, China’s imports of petroleum products are higher than its exports, but the deficit gap is expected to narrow.
As shown in Table 2-9, starting from 2010, the percentage of petroleum products exports out of China’s total exports stayed at a mere 1% for 6 years. One reason why was that the high demand in mainland China, but the main reason was that Chinese petroleum products had a bad reputation for quality and competitiveness.10 Gasoline, diesel, jet fuel, and heavy oil make up the majority of Chinese petroleum products imports.
As shown in Table 2-10, during the same period, petroleum products imports accounted for approximately 2%
of all imports. The proportion of imports involving LPG and naphtha was high, showing an upward trend.
Heavy oil and jet fuel imports made up a majority, but have declined. Notably, lube base oil and asphalt made up a large proportion of imports. Considering the trade between Korea and China, they will play a pivotal role in the future.
Table 2-9. Exports of Chinese Petroleum Products
(Unit: 1 mil. $)
2010 2011 2012 2013 2014 2015
Gasoline 3,770 3,794 3,035 4,651 4,947 3,515
Diesel 3,272 1,879 1,873 2,733 3,897 3,853
Kerosene 25 30 0 0 30 13
Jet Fuel 4,495 6,504 7,849 9,218 10,280 7,623
Heavy Oil 3,944 6,575 7,041 6,753 5,678 3,666
Naphtha 0 0 208 353 127 0
LPG 657 1,008 1,228 1,209 1,302 761
Lube Base
Oil 86 208 135 53 36 33
10 Regarding the quality and competitiveness of Chinese petroleum products, refer to p.39~47 of this report.
Asphalt 84 164 88 135 157 148 Petroleum
Products 16,334 20,162 21,459 25,107 26,454 19,613 Exports
(%age) 1.0% 1.1% 1.0% 1.1% 1.1% 0.9%
Source: Trade Statistics (http://stat.kita.net as of May 20, 2016), KITA
Table 2-10. Imports of Chinese Petroleum Products
(Unit: 1 mil. $)
2010 2011 2012 2013 2014 2015
Gasoline 0 31 5 2 34 95
Diesel 1,242 2,274 912 252 395 226
Kerosene 1,355 862 1,050 1,480 288 26
Jet Fuel 3,506 5,383 5,392 5,267 3,701 1,933
Heavy Oil 9,441 15,085 17,148 14,342 10,723 4,970
Naphtha 0 0 2,995 3,351 3,300 3,568
LPG 2,257 2,907 3,011 3,787 5,881 6,082
Lube Base Oil 2,108 2,966 2,489 2,675 3,064 2,000
Asphalt 2,023 1,767 1,750 2,067 2,334 1,802
Petroleum
Products 21,931 31,274 34,752 33,221 29,720 20,703 Exports
(%age) 1.6% 1.8% 1.9% 1.7% 1.5% 1.3%
Source: Trade Statistics (http://stat.kita.net as of May 20, 2016), KITA
Figure 2-5. Trade Balance by Chinese Petroleum Products
Source: Trade Statistics (http://stat.kita.net as of May 20, 2016), KITA
Figure 2-5 shows the trade balance by Chinese petroleum products, with jet fuel, gasoline, and diesel in the black and all other petroleum products imports showing a sizeable deficit. As of 2015, LPG and naphtha recorded the highest deficits at USD 5.3 billion and 3.6 billion, respectively. Also, lube base oil, heavy oil, and asphalt recorded deficits between USD 1 billion and 2 billion.
Next, we will look at the trade status of petroleum products between Korea and China. In the 2010s, a series of changes in petroleum products trade occurred between Korea and China. Korea’s exports of petroleum products to China gradually increased, reaching 40% in 2011. Since then, exports have declined, reaching 23%
in 2015. The major petroleum products are in order of jet fuel, asphalt, heavy oil, naphtha, diesel, and lube base oil, with a value of between USD 400 million and 2 billion. However, in 2015, due to a sharp decline in oil prices, all exports fell, resulting in a change of major exported items in the order of asphalt, naphtha, jet fuel, lube base oil, diesel, and heavy oil.
Figure 2-6. Korea’s Petroleum Products Exports to China
Source: Trade Statistics (http://stat.kita.net as of May 20, 2016), KITA
Table 2-11. Percentages of Korea’s Petroleum Products Exports to China (Sum)
2010 2011 2012 2013 2014 2015
Gasoline 0.0% 0.4% 0.1% 0.1% 0.7% 0.0%
Diesel 7.5% 14.7% 11.2% 4.2% 4.1% 6.6%
Kerosene 1.5% 0.7% 0.4% 0.0% 0.0% 0.0%
Jet Fuel 31.3% 37.5% 39.4% 42.3% 34.1% 17.9%
Heavy Oil 18.2% 19.5% 19.6% 13.3% 10.0% 5.4%
Naphtha 14.5% 11.6% 12.1% 16.0% 14.5% 26.1%
LPG 0.8% 0.4% 1.4% 0.8% 1.2% 1.0%
Lube Base
Oil 6.9% 5.8% 5.2% 6.9% 13.2% 16.1%
Asphalt 19.2% 9.4% 10.5% 16.3% 22.2% 26.9%
Petroleum
Products* 31.8% 39.7% 31.3% 23.7% 19.2% 22.7%
Reference: * refers to the proportion of Korea’s exports to China out of total global exports.
Source: Trade Statistics (http://stat.kita.net as of May 20, 2016), KITA
The proportion of Korea’s petroleum products exports to China out of total petroleum products produced was 1.9% in 2010, but it declined steadily to 0.4% in 2015. Naphtha, heavy oil, and LPG were predominantly imported in 2010 and only heavy oil was imported in 2015.
Meanwhile, the proportion of China’s exports of petroleum products to Korea was a low 2% in 2010 and 0.3%
in 2015. In contrast, the proportion of China’s total exports to Korea declined gradually from 30% in 2010 to 19%
in 2015.
Figure 2-7. Korea’s Imports of Chinese Petroleum Products
Source: Trade Statistics (http://stat.kita.net as of May 20, 2016), KITA
Table 2-12. Percentages of Korea’s Petroleum Products Exports to China by Items (Sum) Petroleum
Products 2010 2011 2012 2013 2014 2015
Gasoline 0.0% 0.0% 0.0% 0.0% 0.0% 0.0%
Diesel 0.4% 0.3% 0.9% 8.2% 6.0% 3.4%
Kerosene 0.9% 0.0% 3.2% 0.9% 0.0% 0.0%
Jet Fuel 0.0% 0.0% 0.3% 0.0% 0.0% 0.0%
Heavy Oil 30.8% 36.0% 30.4% 35.7% 50.4% 96.6%
Naphtha 61.5% 51.1% 30.9% 40.4% 32.8% 0.0%
LPG 6.3% 9.7% 34.3% 14.8% 10.8% 0.0%
Lube Base Oil 0.0% 2.9% 0.0% 0.0% 0.0% 0.1%
Asphalt 0.0% 0.0% 0.0% 0.0% 0.0% 0.0%
Petroleum
Products* 1.9% 1.8% 1.0% 1.7% 1.0% 0.4%
Reference:* refers to the proportion of Korea’s exports to China out of total global exports.
Source: Trade Statistics (http://stat.kita.net as of May 20, 2016), KITA
As Korea’s exports of petroleum products to China continue to show an absolute advantage, the trade balance continues to stay in the black. It expanded from USD 6.1 billion in 2010 to 10 billion in 2011, but declined afterwards, hitting USD 3.9 billion in line with decreasing oil prices in 2015.
Nonetheless, the proportion of trade balance surplus generated in China in 2015 was 20%, indicating the significance of China in Korea’s oil industry. It is clear that Korea plays a pivotal role in China’s petroleum products imports.
However, while the percentages of jet fuel and heavy oil were very high among the main petroleum products exported from Korea in 2010, their shares dropped until 2015. Until quite recently, a high percentage of lube base oil and asphalt has been exported to China.
Figure 2-8. Trade Balance Surplus of Korea’s Petroleum Products Exports to China
Source: Trade Statistics (http://stat.kita.net as of May 20, 2016), KITA
Chapter 3. Korea-China FTA and Korea’s Oil Industry
1. Major Agreed Descriptions for Korea’s Oil Industry A. Agreed Descriptions for Petroleum Products
The Korea-China FTA was finally signed in November 2014 and took effect in December 2015. For the agreed descriptions for petroleum products of the two countries, see Table 3-1. Except for gasoline and diesel being designated as sensitive track items, whereby their tariffs are gradually lowered over a period of 15 years, other petroleum products were designated differently in each country depending on the nature of their respective net exports and imports. The agreed descriptions are as follows:
Gasoline and diesel, both of which are exported in large quantities from Korea and China, were agreed upon as sensitive track items 襯. Jet fuel is exported by both Korea and China, but is a surplus track only in Korea and is designated as a sensitive track item 襯. However, jet fuel is designated as a general track item, which is subject to immediate elimination 䃰. Heavy oil (bunker C fuel oil), which recently changed from black to red in the trade balance in Korea, has continued to stay red in China. It was designated as a general track item in both countries, but it was agreed as 襪 in Korea and 䃵 in China, implying that the speed of tariff reductions in China is much faster than in Korea.
LPG is categorized as either propane or butane, both of which are designated as 襯, as sensitive track items in Korea. However, in China, LPG is categorized as a general track item, with propane designated as 䃵’ and butane designated as 襪. Thus, China seems to have eliminated tariffs in a relatively short period of time.
Naphtha—the largest imported petroleum product in Korea—is designated as a general track item and is subject to immediate elimination 䃵, . China set the agreed description as 襯, designating the product as a sensitive track item even if it is a net import product.
Asphalt and lube base oil—Korean net export products, which have recorded a significant surplus through Chinese trade, are categorized as general track items. Thus, they will be subject to a gradual decline in tariffs over five years. However, China categorized these as sensitive track items, requiring a wait of 15 years for tariff elimination.
In Korea, petrochemical products (e.g. propylene, benzene, toluene, paraxylene, methyloxurane, TPA11, and polypropylene), except for methyloxurane, were categorized as general track items, ensuring tariff elimination effective immediately. However, paraxylene, TPA, and polypropylene were designated as highly sensitive track items in China, while the rest were designated as sensitive track items. This led to a delay in the duration for tariff reduction of up to 15 years.
Meanwhile, the agreed descriptions for transportation diesel, containing bio-diesel, are different from those of general diesel. In Korea, the tariffs on diesel mixed with bio-diesel were transferred from the existing 5% to immediate elimination. In contrast, China decided to gradually lower the tariffs from the current 6% for a period of 15 years. Also, for bio-diesel, Korea agreed with a 6.5% tariff rate along with an agreed description of 䃵, , which is relatively short. Unlike Korea, China agreed with a 6.5% tariff rate and a description of 襯, with the aim of delaying its full market opening.
11 Terephthalic Acid
Table 3-1. Korea-China FTA Agreed Descriptions for Major Petroleum and Chemical Products
Petroleum Products
Korea China
Categories Agreed Descriptions
Tariff Rates (%)
Categories Agreed Descriptions
Tariff Rates (%)
Gasoline ST 15 3 ST 15 5
Diesel ST 15 3 ST 15 6
Kerosene ST 15 5 ST 15 9
Jet Fuel ST 15 3 NT 0 9
Heavy Oil NT 5~10 3 NT 5 6
Naphtha NT 0 0 ST 15 6
Lube Base Oil NT 0 7 ST 15 6
BD included* NT 0 - ST 15 6
Asphalt NT 5 5 ST 15 8
Propane ST 15 3 NT 5 5
Butane ST 15 3 NT 10 5
Propylene NT 0 0 ST 15 5
Benzene NT 0 3 ST 15 2
Toluene NT 0 3 ST 15 2
Paraxylene NT 0 3 HST Excluded 2
Methyloxurane HST Excluded 5.5 ST 15 5.5
TPA NT 0 3 HST Excluded 6.5
Polypropylene NT 0 6.5 HST Excluded 6.5
Note:* refers to bio-diesel (BD) that includes gasoline, diesel, kerosene, jet fuel, heavy oil, naphtha, and lube base oil. In terms of Korean tariffs, the following rate is applied: naphtha (0%), lube base oil (7%), and the rest (5%).
Source: Korea-China FTA Bill (Chapter 2), Ministry of Trade, Industry and Energy
However, the following two concerns exist with respect to Korea’s oil exports to China. First, given that the export competitiveness of Korea’s petroleum products is higher than China’s, the Chinese market should have been opened quickly, but it was not. Even though China’s oil refinery industry lacks global competitiveness, the Chinese government failed to do more to improve product quality and cost efficiency.12 Under these circumstances, an early opening of Chinese market could lead to the expansion of Korean exports of items that require high product quality, such as gasoline, transportation diesel, lube base oil, and petrochemicals. To increase the exports of petroleum products to China, which is largely dependent upon exports due to insufficient domestic production, it would be prudent to urge an early opening of the Chinese oil market. Lube base oil and asphalt are good export examples. They constitute a large portion in Korea’s petroleum products exports to China. In the case of lube base oil, China imports from Korea as well as from Singapore, Taiwan, and Indonesia, but Korea accounts for more than 30% of the imports.
The base tariff rate, which is applied to the Korea-China FTA, is the Most Favored Nation (MFN) rate. As it is expected to be higher than the potential tariff rate—China’s current applied tariff rate—and the conventional tariff rate of Asia-Pacific Trade Agreement (APTA13), which took effect in September 2006, any effect resulting from tariff reduction may be minimal. As of 2015, asphalt exports from Korea to China are not expected to be substantially impacted by a tariff reduction until 2019. Therefore, the effects from the signing of FTA for Korean oil refining companies are not expected to be significant.
Table 3-2. China’s Current Applied Rate and Korea-China FTA Conventional Rate
Gasoline Diesel Jet Fuel
Heavy
Oil Naphtha
Lube Base Oil
Asphalt
Tariff Rate (%)
Base Rate 5 6 0 6 6 6 8
2015 (first year)
4.67 5.60 0 5.60 5.60 5.60 7.47
2016 (second
year)
4.33 5.20 0 5.20 5.20 5.20 6.93
2017 (third year)
4.00 4.80 0 4.80 4.80 4.80 6.40
2018 (fourth
year)
3.67 4.40 0 4.40 4.40 4.40 5.87
2019 3.33 4.00 0 4.00 4.00 4.00 5.33
12 Refer to p. 39~47 of this report.
13 The Asia-Pacific Trade Agreement is a trade agreement signed among developing countries in the Asia-Pacific. It was signed in November 2005 and took effect in September 2006 with the participation of Korea, China, India, Bangladesh, Laos, and Sri Lanka.
(fifth year) Applied
Rate 1 0 0 1 0 6 5.6
Note:*refers to provisional tax rate or preferential tariff in accordance with the APTA, a tariff rate which is applied when China imports products from Korea.
Source: FTA Portal System, Korea Customs Service (yesfta.customs.go.kr) and Tradenavi (www.tradenavi.or.kr)
Second, the agreed descriptions for petroleum products are somewhat disadvantageous to Korea’s oil refinery industry. The petroleum products whose agreed descriptions differ are primarily jet fuel, naphtha, lube base oil, asphalt, LPG, and bio-diesel. In Korea, jet fuel and LPG are sensitive track items, while in China they are general track items, which gives China a higher market opening. Other items do give Korea a higher market opening, which are mostly produced by Korean refineries, and these items outpace China in terms of competitiveness while not negatively impacting Korean refineries in the short term. However, the growth potential of China’s oil refinery industry and difference in crude oil tariffs between the two countries mean that the agreed descriptions possibly put Korea at a disadvantage.
Further issues arise as a result of the difference in crude oil tariffs between Korea and China. The rule for Korea’s crude oil import taxes is that around 3% may be imposed when crude oil is processed into petroleum products for domestic use, while 0% per year is imposed when it is processed into products for export. The exception is the import of Chinese crude oil, which remains tax-free. If the petroleum products market is opened entirely with the signing of the Korea-China FTA, and both countries compete in the Korean market, Korean company products will be handicapped by 3% crude oil tariffs. Also, if the Chinese government assists the Chinese oil refinery industry’s rapid growth, the levels of oil industry competitiveness between the two countries may be reversed.
B. Definition of the Country of Origin
In addition to the agreed descriptions associated with each petroleum product, the factors that directly influence the oil trade between Korea and China are the country of origin and non-tariff barriers. The country of origin in the Korea-China FTA can be defined as follows: 1) when products are entirely acquired and produced in the related country, 2) when products are entirely produced in the related country using originating materials, and 3) when products are produced entirely by the related country using non-originating materials and are in agreement with Annex 3A. Petroleum products belong to the third requirement. The Annex 3A rule stipulates the criteria to apply to products. According to the rule, a change in tariff heading (CTH14) and tariff sub-heading (CTSH15) are applied. In general, products that are produced directly through crude oil refining—such as gasoline, diesel, kerosene, jet fuel, heavy oil, and asphalt—differ within the HS code and CTH. No matter which rule is selected, the rules of origin can be applied, so there is no difficulty in exporting petroleum products to China.16
However, rules are different in the case of lube base oil, one of the main petroleum products exported from Korea to China. This is because lube base oil is primarily produced from lubricating grease that is extracted in the process of refining crude oil. Lubricating grease is either supplied through crude oil refining or partially imported from abroad.17 Therefore, to apply the FTA rules to lube base oil for export to China, a change in
14 Change of Tariff Heading
15 Change of Tariff Sub-heading
16 The HS code for crude oil is 2709. The HS code for fuel oil and asphalt, which are produced through crude oil refining, is placed between 2710 and 2713.
17 As of 2015, the import volume of lubricating grease only accounted for approximately 10% of the export volume of lube
tariff classification was needed. However, as the HS code for both lube base oil and lubricating grease is 271019, the current CTH and CTSH are not subject to a change in tariff classification or any benefits from tariff reductions. Considering that Korean refinery corporations are eager to increase the export volume of lube base oil, it is desirable to take measures to resolve this issue.
C. Differentiation from Existing China-led FTAs
The Korea-China FTA was highly anticipated by Korean petroleum corporations primarily because other Southeast Asian countries, Korea’s competitors, had signed FTAs with China, opening up the petroleum products market to a greater extent. However, the Korea-China FTA and a more open Chinese petroleum market has failed to meet expectations. Table 3-3 sets forth the tariff rates of China’s FTAs in relation to the petroleum and chemical products that Korea exports. It shows that the Chinese market openings relative to the Korea- China FTA are remarkably small compared with other Asian countries. Although most of the items do not show a noticeable difference in comparison with other Chinese FTAs, with the application of China’s provisional tariff rates a huge gap in tariff rates exists for lube base oil and asphalt. Korea has the highest market share in China for gasoline, diesel, and jet fuel but must compete fiercely against ASEAN countries such as Singapore and Taiwan. Given this situation, Korean petroleum corporations cannot help but be extremely disappointed with the outcome of the Korea-China FTA.
Table 3-3. China’s Tariff Rates for Petroleum Products Against Major Asian Countries (As of 2016)
Categories Types of FTA
Conventional Tax Rates (%)
Provisional Tariff Rates (%)
Gasoline
Korea-China FTA 4.3 China-ASEAN FTA 0.0 1.0 China-Singapore
FTA 0.0
Diesel Korea-China FTA 5.2 1.0
Jet Fuel
Korea-China FTA 0.0
0.0 China-ASEAN FTA 0.0
China-Singapore
FTA 0.0
China-Taiwan FTA 0.0
Heavy Oil
Korea-China FTA 3.6
1.0 China-ASEAN FTA 0.0
base oil.
Categories Types of FTA
Conventional Tax Rates (%)
Provisional Tariff Rates (%) China-Singapore
FTA 0.0
Lube Base Oil
Korea-China FTA 5.2
6.0 (MFN tax
rate) China-ASEAN FTA 0.0
China-Taiwan FTA 0.0
Asphalt
Korea-China FTA 6.9
8.0 (MFN tax
rate) China-ASEAN FTA 0.0
APTA 5.6
Benzene/
Toluene
Korea-China FTA 1.7 2.0
(MFN tax rate) China-ASEAN FTA 0.0
Paraxylene
Korea-China FTA Excluded
2.0 (MFN tax
rate) China-ASEAN FTA 0.0
China-Taiwan FTA 0.0 Source: UNI-PASS 3.0 (unipass.customs.go.kr)
2. Problems of Market Conditions
A. China’s Methods of Deciding Prices
The Korea-China FTA is significant in that it is a free trade agreement with a socialist country—arguably the world’s second largest market. However, an array of issues resulting from systematic asymmetry need to be resolved for Korea’s petroleum industry to move forward.
As described above, technically speaking, the petroleum market in China does not move according to regular market mechanisms. Although the Chinese government determines the prices of petroleum products in line with global market prices, its market mechanism is inflexible and prices are subject to change depending on changes in government policies. For example, if the Chinese government lowers the prices of transportation diesel below international levels as a means of protecting China’s oil refinery industry, it would be practically impossible for Korean petroleum companies to expand exports to China. In fact, as Figure 3-1 shows, between 2004 and 2008 and between 2011 and 2012, when international oil prices rose rapidly, the prices of transportation fuel in China were lower than the international prices.
As low oil prices have been maintained since the plunge in oil prices in 2014, the price system for petroleum products in China transitioned to guaranteeing the profits of oil refinery companies to some extent. However, if oil prices rebound, the Chinese government may adjust its pricing system to a minimum, and Korean petroleum corporations may then be reluctant to export petroleum products to China regardless of the FTA.
Therefore, for Korea’s high-quality petroleum exports, such as gasoline and transportation diesel, to enjoy the benefits of the Korea-China FTA to the fullest, trust in China’s oil market mechanism needs to be a precondition.
Figure 3-1. Comparisons of Chinese Gasoline/Transportation Diesel Prices and International Crude Oil Prices
Source: Reuters, http://graphics.thomsonreuters.com/12/CN_FLLG_CT0312.gif (Date of Access: June 17, 2016)
B. Characteristics of Petroleum Corporations
When it comes to comparisons between Korea’s and China’s oil industries, the differences between petroleum corporations should be taken into account. Companies producing and exporting petroleum products in Korea are all privately-owned. Given that their product quality and efficiency are considered superior to those of Chinese petroleum companies, they have advantageous export competitiveness. Indeed, until now, Korean petroleum companies have had the upper hand in the trade between Korea and China. But it could be difficult to retain such competitiveness over the long-term, considering the advantages Chinese petroleum corporations will likely retain. This possibility needs to be considered when judging the impact of the Korea-China FTA on the oil industry in Korea.
There are two major strengths identified in CNPC, Sinopec, and CNOOC—the three major producers of petroleum products in China. First, they are vertically-integrated companies that produce a significant amount of crude oil. As suggested by numerous studies on corporate structure,18 vertically-integrated firms that own the whole value chain—from the production of materials to production of end goods to sales—are very favorably placed for gaining market share of end goods.
Recently, as a means advancing China’s oil refinery industry through competition, the Chinese government expanded the rights of privately-owned refinery facilities to process and export crude oil. Until last year, the crude oil refining capacity of China’s three major petroleum corporations only accounted for 70%. The profitability of these corporations has been aggravated due to low oil prices coupled with a relatively inferior competitiveness in the refinery sector, putting the Chinese oil industry at a disadvantage. However, as shown in Table 3-4 and Figure 3-2, the fact that these petroleum corporations possess a significant crude oil production (upstream) assets indicates that the Chinese oil industry is vertically-integrated. If oil prices increase in the foreseeable future as expected, the existing vertically integration may pose a serious threat to Korean oil refinery companies in the Chinese and global market.
18 Spengler (1950) found that monopolies increase the production of end goods by eliminating the double marginalization through vertical integration. Stigler (1951) saw the motive for a corporation becoming vertical integration in an unstable competition market as a way of securing market dominance. Greenhut and Ohta (1979) stated that the vertical integration of petroleum corporations in the U.S. contributed to the increased production in duopoly.
Table 3-4. Current Status of Oil Production of Three Major Oil Companies in China (Unit: 10,000 tons)
Categories
From January to September 2015 Year-on-year growth rate (%)
CNPC Sinopec CNOOC CNPC Sinopec CNOOC
Crude oil
production 9,783 3,695 4,186 3.3 -2.4 20.4
Sales of petroleum
products 11,930 14,075 - 1.5 1.9 -
Production of
ethylene 360 827 - -2.5 5.3 -
Source: CNPC Economics and Technology Research Institute, 2015 國內外油氣行業發展報告 (January 2016)
Figure 3-2. Asset Structures of China’s Two Major Petroleum Corporations (As of 2015)
Source: CNPC Economics and Technology Research Institute, 2015 國內外油氣行業發展報告 (January 2016)
원문 번역문
탐사/생산 Exploration/Production 정유/화학 Oil refinery/Chemicals
판매 Sales
수송 Transportation
본부/기타 Headquarters/Others
Second, the production of petroleum products in China is mostly done by public oil corporations. As mentioned above, the Chinese government gave permissions to private companies to import and process crude oil starting from last year. However, as most of the refinery facilities are state-owned, China’s state-owned oil corporations will continue to dominate production for the time being. Together with the non-marketability of the price system within China, this may block Korean petroleum products from entering into the Chinese market.
Depending on the Chinese government’s oil market policies, state-owned oil corporations might become engaged in investment and sales activities. They would likely get direct or indirect support from the government.
Therefore, Chinese government policies could determine the effects of the Korea-China FTA on Korea’s petroleum industry.
Recently, under the One Belt, One Road19 initiative in conjunction with the 13th Five-Year Plan (FYP)20, the Chinese government begun demolishing inefficient and antiquated refinery facilities to nurture the oil refinery industry as an export industry. However, the expansion of new refinery facilities in China is projected to increase. Table 3-5 shows the construction and expansion of refinery facilities planned up until 2020. Many of the projects will be conducted by state-owned corporations. As a result, the development of oil refinery industry led by China’s state-owned oil companies may be another critical variable that will hinder Korea making inroads into the Chinese market.
Table 3-5. China’s Plans to Construct and Expand Refinery Facilities During the 13th Five-Year Plan
Year Corporations
Construction (10,000 tons/year)
Regions Status
2017
CNPC 500 Central
China
Reconstruction and extension
CNOOC 1,000 Southern
China
Reconstruction and extension
2018
CNIGC 400 Northeastern
China
Permitted to construct
Sinochem 300 Southern
China
Permitted to construct
CNPC 300 Northern
China
Permitted to construct
19 The One Belt, One Road initiative was mentioned for the first time when Chinese President Xi Jinping visited Kazakhstan in 2013. As a development program, it has two routes: Silk Road Economic Belt (overland), bridging between Central Asia and Europe, and 21st Century Maritime Silk Road (sea), connecting Southeast Asia, Europe, and Africa. Through the initiative, China aims to accelerate the exploration of energy, resources, and markets overseas while exporting products, facilities, and labor abroad (p. 4, No. 79, Trade Brief, Institute for International Trade, December 17, 2014).
20 2016~2020