It can establish the library of the metal-organic framework so that we can choose one of the right frameworks for the applications. Second, there are various post-synthetic engineering methods such as etching, ligand exchange and cation exchange so that we can tune the inner and outer porous structure or porous structure itself for the applications of the metal-organic frameworks. Third, by breaking down the frameworks through the thermal conversion, we can increase the synthetic scope of the materials such as carbon material, metal oxide and metal oxide@carbon composite by using the metal-organic framework as a self-template.
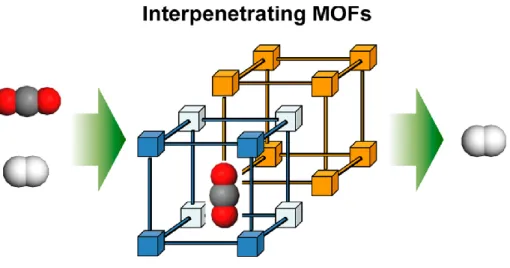
While the homogeneous interpretation has been known for the typical phenomenon of metal-organic structures; that is the interpenetration between identical scaffolds, the heterogeneous interpenetration has rarely been reported. By succeeding in the hetero-interpenetration between the representative MOFs, MOF-5 and HKUST-1, we wanted to demonstrate the potentials for the synthesis of the interpenetration. Overall, by demonstrating new tailoring methods for porous structure using these two kinds of engineers, we could elucidate the potential avenues of tunability towards the framework pore structures.
General introduction
TGA traces show virtually no presence of the solvents infiltrated into both ZIF-8 and ZIF-67. It is believed that this is attributed to the fragility of the ZIF-67's surface. Overall, XPS C1s, N1s, and O1s of the carbon materials show that a similar functional group exists on the surface.
We hope that this work opens the possibility of the heterogeneous interpenetration for the future.
Tailoring pore-structure through Wet Chemical etching
Experimental section
The specific surface area was determined in the relative pressure range of 0.05 to 0.3 of the Brunauer-Emmett-Teller (BET) plot, and the total pore volume was calculated from the amount adsorbed at a relative pressure of approximately 0.98- 0.99. The chemical etching procedures for ZIF-8 and ZIF-67 were changed from the previous study. For etching of ZIF-8, ZIF-8 (200 mg) as synthesized by sonication was dispersed in 20 mL of distilled water for 30 min.
For the etching of ZIF-67, the synthesized ZIF-67 (200 mg) was dispersed through sonication in 20 mL of distilled water for 30 min. In parallel, Xylenol Orange tetrasodium salt (395 mg) was dissolved in 24 mL of distilled water and this etchant solution was adjusted to pH 2.2 by adding 1,550 μL of 1 M HCl. ZIF-8 (200 mg) was placed in aluminum boat and the atmosphere was purged with N2 flow for 30 min before the thermal conversion procedure.
ZIF-67 (200 mg) was placed on an alumina boat and the atmosphere was purged with N 2 flow for 1 h before the conversion procedure. The adsorption of RhB by the synthesized carbon materials in an aqueous solution was studied according to reference 39-40. The carbon materials (10 mg) were sonically dispersed in 50 mL of an aqueous solution of RhB in a 100 mL laboratory flask.
The dynamic adsorption process was measured as follows: 1.0 ml of the dispersion was withdrawn at a given interval. The adsorption amount of RhB after nth sampling (qn) and the equilibrium adsorption capacity (qe) were calculated according to the following equations (1) and (2);
Results and discussion
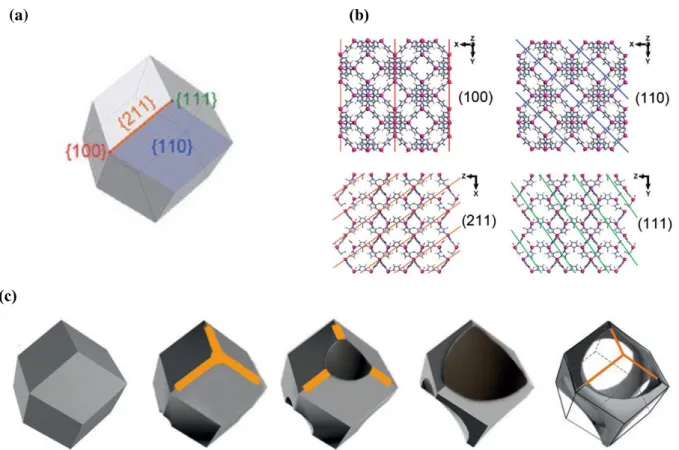
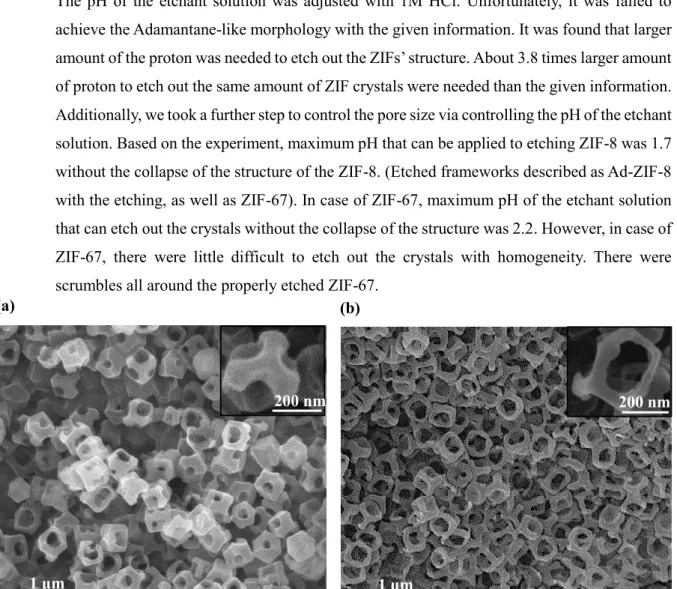
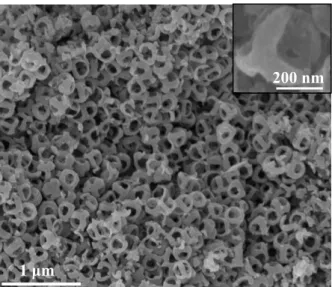
We described the morphology of the product as an adamantane-like morphology) We set the etching conditions with the given reference. It was found that a larger amount of proton was required to carve out the ZIF structure. In addition, we took a further step to control the pore size by controlling the pH of the etching solution.
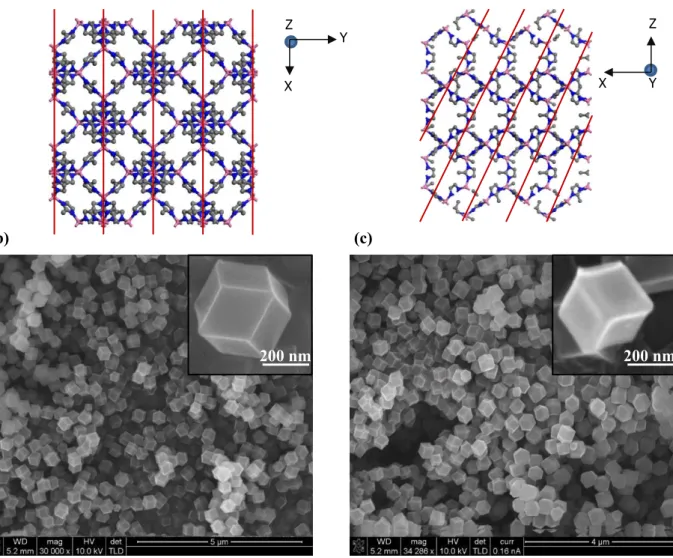
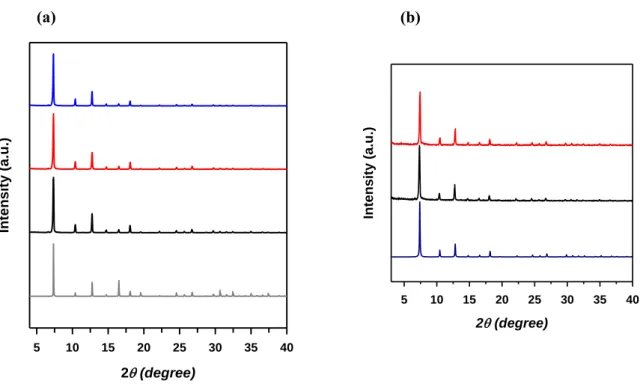
Based on the experiment, the maximum pH that can be used to etch ZIF-8 was 1.7 without the collapse of the ZIF-8 structure. Based on the comparison of PXRD patterns of adamantane-like ZIF-8, simulated ZIF-8 samples and synthesized ZIF-8 (Figure 2.7 (a)), it shows that there were no side reactions during the etching process that may affect the structure of ZIF-8.
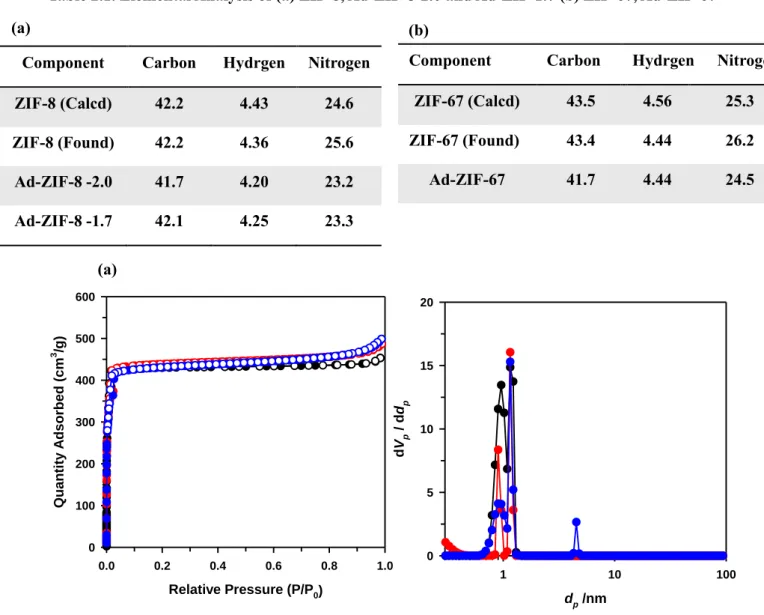
According to the elemental analysis (Table 2.3), the carbon materials synthesized with the adamantane-like ZIF-8 showed the decrease in the carbon composition while the nitrogen composition increased slightly, compared to the carbon materials derived from the original ZIF- 8 crystals. Using the 10 mg carbon material, we studied the adsorption of the Rhodmine B solution of 50 mg/L. We compared the R2 (regression correlation coefficients) as an indication of the accuracy of the equation on the kinetic parameters on Ad-NC-1.7 and Rh-NC.
Viewed from the R2, we can assume that the pseudo-second order equation is a more accurate equation for predicting the kinetics of the carbon materials. Derived from the pseudo-second-order equation, the adsorption rate constant of the Ad-NC-1.7 is about three times higher than that of Rh-NC. N is the linearity of the Freundlich fitting model, which implies how the adsorption process is beneficial.
It shows that the hierarchical meso- and macroporosity had a synergistic effect on the adsorption kinetics of the Rhodamine B adsorbent.
![Figure 2.3 PXRD patterns of ZIF-8 [Zn(2-MIM) 2 ] and ZIF-67 [Co(2-MIM) 2 ] (Simulatd pattern of ZIF- 8, dark gray ; Simultaed pattern of 67, dark blue; Synthesized 8, dark cyan; Synthesized ZIF-67, dark pink)](https://thumb-ap.123doks.com/thumbv2/123dokinfo/10522849.0/24.892.271.600.159.483/figure-patterns-simulatd-pattern-simultaed-pattern-synthesized-synthesized.webp)
Conclusion
To exclude the possibility of side reaction, we performed the solvothermal reaction with HKUST-1 and each of the metal and ligand precursors of MOF-5. However, considering the possibility of synthesis of undesired Cu-BDC or Zn-BTC, we decided to synthesize the system by sequential synthesis. Considering the vulnerability of MOF-5 in the chemical environment containing water8-10, we chose HKUST-1.
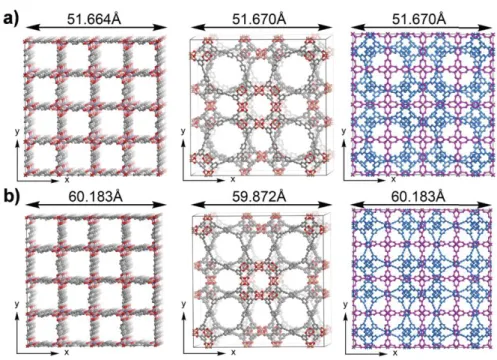
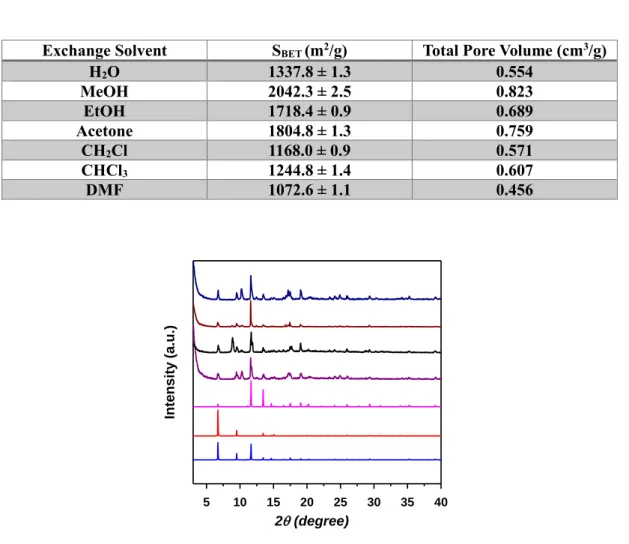
According to the types of solvent exchanged with the mother liquor of the as-synthesized HKUST-1 (Table 3.1), the BET surface area and total pore volumes differ. We set up the candidates of the solvent system with DMF, DMA and DEF itself and the mixture with the small amount of ethanol methanol and acetonitrile. As seen from the PXRD patterns above (Figure 3.3 and Figure 3.5), synthesized frameworks show the different phase with the simulated patterns of the interpenetrated patterns on DMF and DEF solvent systems.
However, SEM images of interlocking frameworks synthesized with reduced concentrations of zinc precursors and BDC still show a separate phase growing from the surface. To rule out the possibility of only BDC involvement, we take the IR spectrum of the samples (Figure 3.10). We assumed that interpenetration occurred from the outside of the frameworks, so that the solvent included in the framework evaporates more slowly than in HKUST-1 and MOF-5.
Also, N2 adsorption isotherms of the interpenetrated frameworks show the significantly reduced adsorption amount compared to HKUST-1 (Figure 3.13). Based on the computational algorithm that suggests the candidates for the heterogeneous intepenetraiton, we tried to synthesize the frameworks with the representative MOFs, MOF-5 and HUST-1.
Tailoring pore-structure through interpenetration
Experimental section
Both solutions were mixed and stirred for 10 min and the mixture was transferred to a Teflon stainless steel autoclave. The remaining solvent was replaced with methanol four times for 8 hours and then the crystal was activated at 80 ˚C for 8 hours. We set up a solvent system between DMF, DMA and DEF alone and a mixture with ethanol, methanol and acetonitrile.
When it comes to the synthesis in the single solvent system of DMF, DMA and DEF. Zn(NO3)2·6H2O was dissolved in 2.5 mL of solvent, and 15 mg of terephtalic acid was also dissolved in 2.5 mL of the same solvent, and then the solutions of each precursor were injected into the glass jar where HKUST -1 was decide When it comes to the mixing system, each metal and ligand solution was dissolved in 2 mL of DMF, DMA, and DEF and 1 mL of Ethanol, Methanol, and acetonitrile.
The synthesized crystals were washed several times with DMA and filtered under vacuum by rinsing with dichloromethane. The flask was placed in an oil bath and the temperature was heated to 100 oC for 1 hour.
Results and discussions
SEM images show that some of the crystals attached to the surface of the octahedral HKUST-1, but other crystals protrude from the surface and grow by themselves (Figure 3.7). These were assumed to be the phases we intended, and it was necessary to lower the concentrations of the zinc precursors and the ligand precursors so that the amount of crystals that themselves grow into separate phases can decrease or be removed. Since we assumed that HKUST-1 and MOF-5 were completely interpenetrated with each other, the molar ratio of BTC to BDC is 4 to 3, which means that the synthesized frameworks could be assumed to be 45% interpenetrated without considering the other forms of BDC . .
However, we had to rule out the possibility of side reactions during the solvothermal reaction, which could be cation exchange, ligand exchange, and just the incorporation of BDC into the pores of HKUST-1 without assembling MOF-5. Observed in the SEM images (Figure 3.11), HKUST-1 heated with zinc precursor alone shows no crystal formation on the surface, while HKUST-1 heated with BDC shows some exfoliation on the surface. However, this molar ratio continued to decrease when the crystals were repeatedly washed with DMA, so we can conclude that there was little opportunity for ligand exchange between BTC and BDC.
The TGA trace of the interlaced frameworks (Figure 3.12) did not show a plateau section in the temperature range from 100 oC to 300 oC, which usually indicates solvent evaporation, and only continued to decompose up to 350 oC. The BET surface area decreased from 2130 m2/g to 1260 m2/g, which may be the result of the formation of non-porous frameworks with the inclusion of the MOF-5 framework or simple blocking of flat crystals on the surface (Table 3.1). From a simple change in relative intensity, no significant conclusion can be drawn as to whether the frameworks intertwine or not from a simple change in relative intensity.
In addition, we took EXAF on the interlaced frameworks to confirm the coordination environment of Zn, which could be a clue as to how the zinc species exists on HKUST-1 (Table 3.2). As can be seen from the table, we can confirm that the coordination number of zinc was 3.70.8, which is similar to the zinc species in the Zn4O cluster form.
Conclusion