The aggregates of the damaged PSC tires released more alkali than in those of the undamaged PSC tires. In addition, the presence of bottom ash in the mixture probably suppressed the dissolution of sulfur in the GGBFS.
INTRODUCTION
- Historical background
- Alternative construction materials to replace Portland cement
- Need for microstructure analysis for construction materials
- Outline of Dissertation
The manufacturing temperature of the CSA cement is approximately ºC which is 150 - 250 ºC lower than that of the Portland cement. However, relatively high curing temperatures are required to obtain the strength of the geopolymer; thus it is somewhat difficult for field application.
![Figure 2. UN Climate Change Conference in 2015 [4]](https://thumb-ap.123doks.com/thumbv2/123dokinfo/10487196.0/20.893.250.643.126.388/figure-2-climate-change-conference-2015-4.webp)
RAW MATERIALS AND EXPERIMENTAL TECHNIQUES
Raw Materials
- Fly Ash
- Bottom Ash
- GGBFS
In particular, the study also noted that other chemical components, except calcium content, did not significantly affect the chemical reactivity of fly ash. However, many researchers agree that the amorphous content in fly ash is the most important factor determining the chemical reactivity of fly ash [24-27].

Instrumental Techniques For Materials Characterization
- Powder X-ray diffraction
- Hydration Stop Method
- Laser diffraction particle size analyzer
- X-ray fluorescence
- Thermalgravimetric analysis
- Mercury intrusion porosimetry
- Scanning Electron Microscopy
- Measurement of pH
- Inductively Coupled Plasma – Optical Emission Spectroscopy
- Petrographic Analysis
- Cold-Bonded Pelletization
- Heavy Metal Leaching
The freeze-drying method is a hydration arrest process performed by immersing the sample in liquid nitrogen. Particle size is one of the most important factors affecting the chemical reactivity of cementitious materials.
Calcium Oxide-Activated Fly Ash Binder
Therefore, it is still necessary to find a new effective way to significantly increase the strength development of CaO-activated fly ash system. This paper reported the significantly improved strength of the CaO-activated Class F fly ash systems when CaCl2 was incorporated.
Raw Material Characterization and Experimental Details for Investigation of Calcium Oxide-
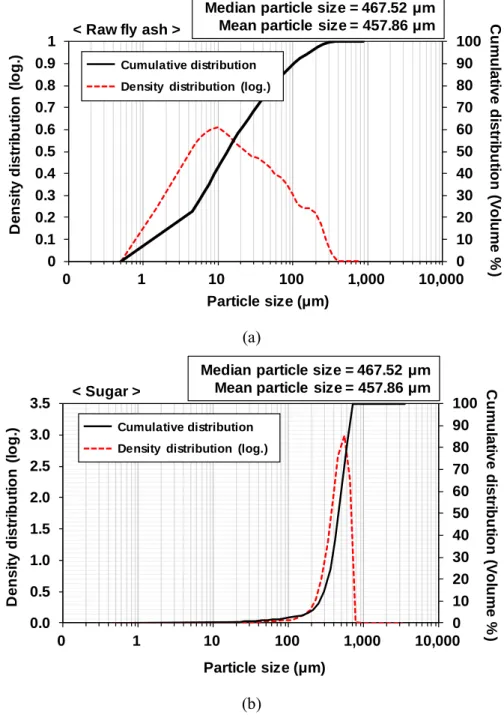
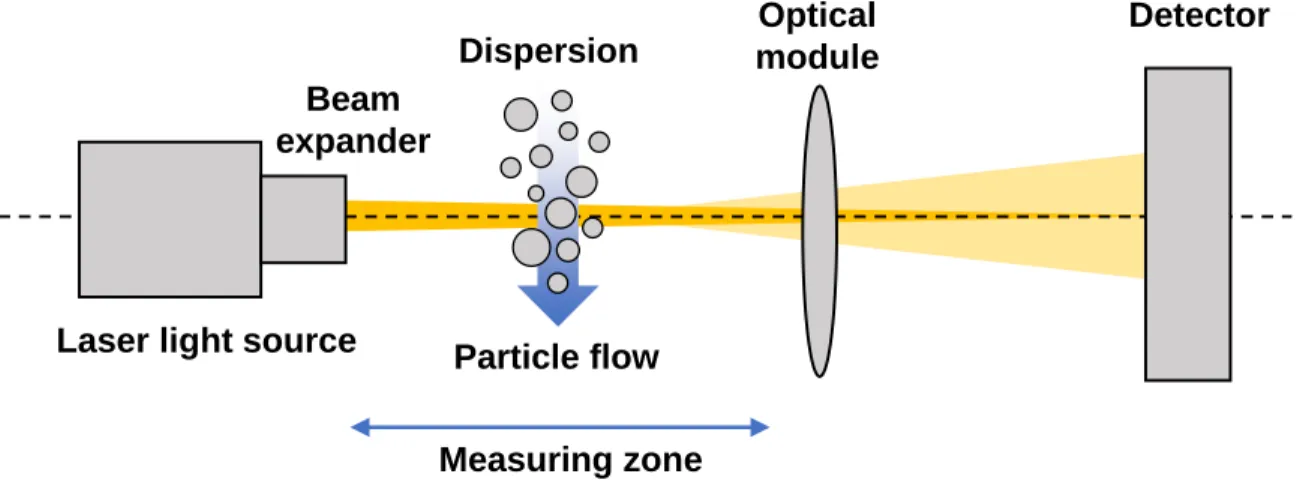
The particle size distribution of the fly ash was estimated using a laser diffraction particle size analyzer (HELOS, Sympatec, Germany) with a RODOS dispersion unit (see Figure 14). The fresh CaCl2-CaO fly ash paste maintained a suitable consistency without segregation throughout the range of w/b in this study.
Compressive Strength Of Calcium Oxide-Activated Fly Ash Binder With The Calcium
The use of CaCl2 in the CaO fly ash paste also showed a similar strength improvement after 3 days (see Figure 15 (a)), although our samples did not contain any cementitious compound (see Table 4). Reaction products formed in the calcium oxide-activated fly ash binder with the calcium chloride.
Reaction Products Formed In The Calcium Oxide-Activated Fly Ash Binder With The Calcium
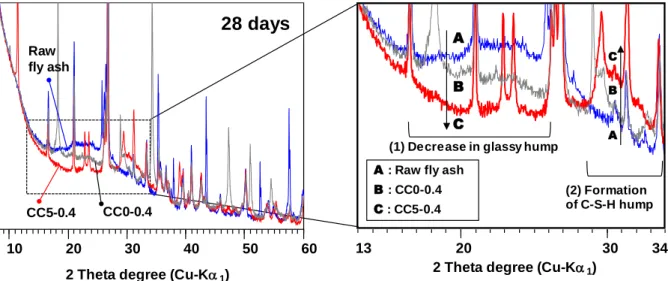
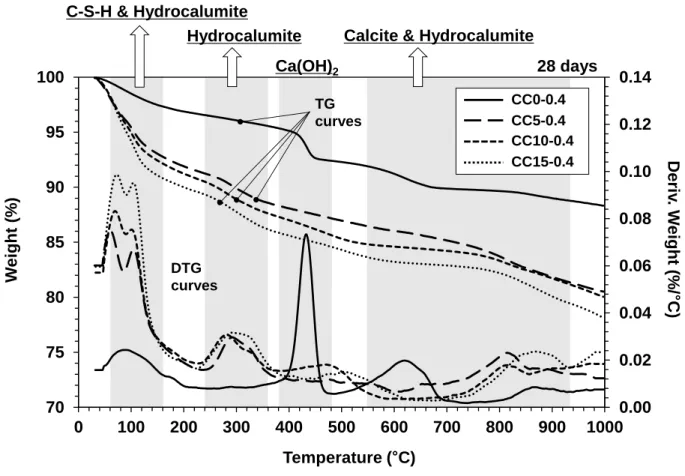
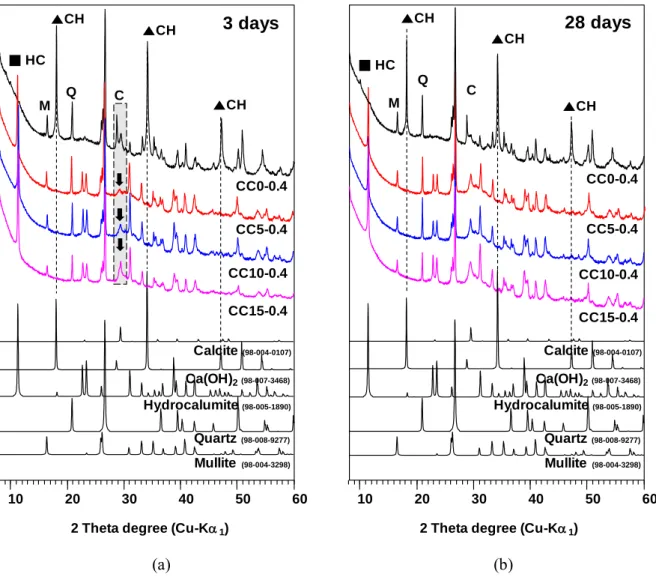
First, hydrocalumite was only identified in the samples with CaCl2, while it was not in the sample without CaCl2 [see ■ HC in Figure 16]. 33° (2θ) in the XRD results measured for the samples with a drying process, after 28 days.
Dissolution Of Fly Ash In Aqueous Phase Of The Calcium Oxide-Activated Fly Ash Binder
Dissolving fly ash in the aqueous phase of the calcium oxide activated fly ash binder with the calcium chloride.
Pore Structure Of The Calcium Oxide-Activated Fly Ash Binder With Calcium Chloride
Pore size distribution of cured samples after 28 days: (a) cumulative pore volume and (b) pore size density distribution.
Phase Analysis of the Calcium Oxide-Activated Fly Ash Binder With Calcium Chloride
Chapter Summary
In the MIP and phase diagram analysis, the samples with the synthesis of calcium oxychloride had relatively large pores in the vicinity of 1–10 μm, which was approximately 37–38% of the total pore volumes. These pores were probably the result of expansive cracking due to the formation of calcium oxychloride.
MICROSTRUCTURE ANALYSIS FOR THE DEVELOPMENT OF FLY ASH-
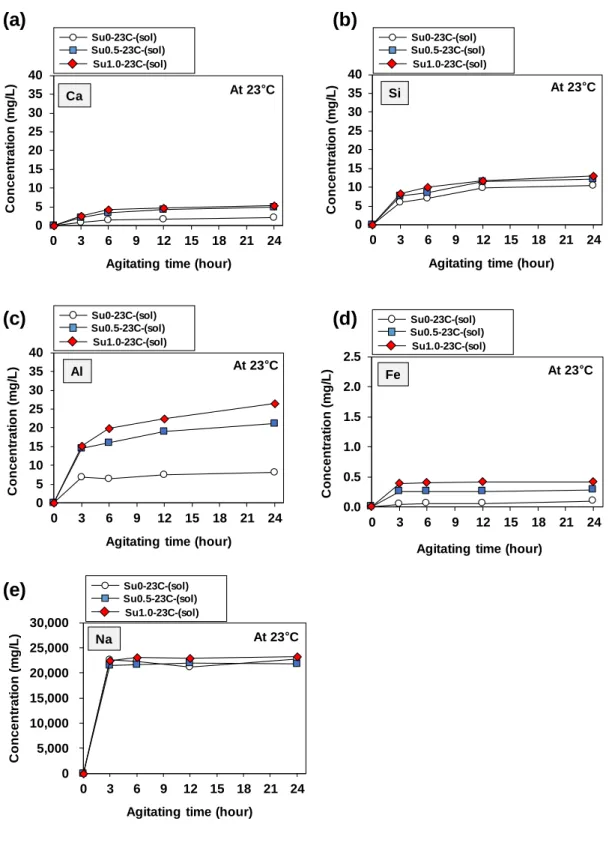
Sugar is a well-known retarding mixture; it significantly slows down the hydration rate of Portland cement [97, 115]. 117] studied the effect of sugar-induced retardation on cement hydration by comparing the concentrations of calcium, silicon, aluminum, and iron in Portland cement solutions with/without sugar.
Raw Material Characterization and Experimental Details for Investigation of The Ca(OH) 2 -
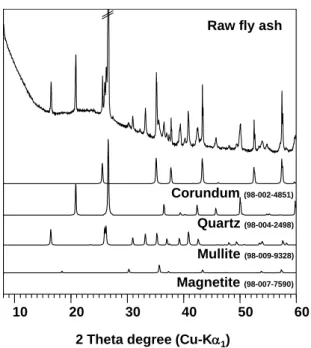
The XRD result contained a bump in the range of 15°–25° due to the presence of the amorphous phase of the raw fly ash [115]. Pore size distributions and cumulative pore volumes of the hardened samples were estimated by MIP (Autopore IV; Micrometrics, USA).
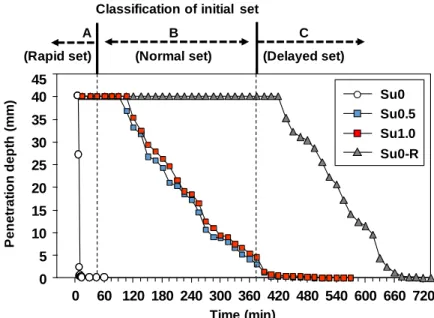
Finally, the samples were dried under vacuum for 2 days to remove any residual water or isopropanol. Thus, the samples with sugar met the standard initial setting time requirement, unlike the samples without sugar (Su0 and Su0-R).
One might suspect that the delay is an important cause for the strength improvement in this study, as it would allow more time for proper mixing of raw materials (e.g. fly ash, water and activators). However, it is worth noting that in this study, despite the significant slowing effect, remixing set samples hardly affected their strengths, as the strength development in Su0-R-23C and Su0-R-90C was very similar to that in Su0-R-90C. 23C and Su0-90C during all time periods; this observation is analogous to the effect of remixing on false-set cement samples [115].
Greater reduction in amorphous lump of fly ash with increase in sugar content. In this study, calcite also appeared immediately after the false set in the stiffened Su0 sample;
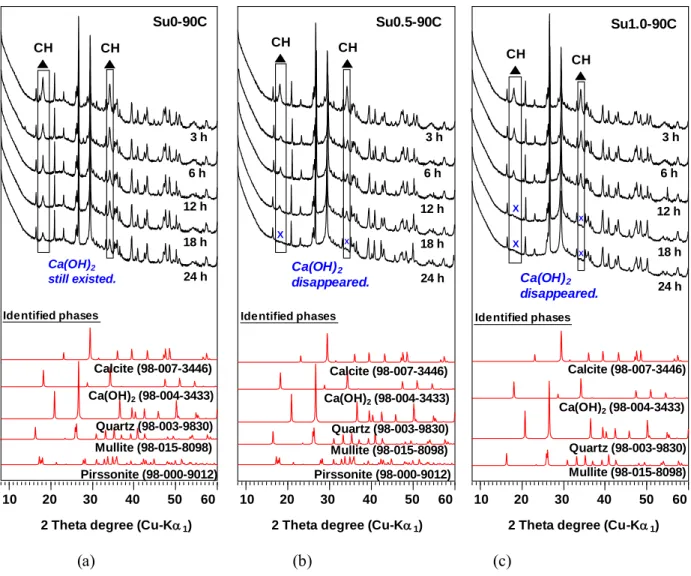
Regardless of the sugar content, with an increase in the time period, pH tended to increase at 23 °C, but decreased significantly at 90 °C. However, pH decreased with an increase in sugar content at 90 °C, indicating that the interactions between OH– ions and fly ash are greater in the presence of sugar at elevated temperatures.
Chapter Summary
In this study, the use of sugar at elevated curing temperature significantly increased the degree of dissolution of Ca(OH)2; thus, the concentration of OH– ions increased significantly, causing greater dissolution of fly ash. Regardless of the presence of sugar, high curing temperatures increase the dissolution of fly ash and the strength of the system.
MICROSTRUCTURE ANALYSIS FOR THE PRODUCTION OF THE COLD-
Use Of Coal Bottom Ash And GGBFS In The Manufacturing Artificial Aggregate
Raw Material Characterization and Experimental Details for Investigation of the Use Of Coal
The particle size distribution of GGBFS and bottom ash was investigated with a laser scattering particle size analyzer (HELOS; Sympatec, Clausthal-Zellerfeld, Germany) (Figure 37). Compressive strength of the use of coal ash and GGBFS in the production of artificial aggregate.

Compressive Strength of the Use Of Coal Bottom Ash And GGBFS In The Manufacturing
In addition, although the TCLP regulation does not include copper (Cu), zinc (Zn) and nickel (Ni), the concentrations of these elements were also measured using ICP-OES because a previous study [30] reported that bottom ash contained them in large quantities. In fact, all mix samples regardless of bottom ash content showed lower 28-day mortar strengths than B/S0.0, and the 28-day strength decreased as additional bottom ash increased.
Reaction Products of the Coal Bottom Ash and GGBFS In The Manufacturing Artificial
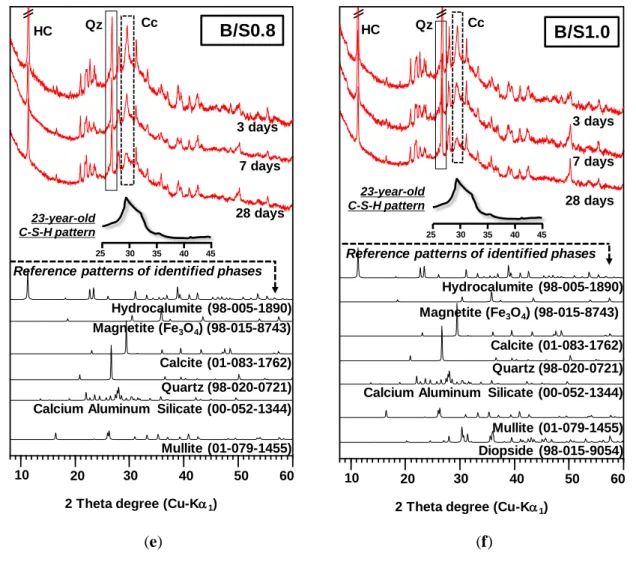
As for ettringite, as the weight fraction of bottom ash in the mixture increased, the ettringite peaks decreased or disappeared. Thus, the influence of added bottom ash on the formation of C-S-H and hydrocalumite can be evaluated.
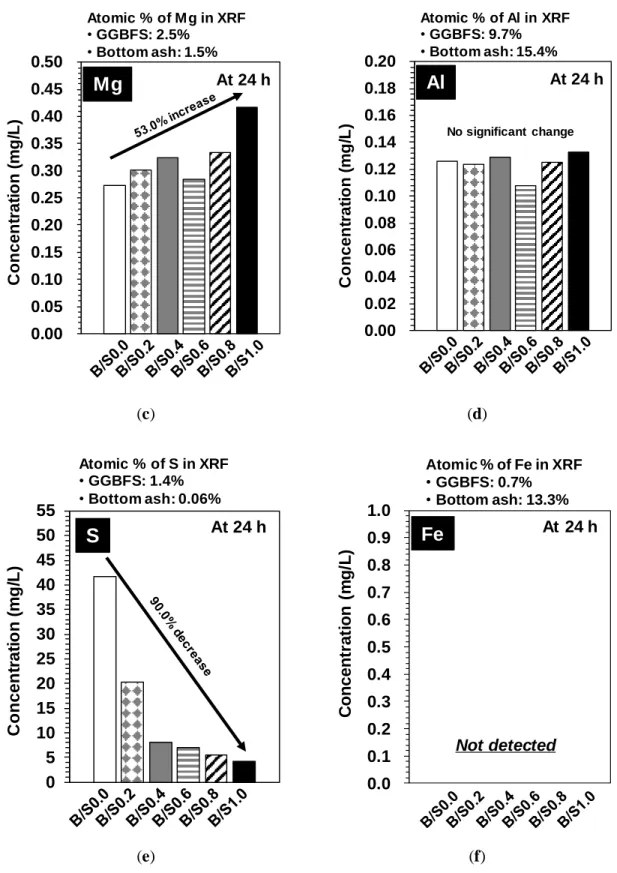
Dissolution of the Coal Bottom Ash and GGBFS
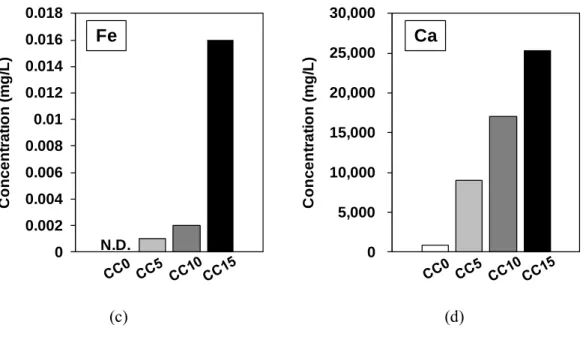
It is worth noting that no Fe ions were detected in any of the samples, regardless of the bottom ash content (Figure 44 (f)). Therefore, the results suggest that the presence of bottom ash inhibited sulfur dissolution in the GGBFS, although it is not clear how this inhibition occurred.
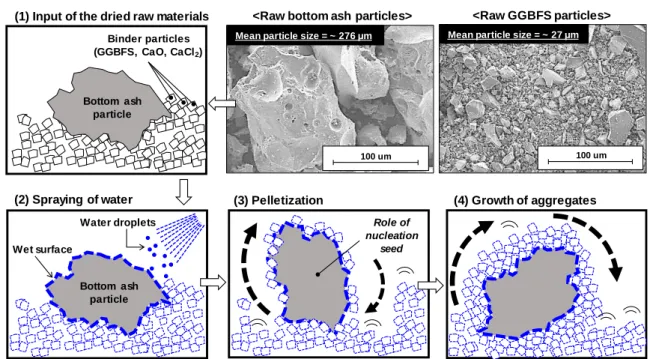
Aggregate Production
Schematic representation of the cold bound pelletizing process using fly ash and binder powder (GGBFS + CaO + CaCl2). However, all these metals were much less leached in the produced aggregates (B/S0.4) than in the ash.
Chapter Summary
Thus, this study suggests that addition of bottom ash to CaO-CaCl2-activated GGBFS binder can result in a high-strength artificial fine aggregate for the manufacture of cement mortar bricks and blocks, and can also be used as a concrete coarse aggregate through selection of aggregate size.
MICROSTRUCTURE ANALYSIS FOR THE PRODUCTION OF THE COLD-
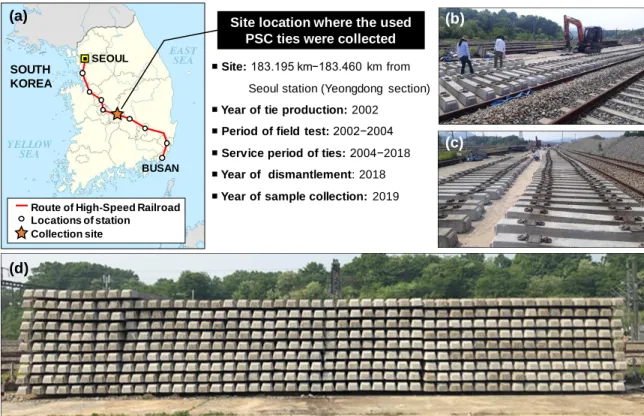
Concrete Railroad Ties In High-Speed Railway Used For 15 Years
However, from the result of the on-site inspection by KRRI, the concrete core temperatures were above 70 °C, although the concrete surface temperature met the regulation (See Figure 48). Experimental details for the investigation of concrete rail connections in the high-speed railway used for 15 years.
![Figure 48. Measurement of curing temperature for the actual concrete tie manufacturer [167]](https://thumb-ap.123doks.com/thumbv2/123dokinfo/10487196.0/106.893.277.638.438.739/figure-measurement-curing-temperature-actual-concrete-tie-manufacturer.webp)
Experimental Details for Investigation of the Concrete Railroad Ties In High-Speed Railway
Summary of 441 assembled PSC joints and 3 brand new PSC joints for static bending loading test and microstructural analysis. The test identified the constituent minerals of the coarse aggregates in the PSC alloys and compared the quartz grain sizes between the samples.
Static Flexural Loading Test of the Concrete Railroad Ties In High-Speed Railway Used For
Static bending load test of concrete tracks in high-speed railway used for 15 years. Test setup and static flexural load test results for (a) uncracked PSC bond, (b) longitudinally cracked PSC bond, and (c) map-cracked PSC bond.
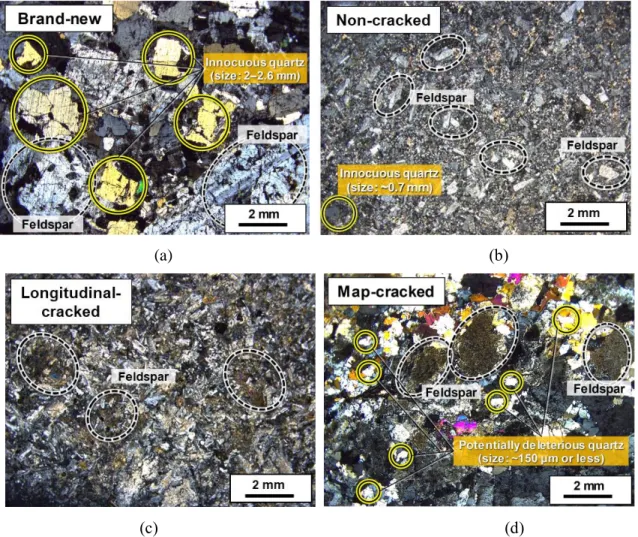
Optical Microscope Results of the Concrete Railroad Ties Samples
Thus, ASR and/or DEF were likely the causes of cracking (Figure 51) and strength deterioration (Figure 55) in the samples with longitudinal cracks and with map cracks. Optical microscopic images of cut concrete samples of (a) brand new, (b) uncracked, (c) longitudinally cracked, and (d) card cracked.
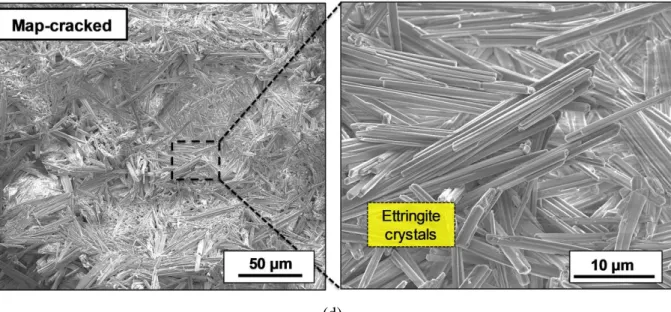
Reaction Products in the Concrete Railroad Ties Samples
It is worth noting that ettringite was only identified in the damaged PSC bond samples (i.e. longitudinally cracked and short cracked), while it was not identified in the brand new and uncracked samples (see arrows in A in Figure 58 (b )). It is worth noting that the small DTG peaks around 350 °C were only found in the damaged PSC bond samples (i.e., longitudinally-cracked and short-cracked) (see dashed box in Figure 59 ).

Petrographic Analysis of the Concrete Railroad Ties Samples
Therefore, from the XRD and TG results, the deteriorations of the damaged PSC bands (ie, longitudinal-cracked and short-cracked) can be strongly associated with both ASR and DEF. Note that most of the mineral grains in the aggregates of the 15-year used PSC tapes (ie, non-cracked, longitudinally-cracked and short-cracked) were severely damaged by weathering due to long-term use.
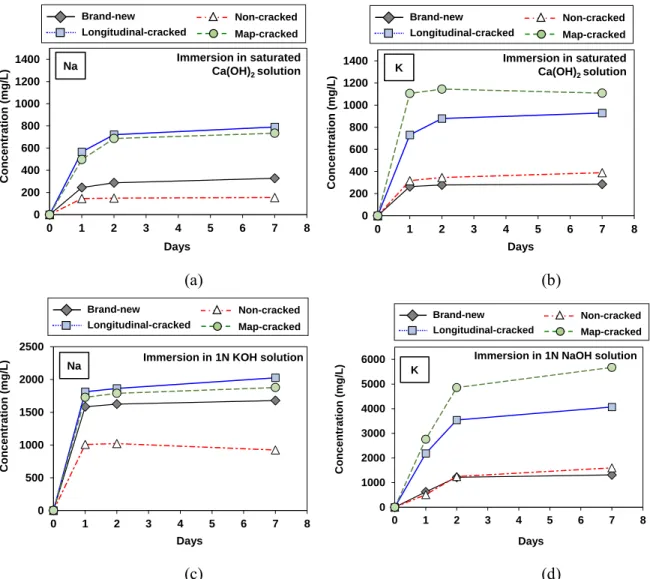
Dissolution of the Aggregates in the Concrete Railroad Ties Samples
According to the diagram, aggregates in brand new and uncracked PSC connections corresponded to harmless aggregates. However, the aggregates in longitudinally cracked and map-cracked PSC bonds were potentially reactive aggregates.
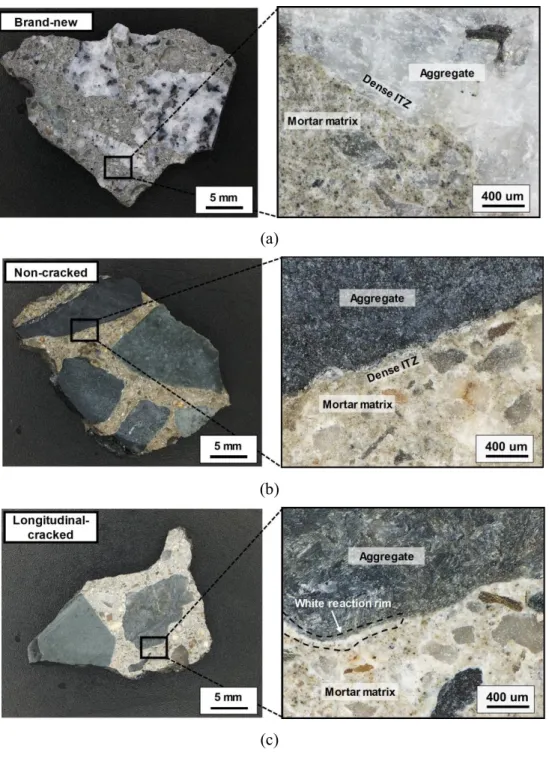
Microstructure of the Concrete Railroad Ties Samples
Representative microstructures on the fracture surface of the concrete samples in the SE images: (a) Brand new, (b) Non-cracked, (c) Longitudinally cracked and (d) Short-. First, the ITZs were very densely filled in the brand-new and uncracked samples, while the aggregate-paste interface cracks were present in the longitudinally-cracked and the short-cracked samples (see white arrows).
Comparison of the Characteristics of the Concrete Railroad Ties Samples with Typical ASR
Ternary (Si – Al – Alkali (Na+K)) diagram of elemental compositions of the aggregates based on data from the EDS results of the aggregates in Figure 65. In this study, the alkali content of the aggregates followed the order: Short-cracked ≈ Long-cracked > Brand new > Non-cracked, indicating that the alkali content of aggregates may be strongly associated with the deterioration of the PSC bonds.
Chapter Summary
The aggregates of the damaged PSC junctions contain different types of alkaline minerals (i.e. microcline, sanidine and orthoclase). Moreover, the unhydrated cement compounds (i.e., C3S and C2S) were not found in the damaged PSC compounds.
CONCLUSIONS AND FUTURE WORKS
Conclusions
In particular, solution chemistry analysis was important for understanding the chemical reaction of sugar or inhibitors. Second, microstructure analysis was performed to produce cold bound fly ash aggregates using a flat pelletizer and to identify the reaction products in the aggregate and the aggregate formation process.
Future works
Oh, microstructural and strength improvements through the use of Na2CO3 in a (OH) 2-activated cementless Class F fly ash system, Cem. Oh, Microstructural and Strength Improvements Through the Use of Na2CO3 in a Ca(OH)2 Cementless Activated F-Class Fly Ash System, Cem.

![Figure 4. Production, total use, and use in concrete of fly ash [8]](https://thumb-ap.123doks.com/thumbv2/123dokinfo/10487196.0/21.893.217.675.155.451/figure-production-total-use-use-concrete-fly-ash.webp)