An empirical study on the effects of financial inclusion models for rural poverty reduction in Uganda
Sung Ho Kim and Jae Sung Kwak
This study aims to assess the effect of financial inclusion models for rural poverty reduction in Uganda. The study uses propensity score matching, difference in difference (PSM-DID) method and data from villages in Mpigi district, Uganda to quantitatively evaluate the effect of the transformation from VSLAs (Village Savings and Loan Associations) to financial cooperatives (Saemaul Geumgo model of Korea). The results indicate the transformation into financial cooperatives has positive impacts on savings and income increase of members. In addition, the financially excluded, who had not been able to access any financial service before, have joined as members after the establishment of financial cooperatives, resulting to an increase in savings and income level. This study provides a new direction and approach on how to combine and utilize financial models and financial inclusion in the field of development cooperation.
Keywords: Uganda, Financial Inclusion, VSLA, Cooperative, Saemaul Geumgo
Ⅰ. INTRODUCTION
This paper assesses the effects of savings-based financial inclusion models for rural poverty reduction in Uganda. Micro Finance Institutions (MFIs) created a successful platform for providing financial services to the poor and attracted both scholarly and practical attentions around the world (Lee, Kwon, & Nargis, 2012; Banerjee et al., 2015; Littlefield et al., 2003; Morduch, 1999). However, from the beginning of early 2000s, the glory and excitement ended. It has become difficult to answer as to what has been achieved for the poverty reduction with the criticism that a number of MFIs gradually transformed into commercial institutions and lost their original purpose of providing financial services to the poor (Bateman, 2014; Cull, Demirguc-Kunt, & Morduch, 2007; Haldar & Stiglitz, 2014;
Jain, 2011; Saxena, 2014).
Contrary to the criticism of the deterioration and commercialization of MFIs, community- rooted savings-based financial models are spreading in rural areas in Africa and Asia (Hendricks & Chidiac, 2011; Rasmussen, 2013; Steinert et al., 2018). Rotating Savings and Credit Association (ROSCA), which is a ‘Gye’ meeting in Korea, and Village Savings and Loan Association (VSLA), a representative form of Savings Group (SG), financial cooperative or Savings and Credit Cooperative (SACCO) models such as Saemaul Geumgo of Korea are leading the paradigm shift in the financial inclusion after MFIs. These ROSCA, VSLA and Saemaul Geumgo models have common points that they are all based on savings, which are internal funds raised by group members, not external funds and they are realizing financial inclusion by improving access to financial services for the poor in rural areas, especially women, who are alienated from commercial banks and MFIs for profitability reasons (Brannen & Sheehan-Connor, 2016; Karlan et al., 2017).
ROSCA, an indigenous model found around the world, provides an effective means of protecting women’s savings from husbands (Anderson & Baland, 2002) while implementing
savings through self-control (Bauer, Chytilova, & Morduch, 2012; Gugerty, 2007), but there are limitations in flexibility and functionality in that there is no interest income or loan function (Burlando et al., 2016; Aniket, 2005). Based on the ROSCA model, VSLA is a model designed to encourage more savings by allowing members to save the amount they want or by providing short-term loans and allowing members to share the interest from the loan at the end of each year (Dupas et al., 2016; Karlan et al., 2017; Le Polain, Sterch, &
Nyssens, 2018). However, it is classified as an informal financial sector to the end, and it has not escaped the limitations of the alienation of another poor class due to the self-selecting group and the lack of available loans (Karlan et al., 2017; Maliti, 2017). Finally, a financial cooperative like Saemaul Geumgo of Korea, which is owned and democratically operated by members with common ties, is also not a model of zero defects, but it has spread all over the world based on its long experience and is playing an important role in solving the problem of financial alienation among the low-income class.
The purpose of this study is to analyze and prove the effect of contributing to the expansion of financial inclusion and poverty reduction in rural areas of Uganda through the transformation from VSLAs to financial cooperatives (Saemaul Geumgo of Korea). Through quantitative study, it proves that the transformation into financial cooperatives (Saemaul Geumgo) has a positive impact on reducing poverty through savings and income increase of villagers in rural areas. To implement the aforementioned analysis, this study collected a two- period dataset on the average monthly income and savings of VSLA members and Saemaul Geumgo members during 2019 and 2020 in Mpigi district of Uganda as well as a three-period dataset in 2016, 2017, and 2018 for testing the parallel trend assumption. To overcome self- selection bias, it adopted the propensity score matching, difference in difference (PSM-DID) method to quantitatively evaluate the effect of the transformation from VSLAs to financial cooperatives, called Saemaul Geumgo.
Ⅱ. THEORETICAL BACKGROUND Financial Inclusion in Uganda
Many theories and empirical evidence explain the important role of financial inclusion in poverty reduction (Beck & Demirgüç-Kunt, 2008). The IMF (2015) defines financial inclusion as access to and use of formal financial services, and Kibe (2019) as the inclusion of the poor who cannot use financial services by traditional financial institutions. Hanning and Jansen (2010) recognize it brings the financially excluded into the formal financial system so that they have the opportunity to access financial services. Therefore, financial inclusion improves when the poor who are financially excluded can access formal financial services.
According to the Uganda National Financial Inclusion Strategy (NFIS, 2017) report, only 16% of the adult population deposits in formal financial institutions such as banks, MFIs and SACCOs, while 60% of the Uganda adult population still keeps their money in one corner of the house or saves money by considering livestock such as pigs and cows as assets. In addition, the Uganda National Household Survey (2016/17) explains that the majority of Uganda households save through informal financial means, and in particular, about 36% of households in rural areas still keep their money at home or in the secret place.
The financial exclusion of the adult population (18 years and above) in rural Uganda is 1.7
times higher than that of the adult population in urban areas (FinScope, 2018), and Uganda still has many challenges to improve financial inclusion.
VSLA Model and its Limitations
The VSLA is a self-managed group without external funding. It provides a financial model for members to safely save, take loans, and receive insurance in case of emergency (CARE, 2014). CGAP defines VSLA as a group of people who save together and receive microloans through savings to provide savings and loans to communities that do not have easy access to formal financial services (Montesquiou & Sheldon, 2014).
VSLA was first introduced as a pilot project in Maradi, Niger in 1991 by CARE International, and CARE has spread and applied VSLA extensively in other countries such as Burundi, Kenya, Uganda and India (Anyango et al., 2006). Once established as a successful model of providing financial services to more than 2 million users in 22 countries in Africa and Asia, the VSLA approach aroused deep interest from international NGOs (Singer, n.d).
Eventually, as CARE, who first introduced VSLA to the world, standardized this model and successfully replicated it in 26 countries (22 African countries), the term VSLA was first used, and now VSLA is used as the most general term (Allen & Panetta, 2010).
According to a report from The Global Findex database (World Bank, 2017), more than 475 million people use savings groups in the village, and VSLA has 317,335 operations in 46 countries (Care International, 2017). In Uganda, the target country of this study, it was first introduced to the West Nile by CARE International in 1998, and spread nationwide in 2006 (Havnevik, 2015). As 4 out of 10 adults use VSLA, it plays a major role in improving financial access to the poor and the socially underprivileged across Uganda (FinScope, 2018).
The VSLA is governed by internal rules written by members and operates on a cycle of 9 to 12 months. At each weekly meeting, members share and save, and pay social fund. VSLA members can apply for a loan after three or four months, up to three times their savings, and usually pay 5 to 10% per month for three to four months. At the end of the operating cycle, all loans are repaid and the savings and interest income are distributed to members in proportion to their contributions (Brannen, 2010; Burlando & Canidio, 2017; Ksoll et al., 2016; Le Polain,et al., 2018; Surmont, 2017).
The VSLA, which has emerged as an alternative to the ROSCA model, can also has disadvantages and limitations. VSLA has a limitation in that it is a time-bound model in which new members are formed every year on an annual basis (Anyango et al., 2006). Due to the operating cycle of one year, members cannot withdraw their saved money until the settlement of VSLA is complete (Rachel & Marcel, 2020).
In terms of membership participation and composition, the poorest of the villages were excluded from participation in VSLA or were unable to access loans due to high defaults (Castella & Bounthanom, 2014; Lønborg & Rasmussen, 2014). People living far from the center of town, ethnic minorities, religious and cultural beliefs are less likely to participate in VSLA (TANGO International, 2013). Another problem of exclusion of the poor is being raised due to its characteristic of self-selecting group (Karlan et al., 2017; Maliti 2017).
Since VSLA relies only on limited contributions from members, it is difficult to expect a vision for savings and loans, and it is difficult to respond to the needs of members (Massu et al. 2017; Van Kien, 2012). Due to the limitation on the amount of membership savings made on a weekly basis, it is necessary to participate in multiple VSLAs at the same time in order to maximize savings profits (James, 2015; Ksoll et al., 2016). The main purpose of the VSLA
model is short-term emergency loans because the loan amount is small and the repayment period is short (Allen, 2005; Green, 2019).
The interest rate on loans is 5% per month, which is lower than that of loan sharks (private money lenders), however, higher than that of microfinance institutions and financial cooperatives (Allen & Staehle, 2007; Mutesasira et al., 1999). Most VSLAs do not have written records (Allen, 2006). Due to the absence of legal status, VSLA’s operation is individual-centered rather than rule-based, and sensitive issues are negotiated among members without guidelines (Johnson et al., 2010; Matthews et al., 2010; Rachel & Marcel, 2020). There is a problem that generosity is common in loan recovery and lacks principles and transparency (Anyango et al., 2006; Johnson & Sharma, 2004; Mule et al., 2001).
The cause of unreimbursed loans is due to weak leadership and expertise in five-member leaders (Edwards, 2010). VSLA’s cashboxes that store money are also at great risk of being stolen (Le Polain et al., 2018; Robinson, 2015).
Literature Review
Although studies on the effect of the VSLA model have recently appeared, it is difficult to find a study with significant results that shows improvement of income level. This limitation in previous studies emphasizes the necessity of transformation to financial cooperatives from the institutional perspective.
In recent studies on VSLA, they find that VSLAs do not have significant effects on income level, but they show that VSLAs generate positive effects on food security, health condition, and women’s empowerment. Brannen and Sheehan-Connor (2016) evaluate the impact on VSLA members in one of the oldest VSLA programs in Zanzibar, Tanzania. It studies VSLA members’ nutrition and health perspectives compared to control group. Green (2019) explores the continuing expansion of VSLA in rural southern Tanzania based on the anthropological theory of consciousness. It focuses on the social trust of its members. Ksoll et al. (2016) assess the effects of VSLA in northern Malawi over two years using a ‘cluster randomized trial’. The increase in savings and the use of loans through VSLA resulted in positive results of an increase in investment in agriculture and number of rooms in the dwelling. Musinguzi (2016) assesses the effects of VSLA on women’s decision-making and behavior based on an ethnographic study on VSLA conducted in Luwero, Uganda between 2012 and 2014. Karlan et al. (2017) identify the positive effects of VSLA on the empowerment of small businesses and women in Ghana, Malawi, and Uganda as target countries. However, it does not find an improvement in average consumption or other livelihoods.
In studies more tailored to the analysis of the income of VSLA members, Mwansakilwa et al. (2017) use data from eastern and western Zambia to assess the impact of VSLA participation on consumption expenditure by households in rural areas. They explain positive consumption and welfare effects of participation in the VSLA. However, rather than income level of members, still consumption level as a proxy indicator is applied in the study.
As a study on the transformation from VSLAs to financial cooperatives, there is a rapid review that introduces the current state of financial services in Karamoja, Uganda. It shows that the number of members, the amount of savings, and loanable funds have increased through the transformation into cooperatives. However, it aims to inform the readers for issues that need follow-up measures rather than study the income level of members or the formation of social networks (Seibel, H.D., 2017).
All in all, the study that seeks to expand financial inclusion through the introduction
of a financial cooperative model such as Saemaul Geumgo of Korea and transformation from the VSLA empirically and through regional cases in Uganda is viewed as meaningful and important both domestically and internationally in that it employes new approach and method.
Ⅲ. DATA AND METHODS Study Design
This study attempts to analyze the effect of applying the Saemaul Geumgo model to VSLA, an informal financial model. Based on the foundation of the VSLA model, developed to overcome the limitations of the ROSCA model, this study evaluates the empirical impact of the transformation and intervention of the Saemaul Geumgo, which improves the limitations of VSLAs and provides financial access to rural villagers of Uganda who have been excluded from financial services.
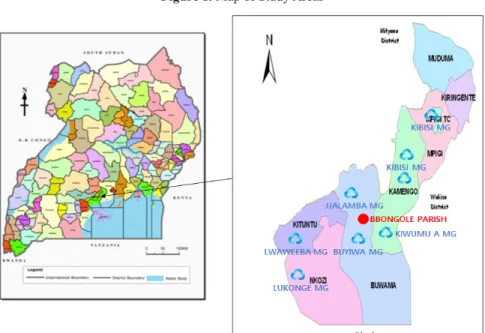
As shown in Figure 1, 8 villages, which have been transformed from VSLA and established Saemaul Geumgo in Mpigi district, Uganda since 2018, and villages in Bbongole Parish, where the VSLA model has been maintained during the experimental period are the study areas. No external projects were implemented during the study period, however, it needs to be considered the fact that the global COVID19 pandemic in 2020 also affected Uganda.
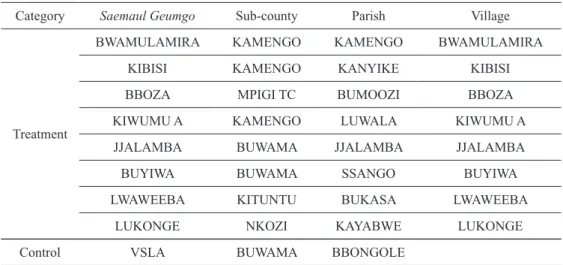
As shown in Table 1, VSLA and Saemaul Geumgo operated based on each Sub-county, Parish, and Village in Mpigi district. In case of VSLA in Bbongole Parish, which was set as the control group in the first experiment, it is located in the same sub-county as Jjalamba and
Figure 1. Map of Study Areas
Note: MG is an abbreviation for ‘Saemaul Geumgo’
Buyiwa Saemaul Geumgo. Since it shares a similar environment including ethnicity, religion, and means of living, it is judged to be suitable for the use as a control group.
Through the transformation from VSLA to Saemaul Geumgo, the study examines an increase in savings through improved access to finance and an increase in the number of members through the inclusion beyond the limit of VSLA, which operates with less than 30 members. Increased access to credit through savings can increase economic activity of households in rural areas. Exchanges and networks among members are activated through Saemaul Geumgo, which in turn improves the welfare, in particular, income level of members.
Data
The field survey was designed based on a semi-experimental method. In each village, Table 1. Locations of Saemaul Geumgo and VSLA
Category Saemaul Geumgo Sub-county Parish Village
Treatment
BWAMULAMIRA KAMENGO KAMENGO BWAMULAMIRA
KIBISI KAMENGO KANyIKE KIBISI
BBOZA MPIGI TC BUMOOZI BBOZA
KIWUMU A KAMENGO LUWALA KIWUMU A
JJALAMBA BUWAMA JJALAMBA JJALAMBA
BUyIWA BUWAMA SSANGO BUyIWA
LWAWEEBA KITUNTU BUKASA LWAWEEBA
LUKONGE NKOZI KAyABWE LUKONGE
Control VSLA BUWAMA BBONGOLE
Source: Uganda Bureau of Statistics 2017
Figure 2. Intervention and Data collection
village leaders, including public officials, were first approached to identify suitable members and residents for the experiment. From the VSLA member list, the application form for the establishment of Saemaul Geumgo, and the member list, surveyors made a list by village and selected participants at random.
As for the data, as shown in Figure 2, under the supervision of the researcher, baseline data of before 2019 were collected from January 2019 for one month period. In addition, the end-line data was collected for one month from January 2021. In the 2019 and 2021 data collection, 18 surveyors completed surveys with 622 and 613 members and villagers, respectively.
The subjects of the survey were largely divided into 4 groups. The first are those who have been active as VSLA members in each village and become one of founding members with the establishment of Saemaul Geumgo, which is the treatment group of the first experiment. The second was members of VSLA in the Bbongole parish, Buwama sub-county in Mpigi district, and maintains memberships of the VSLA during the Saemaul Geumgo project. They are the control group of the first experiment. The third is those who did not belong to any VSLA in the village where Saemaul Geumgo was established, however, became members through the establishment of Saemaul Geumgo. They are the treatment group of the second experiment.
Lastly, those who did not participate in any VSLA in the village where Saemaul Geumgo was established, and who have not yet become members during the Saemaul Geumgo project period, are also the control group for the second experiment.
The survey was conducted in greater depth, including the respondents’ demographic information, savings and loans (interest, amount, period), income levels, as well as more detailed questions about the activities of the Saemaul Geumgo project and how VSLA and Saemaul Geumgo played a role during the 2020 Corona pandemic period.
In case of VSLA members in Bbongole parish, the control group could be well controlled because Saemaul Geumgo did not implement and intervene those areas and the business area that could become a member of Saemaul Geumgo was not overlapped with those areas.
A follow-up survey was conducted to limit the attrition and loss of the baseline survey sample, and there have been cases of failure to track the same sample. In the 2019 and 2021 surveys, the loss was 9 people, less than 2%.
Ⅳ. EMPIRICAL ANALySIS Empirical Strategy
This study uses an econometric approach known as difference in differences (DID) to assess whether a particular intervention affects the target population or outcome. The difference in differences method is a quasi-experimental technique that measures the causal effect of non-random interventions and is widely used in many economic fields (Guido &
Ludger, 2020; World Bank, 2010). Card and Kruger (1994), Wooldridge (2008) and Stock and Watson (2011) provide some examples of this application.
The DID strategy is often used in policy analysis in the context of natural experiments.
Natural experiments occur when some participants are exposed to policy interventions and others are not. The group exposed to the intervention is called the treatment group, and the group not exposed to the treatment is called the control group. DID analysis is a suitable econometric methodology for estimating the actual impact of an intervention (Suresh,
Shailendra, & Arne, 2017).
The impact of Saemaul Geumgo is measured by evaluating the difference in the mean value of outcome variables among participants by comparing what the outcome would have been if they had not participated in the program. Therefore, program impact is defined as the expected value of the difference between the level of the outcome variable of the participant and the level that would be obtained if the participant was not participating in the program. A total of 4 regression models were used to estimate the impact analysis, and each experiment was intended to test the difference between average monthly income and average monthly savings. The following regression equation 1 was constructed according to the logical model of the DID method.
Equation 1: Yit = β0 + β1Tit + β2Mit + β3TitMit + β4∑Xit + εit
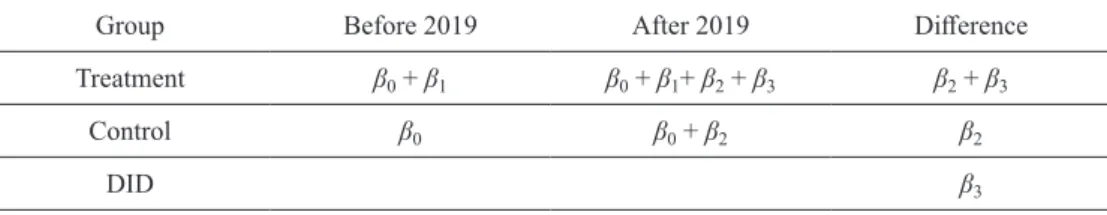
Yit, the dependent variable, is the average monthly income of participant i in year t. β0 means a constant term that is the average before Saemaul Geumgo’s intervention. Tit is a dummy variable with a value of 0 in the case of year 2018, before the Saemaul Geumgo intervention, and 1 in the case of 2020, the endline data. Mit is a dummy variable with a value of 0 for VSLA members and 1 for Saemaul Geumgo members. Tit∙Mit is an interaction term between Saemaul Geumgo membership and before and after the Saemaul Geumgo intervention, and β3 is the parameter of interest in the difference in differences analysis as shown in Table 2. ∑Xit is covariates, representing the characteristics of the experiment subjects, and does not affect the difference in differences estimator when it is a time-invariant variable. Finally, εit represents the error term.
In order to test the difference in average monthly savings of participants, regression equation 2 was constructed according to the logical model of the DID method.
Equation 2: Sit = β0 + β1Tit + β2Mit + β3TitMit + β4∑Xit + εit
Sit, the dependent variable, is the average monthly savings of participant i in year t. β0 means a constant term that is the average before Saemaul Geumgo’s intervention. Tit is a dummy variable with a value of 0 in the case of year 2018, before the Saemaul Geumgo intervention, and 1 in the case of 2020, the end-line data. Mit is a dummy variable with a value of 0 for VSLA members and 1 for Saemaul Geumgo members. Tit∙Mit is an interaction term between Saemaul Geumgo membership and before and after the Saemaul Geumgo intervention, and β3 is the parameter of interest in the difference in differences analysis. ∑Xit is covariates representing the characteristics of the experiment participants, and εit represents the error term.
The second experiment, the treatment group in the village where Saemaul Geumgo was
Table 2. Meaning of the DID method
Group Before 2019 After 2019 Difference
Treatment β0 + β1 β0 + β1+ β2 + β3 β2 + β3
Control β0 β0 + β2 β2
DID β3
established and operated, did not belong to any VSLA, but became members through the establishment of Saemaul Geumgo, and the control group who are still not members of Saemaul Geumgo are also tested the difference by applying the same regression equations 1 and 2, respectively.
An important challenge for assessing the impact of the Saemaul Geumgo intervention is to constitute a counterfactual that is not sensitive to selection bias caused by non-randomized program placement and self-selection for program participation (Banergee & Duflo, 2009).
Even though the difference in differences method that strictly controls the difference between the treatment group and the control group and the difference in the trends of participants after the Saemaul Geumgo intervention, the effect of the Saemaul Geumgo intervention may be overestimated or underestimated due to a selection bias if an appropriate experimental group is not selected.
Propensity Score Matching (PSM) is a viable option in the presence of high-quality, non- random observation data that includes baseline data, exposure and treatment, and information on outcomes of interest (Winger & Nason, 2016). Matching based on the propensity score can identify individuals in the control group with characteristics, similar to those affected by the policy (Nolan A, 2008). The advantage of propensity score matching is that the problem of selection bias can be solved by comparing pairs of the treatment group and the control group. Matched samples have less variance in ATT (average treatment effect on the treated) estimates than random samples and are statistically more robust (Heckman, Ichimura, &
Todd, 1997). As a propensity score matching method, a kernel propensity score matching is used in order to minimize the loss of samples. This is a method of pairing objects in the treatment group and the control group by applying a weight according to a value that is inversely proportional to the difference in matching scores (Baum, 2006). Therefore, in this study, the analysis through sequential application of PSM and DID was conducted by tracking members (treatment group) and non-members (control group) for financial and social changes before and after the Saemaul Geumgo participation.
Parallel Trend Assumption
In order to estimate the causal effect of difference in differences analysis, the Parallel Trend Assumption needs to be satisfied. In the absence of intervention, the assumption is that the difference between the treatment group and the control group should be constant over time. This assumption is the most important and the most difficult to ensure the internal validity of the difference in differences model. The violation of the parallel trend assumption results in a biased estimate of the causal effect.
The parallel trend assumption can be tested by checking whether the trend of the values of the dependent variable of the two groups flows in parallel during the period prior to the establishment of Saemaul Geumgo in this study. The time from t = 1 (year of 2016) to t = 3 (2018) corresponds to before Saemaul Geumgo intervention, and the time from t = 4 (2019) to t = 5 (2020) corresponds to after Saemaul Geumgo establishment. For hypothesis testing, the following regression model was established.
Equation 3: Yit = α + β2 (t2∙Ti) + β3 (t3∙Ti) + β4 (t4∙Ti) + β5 (t5∙Ti) + εit
In the above equation, (t2∙Ti) to (t5∙Ti) are interaction terms of the time dummy variable and the treatment dummy variable. Ti has a value of 1 if it belongs to the treatment group and
0 if it belongs to the control group. To test the parallel trend assumption, after estimating the model of Equation 3 above, the null hypothesis is tested as follows.
H0 : β2 = β2 = 0
Since the time t = 1 is excluded from Equation 3, β2 and β2 are DID estimators when compared to the time t = 1. However, since t = 1 to t = 3 is before Saemaul Geumgo intervention, the DID estimator should be zero. Therefore, if the above null hypothesis is not rejected, it can be judged that the parallel trend assumption is satisfied.
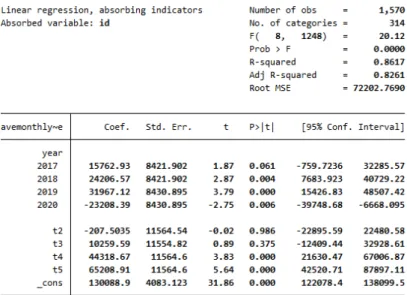
In the Figure 3, the variables corresponding to the interaction terms in Equation 3 are marked from t2 to t5. Looking at the results of the F test at the bottom of the figure, it cannot be judged that the estimation coefficients of the t2 and t3 variables corresponding to the time before treatment are significantly different from 0. If the null hypothesis is not rejected through the F test, it is judged that the Parallel Trend Assumption is satisfied. As a result of the hypothesis test, the p-value is greater than 0.05, so the null hypothesis above cannot be rejected at the 5% level.
In addition, in Figure 3, the estimation coefficients of the t4 and t5 variables are the DID estimates after the establishment of Saemaul Geumgo. Since it is significantly different from 0, it is judged that the treatment effect compared to the time t=1 is significant.
As Figure 4 suggests average monthly income for both treatment and control group appears to move in parallel trend prior to the intervention, which is 2018. After the
Figure 3. Parallel Trend Assumption Test for the experiment (1)
intervention, average monthly income for treatment group sharply increased compared to control group, meaning there is a significant relationship between the Saemaul Geumgo transformation and average monthly income.
Figure 4. Graphical diagnostics for the experiment (1)
Figure 5. Parallel Trend Assumption Test for the experiment (2)
In the second experiment, the treatment group in the village where Saemaul Geumgo was established and operated, did not belong to any VSLA, but became members through the establishment of Saemaul Geumgo, and the control group who are still not members of Saemaul Geumgo are also tested the Parallel Trend Assumption in the same way as above.
The result is shown in Figure 5 with the confirmation that Parallel Trend Assumption holds in the second experiments.
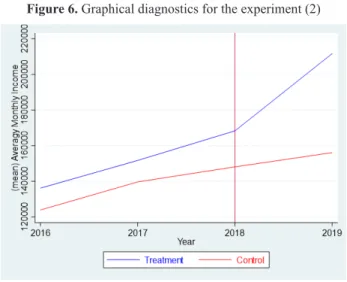
As Figure 6 suggests average monthly income for both treatment and control group appears to move in parallel trend prior to the intervention, which is 2018. After the intervention, average monthly income for treatment group sharply increased compared to control group, meaning there is a significant relationship between the Saemaul Geumgo membership and average monthly income.
Ⅴ. STUDy RESULTS VSLA VS Saemaul Geumgo
First, the study compares at the treatment group, VSLA members who became members of Saemaul Geumgo with the intervention and establishment of Saemaul Geumgo, and the control group, VSLA members in the Bbongole parish, Buwama sub-county.
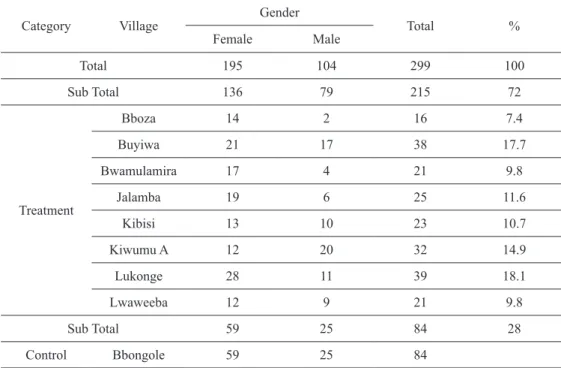
As shown in Table 3, 215 members of 8 villages in Mpigi district, Uganda have been surveyed as the treatment group. The number of participants is not concentrated in one village and is distributed proportionately. In the control group, a total of 84 VSLA members in Bbongole Parish have been tracked. When looking at the ratio of males and females, females are relatively more involved than males, because females, who were classified as socially vulnerable in rural Uganda, use financial services mainly through informal financial means such as VSLA. Saemaul Geumgo is seeking to improve access to finance while embracing these financially underprivileged groups.
Figure 6. Graphical diagnostics for the experiment (2)
Table 3. Descriptive statistics of Treatment and Control group by villages
Category Village Gender
Total %
Female Male
Total 195 104 299 100
Sub Total 136 79 215 72
Treatment
Bboza 14 2 16 7.4
Buyiwa 21 17 38 17.7
Bwamulamira 17 4 21 9.8
Jalamba 19 6 25 11.6
Kibisi 13 10 23 10.7
Kiwumu A 12 20 32 14.9
Lukonge 28 11 39 18.1
Lwaweeba 12 9 21 9.8
Sub Total 59 25 84 28
Control Bbongole 59 25 84
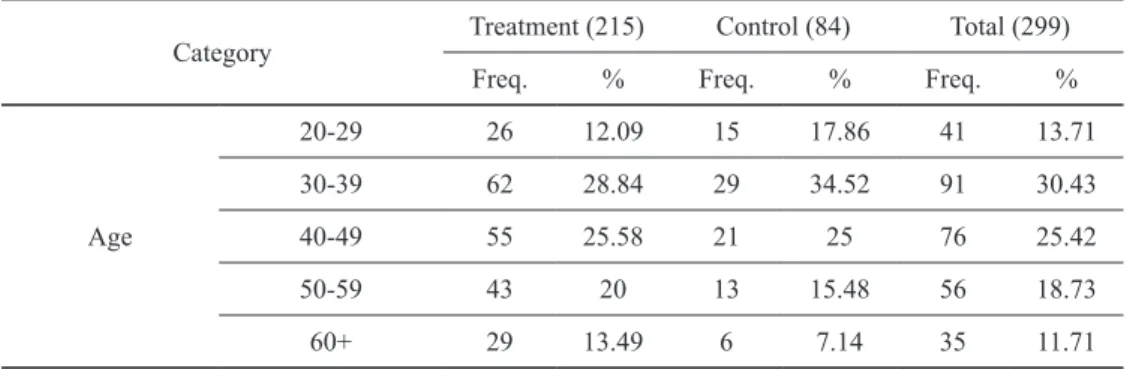
In the analysis, Age, Occupation, Level of Education, Marital Status, Household Size, and Household Head’s Sex were applied as covariates, and their statistical characteristics are shown in Table 4. Age is similar to Uganda’s population composition and proportion (UBOS, 2021), with about 70% of participants in their 20s, 30s and 40s. In the case of Occupation, about 60% of them are engaged in agriculture, reflecting the characteristics of Uganda, whose main industry is agriculture. In terms of education level, most of them were found to have received primary and secondary education. About 72% of the target people are married, and over 90% of the households have a household size of less than 10 people.
Table 4. Descriptive statistics of Treatment and Control group by covariates
Category Treatment (215) Control (84) Total (299)
Freq. % Freq. % Freq. %
Age
20-29 26 12.09 15 17.86 41 13.71
30-39 62 28.84 29 34.52 91 30.43
40-49 55 25.58 21 25 76 25.42
50-59 43 20 13 15.48 56 18.73
60+ 29 13.49 6 7.14 35 11.71
Category Treatment (215) Control (84) Total (299)
Freq. % Freq. % Freq. %
Occupation
Artisan 2 0.93 4 4.76 6 2.01
Casual Labour 7 3.26 2 2.38 9 3.01
Farmer 127 59.07 52 61.90 179 59.87
Micro Business 58 26.97 17 20.24 75 25.08
Skilled Labour 21 9.77 9 10.71 30 10.03
Education Level
None 14 6.51 3 3.57 17 5.69
Primary 96 44.65 47 55.95 143 47.83
Secondary 85 39.53 25 29.76 110 36.79
Tertiary 17 7.91 9 10.71 26 8.70
Vocational 3 1.40 - 0 3 1.00
Marital Status
Married 160 74.42 55 65.48 215 71.91
Separated 18 8.37 16 19.05 34 11.37
Single 8 3.72 2 2.38 10 3.34
Widowhood 29 13.49 11 13.10 40 13.38
Household Size
~ 5 72 33.48 35 41.66 107 35.79
6~10 119 55.34 47 55.95 166 55.52
11~15 17 7.90 1 1.20 18 6.02
16~20 7 3.25 1 1.20 8 2.68
Household Head’s Sex
Female 49 22.79 26 30.95 75 25.08
Male 166 77.21 58 69.05 224 74.92
In this study, the Propensity Score Matching (PSM) was conducted to estimate the inherent effect of the Saemaul Geumgo intervention. PSM was used to reduce possible selection bias in the process of signing up for Saemaul Geumgo as a member of an individual.
In addition, by sequentially applying PSM and DID, homogeneity for samples was secured.
The results of PSM are shown in Figure 7.
As shown in Figure 8, it was confirmed that average monthly income increased 129,394 UGX (approximately USD 35) after 2 years of Saemaul Geumgo intervention, and the result was significant.
Looking at the average effect of difference in differences of the average monthly savings, the coefficient means an increase in the monthly savings of 24,158 UGX (approximately USD 6.5) over two years after the intervention of Saemaul Geumgo, and the result was also statistically significant as shown in Figure 9.
In conclusion, it was confirmed that members could improve both average monthly income and average monthly savings through the transformation to the Saemaul Geumgo
model, not staying in the VSLA model, and the result value was also statistically significant with the use of propensity scores in conjunction with DID.
Savings of Saemaul Geumgo members has increased through improved access to finance and the transformation into a formal financial institution which is more reliable. Raised funds led to an increase in loanable fund with lower interest rate, resulting in an increase in income
Figure 7. The results of Kernel PSM
Figure 8. The effect of average monthly income difference after PSM
by business investment.
non-Saemaul Geumgo VS Saemaul Geumgo
In the next assessment, the study compares at the treatment group who did not belong to any VSLAs, however, signed up as members of Saemaul Geumgo along with the establishment and operation of Saemaul Geumgo, and the control group, who has not used any financial services from VSLA and Saemaul Geumgo during the Saemaul Geumgo intervention.
As shown in Table 5, 167 persons of treatment group and 147 persons of control group were investigated in 8 villages in Mpigi district, Uganda, and a total of 314 persons has been tracked. Both the treatment group and the control group are not concentrated in any one village and are proportionately distributed. The ratio of males and females both in the treatment group and the control group is quite similar at the lever from 45% to 54%.
In the analysis, Age, Occupation, Level of Education, Marital Status, Household Size, and Household Head’s Sex were applied as covariates, and their statistical characteristics are shown in Table 6. Age is similar to Uganda’s population composition and proportion (UBOS, 2021), accounting for 78% of people in their 20s, 30s and 40s. In the case of Occupation, about 52% are engaged in agriculture and 28% are running micro businesses. In terms of education level, 87% of both groups are found to have received secondary education or lower. About 71% of groups are married, and over 95% of the households have a household size of less than 10 people.
Figure 9. The effect of average monthly savings difference after PSM
Table 5. Descriptive statistics of Treatment and Control group by villages
No. Category Treatment Control
Freq. % Freq. %
Total
Total 167 100 147 100
Female 87 52.10 67 45.58
Male 80 47.90 80 54.42
1 Bboza Female 14 8.38 14 9.52
Male 1 0.60 1 0.68
2 Buyiwa Female 9 5.39 7 4.76
Male 6 3.59 13 8.84
3 Bwamulamira Female 16 9.58 12 8.16
Male 13 7.78 6 4.08
4 Jjalamba Female 7 4.19 7 4.76
Male 3 1.80 13 8.84
5 Kibisi Female 12 7.19 10 6.80
Male 4 2.40 10 6.80
6 Kiwumu A Female 4 2.40 7 4.76
Male 13 7.78 13 8.84
7 Lukonge Female 10 5.99 7 4.76
Male 18 10.78 8 5.44
8 Lwaweeba Female 15 8.98 3 2.04
Male 22 13.17 16 10.88
Table 6. Descriptive statistics of Treatment and Control group by covariates Category Treatment (167) Control (147) Total (314)
Freq. % Freq. % Freq. %
Age
20-29 41 24.55 54 36.73 95 30.25
30-39 43 25.75 49 33.33 92 29.30
40-49 33 19.76 24 16.33 57 18.15
50-59 30 17.96 10 6.80 40 12.71
60+ 20 11.98 10 6.80 30 9.55
Occupation
Artisan 5 2.99 17 11.56 22 7.01
Casual Labour 1 0.60 1 0.68 2 0.64
Farmer 86 51.50 76 51.70 162 51.59
Micro Business 53 31.74 34 23.13 87 27.71
Skilled Labour 22 13.17 19 12.93 41 13.06
Next, the average effect of difference in differences, which analyzes the results of membership and activities as members of Saemaul Geumgo, was assessed through two models. The average effect of difference in differences is checked by the coefficient of interaction term between Saemaul Geumgo’s intervention and the project period. In addition, in this analysis, propensity score matching was also conducted to estimate the inherent effect of the Saemaul Geumgo project. PSM was used to reduce possible selection bias in the process of joining Saemaul Geumgo as a member of an individual, and by sequentially applying PSM and DID, homogeneity for samples was secured. The results of PSM are shown in Figure 10.
As shown in Figure 11, it is confirmed that the average monthly income increased by 58,172 UGX (approximately USD 16) after 2 years for members who joined Saemaul Geumgo, as compared to those who did not.
Looking at the average effect of difference in differences of the average monthly savings, the coefficient means an increase in the monthly savings of 25,845 UGX (about USD 7) over two years after joining Saemaul Geumgo, and the result is also statistically significant as shown in Figure 12.
In conclusion, it is confirmed that by joining Saemaul Geumgo as a member, income generation and quality of life have been improved through the access to financial services and saving, and the result value is statistically significant.
Category Treatment (167) Control (147) Total (314)
Freq. % Freq. % Freq. %
Education Level
None 7 4.19 2 1.36 9 2.87
Primary 83 49.70 72 48.98 155 49.36
Secondary 51 3.54 58 39.46 109 34.71
Tertiary 26 15.57 15 10.20 41 13.06
Marital Status
Married 109 65.27 113 76.87 222 70.70
Separated 18 10.78 11 7.48 29 9.24
Single 21 12.57 14 9.52 35 11.15
Widowhood 19 11.38 9 6.12 28 8.92
Household Size
~ 5 87 52.10 95 64.63 182 57.96
6~10 69 41.32 49 33.33 118 37.58
11~15 8 4.78 3 2.04 11 3.05
16~20 3 1.80 0 0 3 0.96
Household Head’s Sex
Female 37 22.16 20 13.61 57 18.15
Male 130 77.84 127 86.39 257 81.85
Villagers who were financially excluded or had limited financial access did not have the opportunity to save. There is no seed money to start a business, which leads to a vicious cycle of poverty. Villagers who became members of Saemaul Geumgo started to invest in business through regular savings of financial resources, which led to an increase in income.
Figure 10. The results of Kernel PSM
Figure 11. The effect of average monthly income difference after PSM
Ⅵ. CONCLUSIONS AND POLICy IMPLICATIONS
In this study, the introduction and utilization of Korea’s representative financial cooperative model, Saemaul Geumgo, have been reviewed as a strategy to solve the financial exclusion and overcome the limitations of informal financial mechanisms in Uganda, Africa.
The purpose and background of this study is to seek a financial model that provides the financial services for the poor in rural Uganda while improving the access to finance. Based on the VSLA model, the transformation into the financial cooperative shows that the savings and income levels of village residents in rural areas of Uganda have increased.
Many MFIs have gradually become commercialized and lost their original purpose of providing financial services to the poor in developing countries, and efforts and attempts to find alternatives and new financial models over MFIs that meet the goal of financial inclusion are continuously being made in many countries around the world.
This study analyzes the effects of development cooperation projects in developing countries with the focus on the financial sector. It is also overcoming the limitations of existing studies in that it studies the effects of financial inclusion and poverty reduction through financial model improvement in rural areas.
Based on the results of this study, it is possible to propose fundamental measures to enable poverty reduction through financial inclusion which will help solve the problem of financial exclusion and providing financial access to the poor in developing countries. Informal financial models such as VSLA have spread not only in Uganda, but also throughout Africa, and are also easily found in rural Asia. In other words, it is expected to contribute to poverty reduction by expanding global financial inclusion and improving financial access to the poor in rural areas through the transformation from the informal financial model into a financial cooperative.
Figure 12. The effect of average monthly savings difference after PSM
Despite the importance of this study, it has the following limitations. First, the scope of study is limited to the case of Uganda. When national and regional environments or characteristics are influenced by variables, it is insufficient to have a general perspective.
Second, it conducted quantitative analysis, however, the effects are limited to improving the living standard such as savings and income increase. Further study on women’s social empowerment needs to be carried out. Finally, the hypothesis that the VSLA’s limitations can be complemented through the transformation into Saemaul Geumgo might overlook the advantages of VSLA model. Poor and women living in rural areas of developing countries might feel that the simple and easy-to-understand VSLA model is better suited to their needs due to their relatively low education level.
Saemaul Geumgo in Korea has created a community where individuals cooperate with each other in the process of Korea’s economic development and make a link with finance to create a foundation for self-reliance from poverty. It has developed into a representative success case that contributes to the breakdown of usurious loan and poverty reduction by providing low-interest loan services by pooling the capital with the money that members saved penny after penny. Korea is one of the few countries that has evolved from a country receiving aid to a country providing aid. Korea’s development experience is a significant example in establishing the development strategy of the developing countries.
Financial inclusion is further emphasized in accordance with the core principle of the SDGs ‘No one left behind’. Although this study does not provide macroscopic effects of the introduction of Saemaul Geumgo to developing countries, it provides an idea on improving financial accessibility and the direction of financial inclusion as a way to contribute to poverty reduction. It concludes with the hope that discussions on financial inclusion in the development cooperation sector will continue and further develop.
Article Received: 10-05-2021 Revised: 02-06-2021 Accepted: 07-06-2021
REFERENCES
Allen H. 2005. ‘Village Savings and Loan Associations (VS&LAs) in Africa: Training Guide 1 Version 1.2’ VSL Associates
Allen H. 2006. Village savings and loans associations - sustainable and cost-effective rural finance, Small enterprise development Vol. 17, Iss. 1, (Mar 2006): pp.61-68
Allen H. and D. Panetta. 2010. Savings groups: What are they. SEEP Network
Allen H., Staehle, M. 2007. ‘Village Savings and Loan Associations (VSLAs) Programme Guide Field Operations Manual Version 3.1’ VSL Associates
Anderson, S., & Baland, J. 2002. The economics of roscas and intrahousehold resource allocation. The Quarterly Journal of Economics, 117(3). pp.963-995
Aniket, K. 2005. Self help groups: Use of modified ROSCAs in microfinance Edinburgh School of Economics, University of Edinburgh
Anyango, E., E. Esipisu, L. Opoku, S. Johnson, M. Malkamaki, and C.Musoke. 2006. Village Savings and Loan Associations in Zanzibar. London: Department for International Development (DFID)
Banerjee, A. and Duflo, E. 2009. The experimental approach to development economics.
Ann. Rev. Econ. 1. pp.151-178
Banerjee, A., Duflo, E., Glennerster, R., & Kinnan, C. 2015. The miracle of microfinance?
Evidence from a randomized evaluation. American Economic Journal: Applied Economics, 7(1). pp.22-53
Bank of Uganda. 2017. National Financial Inclusion Strategy 2017-2022
Bateman, M. 2014. The rise and fall of muhammad yunus and the microcredit model
Bauer, M., Chytilová, J., & Morduch, J. 2012. Behavioral foundations of microcredit:
Experimental and survey evidence from rural india. American Economic Review, 102(2). pp.1118-1139
Baum, Christopher F. 2006. “Time-series filtering techniques in Stata.”
Brannen, Conner. 2010. An Impact Study of the Village Savings and Loan Association (VSLA) Program in Zanzibar, Tanzania. Honors Theses - All
Brannen, C., & Sheehan-Connor, D. 2016. Evaluation of the impact of village savings and loan associations using a novel survey instrument. Development Southern Africa, 33(4). pp.502-517
Beck, Thorsten & Demirgüç-Kunt, Asli, Access to Finance: An Unfinished Agenda, The World Bank Economic Review, Volume 22, Issue 3, 2008, pp.383-396
Burlando, A., & Canidio, A. 2017. Does group inclusion hurt financial inclusion? evidence from ultra-poor members of ugandan savings groups. Journal of Development Economics, 128. pp.24-48
Burlando, Alfredo and Canidio, Andrea and Selby, Rebekah. 2016. The Economics of Savings Groups. Available at SSRN: https://ssrn.com/abstract=2785033
Card, David and Alan B. Krueger. 1994. “Minimum Wages and Employment: A Case Study of the Fast-Food Industry in New Jersey and Pennsylvania,” American Economic Review 84(4). pp.772-793
Care International. 2017. An overview of the global reach of Care’s village savings and loans association programing. Care
CARE Uganda VSLA. 2014. Retrieved from https://www.care.org.au/wp-content/
uploads/2014/12/CARE-VSLA-Report-Uganda-Eco-Devel.pdf
Castella, J.-C., & Bounthanom, B. 2014. Farmer cooperatives are the missing link to meet market demands in Laos. Development in Practice
Cull, R., Demirgu¨ ç‐Kunt, A., & Morduch, J. 2007. Financial performance and outreach: A global analysis of leading microbanks. The Economic Journal, 117(517). pp.107-133 Dupas, P., Karlan, D., Robinson, J., & Ubfal, D. 2016. Banking the unbanked? evidence from
three countries. NBER Working Paper Series. 22463
Edwards, R. 2010. “Saving for change in Mali: a study of atypical groups from Sikasso to Kayes”
FSDUganda. 2018. ‘Finscope - UGANDA - Topline Findings Report’, Kampala: Financial Sector Deepening Uganda (fsduganda)
Green, M. 2019. Scripting development through formalization: Accounting for the diffusion of village savings and loans associations in tanzania. Journal of the Royal Anthropological Institute, 25(1). pp.103-122
Gugerty, M. 2007. you can’t save alone: Commitment in rotating savings and credit associations in kenya. Economic Development and Cultural Change, 55(2). pp.251- Guido Schwerdt and Ludger Woessmann. 2020. Chapter 1 - Empirical methods in the 282
economics of education, Editor(s): Steve Bradley, Colin Green, The Economics of Education (Second Edition), Academic Press. pp.3-20
Haldar, A., & Stiglitz, J. E. 2014. The indian microfinance crisis: The role of social capital,
the shift to for-profit lending and implications for microfinance theory and practice.
Newyork, Ny: Columbia University
Hannig, A., & S. Jansen. 2010. Financial Inclusion and Financial Stability: Current Policy Issues. ADBI Working Paper 259. Tokyo: Asian Development Bank Institute
Havnevik, K.J. 2015. A case study of a Village Saving and Loan Association and its relation to poverty reduction among rural households in Kyabakara, Uganda By BUSINGyE KAMPEMUKA SCHOLA SUPERVISOR
Heckman, J., H. Ichimura and P. Todd. 1997. “Matching as An Econometric Evaluation Estimator: Evidence From Evaluating A Job Training Programme,” Review of Economic Studies 65. pp.605-654
Hendricks, L., & Chidiac, S. 2011. Village savings and loans: A pathway to financial inclusion for Africa’s poorest households. Enterprise Development and Microfinance, 22(2). pp.134-146
International Monetary Fund. 2015. “Financial Inclusion: Can It Meet Multiple Macroeconomic Goals?” IMF Staff Discussion Note 15/17, International Monetary Fund, Washington, DC
Jain, B. 2011. Two crises of indian microfinance: Why are they disconnected? University of Delhi
James, D. 2015. ‘Women use their strength in the house’: savings clubs in an Mpumalanga village. Journal of Southern African Studies 41. pp.1035‐52
Johnson, S., Malkamäki, Markku; & Niño-Zarazua, Max. 2010. “The role of informal groups in financial markets: Evidence from Kenya.”
Johnson S. & Sharma N. 2004. ‘Institutionalizing suspicion’: the management and governance challenge in user‐owned microfinance groups. In What’s Wrong with Microfinance, Harper D, Malcolm T. Practical Action Publishing: Rugby. pp.61-72 Karlan, D., Savonitto, B., Thuysbaert, B., & Udry, C. 2017. Impact of savings groups on
the lives of the poor. Proceedings of the National Academy of Sciences of the United States of America, 114(12)
Kibe, E.M. 2019. Microfinance Credit Access, Utilization And Effects Among Male Entrepreneurs
Ksoll, C., Lilleør, H. B., Lønborg, J. H., & Rasmussen, O. D. 2016. Impact of village savings and loan associations: Evidence from a cluster randomized trial. Journal of Development Economics, 120. pp.70-85
Lee, S. H., Kwon, G. S. and Nargis, F. 2012. Evaluating the Success Factors of Microfinance:
A Case Study of Grameen Bank. APJBVE, 7(3). pp.65-73
Le Polain, M., Sterck, O., & Nyssens, M. 2018. Interest rates in savings groups: Thrift or threat? World Development, 101. pp.162-172
Littlefield, E., Morduch, J., & Hashemi, S. 2003. Is microfinance an effective strategy to reach the millennium development goals? Focus Note, 24(2003). pp.1-11
Lønborg, J. H., & Rasmussen, O. D. 2014. Can microfinance reach the poorest: Evidence from a community-managed microfinance intervention. World Development, 64.
pp.460-472
Maliti, E. 2017. Deviation of community savings groups from their apparent methodology.
International Journal of Social Economics, 44(3). pp.326-336
Massu, M., Michaud, L., & Jain, A. 2017. Comparative evaluation on community-managed savings-led approaches in the Mekong
Matthews, Brett; Musoke, C.; and C. Green. 2010. “Group Savings and Loan Associations:
Impact Study.” Financial Sector Deepening: Kenya
Montesquiou, A., and T. Sheldon. 2014. “From Extreme Poverty to Sustainable Livelihoods.”
Technical Guide. Washington, D.C.: CGAP, September
Morduch, J. 1999. The microfinance promise. Journal of Economic Literature. 37(4).
pp.1569-1614
Mule, N., Johnson, S., Hickson, R. and Mwangi, W. 2001. “Innovative approaches to delivering microfinance services: the managed ASCA model in Kenya”
Musinguzi, L. K. 2016. The role of social networks in savings groups: Insights from village savings and loan associations in luwero, uganda. Community Development Journal, 51(4). pp. 499-516
Mutesasira, L., Henry S., David H., Stuart R., and Graham A. N. Wright. 1999. “Use and Impact of Savings Services Among the Poor in Uganda.” Kampala, Uganda:
MicroSave-Africa
Mwansakilwa, C., Tembo, G., Zulu, M. M., & Wamulume, M. 2017. Village savings and loan associations and household welfare: Evidence from eastern and western zambia.
African Journal of Agricultural and Resource Economics-Afjare, 12(1). pp.85-98 Nolan, Anne, 2008. “Evaluating the impact of eligibility for free care on the use of general
practitioner (GP) services: A difference-in-difference matching approach,” Social Science & Medicine, Elsevier, vol. 67(7). pp.1164-1172
Rachel C. & Marcel F. 2020. Banker my neighbour: Matching and financial intermediation in savings groups. Journal of Development Economics, 145, 102460
Rasmussen, O. D. 2013. Impact of village savings and loans associations: Evidence from a cluster randomized trial Rockwool Foundation Research Unit
Robinson, F. 2015. Financial services for family farmers. Appropriate Technology, 42(1), 45 Saxena, S. 2014. The 2010 microfinance crisis in andhra pradesh, india and its implications
for microfinance in india. Reconsidering Development, 3(1)
Seibel, H.D. 2017. Financial Services in Karamoja: A Rapid Review. Karamoja Resilience Support Unit, USAID/Uganda, Kampala
Singer, Jennifer. (n.d). Board Briefing Note: Backgrounder on VSLAs. Toronto, Canada: The Mastercard Foundation
Steinert, J. I., Zenker, J., Filipiak, U., Movsisyan, A., Cluver, L. D., & Shenderovich, y.
2018. Do saving promotion interventions increase household savings, consumption, and investments in sub-saharan africa? A systematic review and meta-analysis. World Development, 104. pp.238-256
Stock, J. H., and M. W. Watson. 2011. Introduction to Econometrics. Boston
Suresh C. Babu, Shailendra N. Gajanan, J. Arne Hallam. 2017. Chapter 11 - Methods of Program Evaluation: An Analytical Review and Implementation Strategies. Academic Press. pp.205-230
Surmont, T. 2017. Analyzing Village Savings and Loans Associations through the Sustainable Livelihoods Approach: a Case Study in Kabarole District
TANGO International. 2013. Review of CARE Myanmar Village SAving and Loan Associations
UBOS 2021. Uganda Bureau of Statistics Statistical Abstract 2020 report. Kampala. Uganda;
Uganda Bureau of Statistics. 2017. The National Population and Housing Census 2014 – UBOS Area Specific Profile Series, Kampala, Uganda
Van Kien, N. &. 2012. Banking on Change: Vietnam Final Impact Evaluation Report
Winger, D., & Nason, K. 2016. Propensity-score analysis in thoracic surgery: When, why, and an introduction to how. The Journal of thoracic and cardiovascular surgery, 151 6, 1484-7
Wooldridge, J. 2008. Introductory Econometrics: A Modern Approach. South Western College
World Bank. 2010. Handbook on Impact Evaluation
World Bank. 2017. The Global Findex Database 2017. World Bank Group, Washington, DC.
Retrieved from https://globalfindex.worldbank.org
Sung Ho Kim, Ph.D. Candidate, Graduate School of Pan-Pacific International Studies, Kyung Hee University, E-mail: [email protected]
(Corresponding Author) Jae Sung Kwak, Professor, Graduate School of Pan-Pacific International Studies, Kyung Hee University, E-mail: [email protected]