저작자표시-비영리-변경금지 2.0 대한민국 이용자는 아래의 조건을 따르는 경우에 한하여 자유롭게
l 이 저작물을 복제, 배포, 전송, 전시, 공연 및 방송할 수 있습니다. 다음과 같은 조건을 따라야 합니다:
l 귀하는, 이 저작물의 재이용이나 배포의 경우, 이 저작물에 적용된 이용허락조건 을 명확하게 나타내어야 합니다.
l 저작권자로부터 별도의 허가를 받으면 이러한 조건들은 적용되지 않습니다.
저작권법에 따른 이용자의 권리는 위의 내용에 의하여 영향을 받지 않습니다. 이것은 이용허락규약(Legal Code)을 이해하기 쉽게 요약한 것입니다.
Disclaimer
저작자표시. 귀하는 원저작자를 표시하여야 합니다.
비영리. 귀하는 이 저작물을 영리 목적으로 이용할 수 없습니다.
변경금지. 귀하는 이 저작물을 개작, 변형 또는 가공할 수 없습니다.
공학석사 학위논문
Deformation Behavior of Mg-Nd Single Crystals
마그네슘-네오디뮴 합금 단결정의 변형거동
2018년 2월
서울대학교 대학원 재료공학부
권 호
Deformation Behavior of Mg-Nd Single Crystals
지도교수 신 광 선
이 논문을 공학석사 학위논문으로 제출함 2018 년 2 월
서울대학교 대학원 재료공학부
권 호
권 호 의 석사 학위논문을 인준함 2018년 2월
위 원 장 박 은 수 (인)
부위원장 신 광 선 ( 인 )
위 원 정 인 호 ( 인 )
I
Abstract
Deformation Behavior of Mg-Nd Single Crystals
Kwon, Ho School of Materials Science and Engineering The Graduate School Seoul National University
Magnesium has been spotlighted in recent years as a light weight structural material due to its outstanding physical properties such as low density, high specific strength, excellent damping resistance and great castability. In light of the increasing demands on environmentally friendly technology, the automotive industry in particular, focuses on magnesium as a structural material to reduce weight and improve fuel efficiency. However, due to its close-packed hexagonal crystal structure and limited slip systems at room temperature, the plastic formability of magnesium still needs to be improved in order to meet the industry requirement. Experiments often improve the formability of magnesium alloys by texture modification, addition of alloying elements, grain refinement and additional processing such as extrusion or rolling. Therefore, research of the plastic deformation process of magnesium alloys is important to improve the mechanical properties and formability.
II
In this study, deformation behavior of magnesium-neodymium single crystal was examined through tensile and compression tests at various temperatures at an initial strain rate of 1x10⁻⁴/s along the [1 0 -1 0] direction of the single crystal specimen for the activation of non-basal slip system. In addition, compression tests along the [0 0 0 1] direction were performed at different temperatures for the activation of <c+a> slip and compression twin.
Visco-plastic self-consistant (VPSC) simulations were carried out with the results obtained from both tensile and compression tests in order to obtain critical resolved shear stress (CRSS) values of six deformation modes. In addition, the activities of six deformation modes of magnesium-neodymium (Mg-Nd) single crystal were compared with those of pure magnesium single crystals.
The microstructures were analyzed via optical microscope (OM), scanning electron microscope (SEM), X-ray diffraction (XRD), electron backscattered diffraction (EBSD). The results could be summarized as follows:
For the orientation A (loading direction parallel to [91 -123 33 0]) tensile test, the flow stress and the yield strength were strongly dependent on the testing temperature. The yield strength and strain hardening rates showed positive trend with Nd concentration. The slip traces inclined by 45o were observed in tensile specimens above 493K. This indicates that prismatic <a> slip was the only deformation mode which activated in the A orientation.
From orientation B (loading direction parallel to [1 0 -1 0]) tensile test, multiple deformation modes were activated during the plastic deformation. The YS subsequently decreased with increased testing temperature. The prismatic <a> slip traces inclined by 60o were observed at high temperatures above 573K, which indicated prismatic <a> slip successfully activated at the elevated temperature. As the testing temperature increased, the width of slip traces increased and the number of
III
those were also increased. The negligible amounts of other non-basal slip traces were also detected on (1 1 -2 0) plane of tensile specimen in the temperature range between 533K and 573K. In orientation B compression tests, the volume fraction of tensile twins was increased as with Nd concentration. As the temperature increased the number of twin decreased with enlarged width due to the effect of testing temperature on nucleation and growth on tensile twin. The activation of tensile twin was negative to Nd concentration and extended temperature.
In orientation C (loading direction parallel to [0 0 0 1]) compression tests, the YS and strain hardening rate showed negative trend with Nd concentration in the range between 0 to 0.04 at.% even at the room temperature. Few pyramidal <c+a> II slip traces and compression twin traces were observed on pure Mg, without any pyramidal <c+a> I slip traces. At the Mg-Nd tests, plenty of pyramidal <c+a> I slip traces were observed in Mg-Nd. The solid solution softening with decreased strain hardening rate was attributed to the activation of pyramidal <c+a> I slip in Mg-Nd alloy. The improved ductility of Mg-Nd alloys was explained via activation of non- basal slip during the plastic deformation.
The CRSS value of the six deformation modes on pure Mg and Mg-Nd single crystals have been systematically calculated via VPSC. In Mg-Nd alloys, it is expected that the non-basal/Basal CRSS ratio is significant reduced by strengthening of the basal slip CRSS from 298K to 533K. However, the reducing rate of pyramidal
<c+a> I & II CRSS by increasing temperature was comparatively lower than that of basal slip which made sudden increase of CRSS ratio above 573K. Mg-Nd alloys thus successfully decreased Non-basal/Basal CRSS ratio in the range from 298K to 533K which could active the non-basal slip easily when compared to pure Mg.
IV
Keywords: Magnesium, Neodymium, Single Crystal, Deformation Modes, Mechanical Property, Non-Basal Slip, VPSC
Student Number: 2017-25461
V
Contents
Chapter 1. Introduction
1.1 Effect of rare earth elements in Mg alloys ……...2 1.2 Single crystal and Schmid factor criterion …….…3 1.3 Deformation behavior of Mg alloys ...……….…..4 1.4 Research Objectives ...………...…………6
Chapter 2. Experimental procedure
2.1 Characterization of single crystals ...…...……...8 2.2 Mechanical property ...…….………...…...9 2.3 Microstructure and texture developments ……...11 2.4 Simulation ...……….…………...……12
Chapter 3. Results and discussion
3.1 Effects of orientation and temperature on
deformation behavior of Mg alloy single crystals .13
VI
3.1.1 Introduction ...……….………..13
3.1.2 Orientation A ...……….…………14
3.1.3 Orientation B ...……….……21
3.1.4 Orientation C ...……….………36
3.2 CRSS and activity via VPSC-GA ...……….45
3.2.1 Introduction ...……….……..45
3.2.2 Critical resolved shear stress………...…..……46
3.2.3 Activity ...61
3.3 CRSS ratio in Mg-Nd system ……….…….69
3.3.1 Introduction ...………..………….69
3.3.2 Effects of Nd and temperature on deformation behavior in Mg ……....……….69
Chapter 4. Conclusion ………...………...………74
VII
List of Tables
Table 3.1.1 Schmid factors of each deformation modes for 3 different orientations ...14 Table 3.1.2 Tensile properties of Orientation A ….…………..18 Table 3.1.3 Tensile and compressive properties of Orientation B;
a) tension, b) compression ...26
Table 3.1.4 Quantification of twin fraction after 2% strain
compression tests as a function of concentration and
temperature .………...35
Table 3.1.5 Compressive properties of Orientation C .…....….39
Table 3.2.1 Calculated CRSS of each deformation modes via
VPSC-GA .………....…………..………...52
Table 3.3.1 CRSS ratio of Mg-xNd single crystals ………….71
VIII
List of figures
Figure 1.1 Schematic diagram of relationship between the shearing stress and the force applied on single
crystal ....……….….3 Figure 1.2 Possible deformation modes in HCP Mg ...4 Figure 2.1 Dimensions of successfully casted Mg-Nd alloy
single crystal ………...8 Figure 2.2 Design for tensile test jig ….……….10 Figure 3.1.1 (0 0 0 2) and (1 0 -1 0) pole figures according to
direction in Orientation A ...………..…..15 Figure 3.1.2 Flow stress curves of Orientation A tension;
a) pure Mg, b) 0.02 Nd c) 0.04 Nd, d) 0.06 Nd ...16 Figure 3.1.3 Relationship between YS and Nd concentration of
Orientation A as a function of temperature …...19 Figure 3.1.4 Microstructures on the (0 0 0 1) plane of A
orientation specimen after tensile test at various temperatures .…...………..20 Figure 3.1.5 Flow stress curves of Orientation B tension;
a) pure Mg, b) 0.02 Nd c) 0.04 Nd, d) 0.06 Nd ...22
Figure 3.1.6 Flow stress curves of Orientation B compression;
IX
a) pure Mg, b) 0.02 Nd c) 0.04 Nd, d) 0.06 Nd ...24 Figure 3.1.7 Relationship between YS and Nd concentration of
Orientation B as a function of temperature;
a) tension, b) compression ...28 Figure 3.1.8 Possible traces of each deformation modes in HCP
Mg loaded along [1 0 -1 0]...29 Figure 3.1.9 Microstructures on the (0 0 0 1) plane of B
orientation specimen after tensile test at various temperatures …...……...30 Figure 3.1.10 Tensile twin activated on (0 0 0 1) plane of Mg-Nd
single crystal compression specimen at 2% strain, 298K.………..…....32 Figure 3.1.11 IPF images of (0 0 0 1) plane after compression
test; a) 298K, 10% strain, b) 733K, 25% strain….33 Figure 3.1.12 Microstructures on (0 0 0 1) plane of compression
specimen with 2% strain at various temperatures;
a) 298K, b) 493K, c) 693K……….34 Figure 3.1.13 Flow stress curves of Orientation C compression;
a) pure Mg, b) 0.02 Nd c) 0.04 Nd, d) 0.06 Nd…..37 Figure 3.1.14 Relationship between YS and Nd concentration of
Orientation A as a function of temperature.…...40
X
Figure 3.1.15 Possible traces of each deformation modes in HCP Mg loaded along [0 0 0 1].…...42 Figure 3.1.16 Microstructures on (1 0 -1 0) and (1 1 -2 0) planes
of compression specimen until fracture at 298K.…...43 Figure 3.2.1 Experimental and simulated stress-strain curves of
three orientations;
a) Mg, b) 0.02Nd, c) 0.04Nd, d)0.06Nd………....….48 Figure 3.2.2 Calculated CRSS values of each deformation modes;
a) pure Mg, b) 0.02Nd, c) 0.04 Nd, d) 0.06 Nd.…….50 Figure 3.2.3 Effect of test temperature on each deformation modes as
a function of concentration; a) basal <a>, b) prismatic
<a>, c) pyramidal <c+a> I, d) pyramidal <c+a> II, e) tensile twin, f) compression twin………...54 Figure 3.2.4 Effect of Nd concentration on each deformation modes as a function of temperature; a) basal <a>, b) prismatic
<a>, c) pyramidal <c+a> I, d) pyramidal <c+a> II, e) tensile twin, f) compression twin………57 Figure 3.2.5 CRSS Deviation of prismatic <a> slip between
experiment and simulation...60 Figure 3.2.6 Activity of each deformation modes on B
orientation tension;
XI
a) pure Mg, b) 0.02 Nd, c) 0.04 Nd, d) 0.06 Nd…63 Figure 3.2.7 Activity of each deformation modes on B
orientation compression; a) pure Mg, b) 0.02 Nd, c) 0.04 Nd, d) 0.06 Nd...65 Figure 3.2.8 Activity of each deformation modes on C
orientation compression; a) pure Mg, b) 0.02 Nd, c) 0.04 Nd, d) 0.06 Nd...67 Figure 3.3.1 CRSS ratio of Mg-xNd single crystals as a function
of concentration...73
1
Chapter 1. Introduction
The rapid development of industry is usually accompanied with the severe pollution. During the century, remarkable progress in industrial and scientific fields cause serious air pollution and waste of natural resources with emitting massive carbon dioxides. The specific industries such as automotive and aerospace needed to focus on the reduction of carbon dioxides by improving fuel efficiency. In light of the increasing demands on environmentally friendly technology, the automotive industry in particular, focuses on magnesium as a structural material to reduce weight and improve fuel efficiency. The demand for light weight material is highly recommended due to the reduction of environmental pollution and source conservation.
Magnesium has been spotlighted in recent years as a light weight structural material due to its outstanding physical properties such as low density, high specific strength, excellent damping resistance and great castability.
Recently, magnesium alloys such as AZ31, AZ61 and AZ91 have been widely used and research groups from many different countries have been trying to modify the plasticity [3, 5, 13, 20]. However, due to its original close-packed hexagonal crystal structure and strong basal texture with limited slip systems at room temperature, the plastic formability of magnesium still needs to be improved in order to meet the industry requirement. Experiments often improve the formability of magnesium alloys by texture modification, addition of alloying elements, grain refinement and additional processing such as extrusion or rolling [9, 11, 13, 32].
Therefore, research of the plastic deformation process of magnesium alloys is important to improve the mechanical properties and formability.
2
1.1 Effect of rare earth elements in Mg alloys
In order to overcome the poor plasticity and strength of Mg as a structure material, addition of alloying elements can improve the mechanical properties.
Predominant combination of the composition is usually based on the mixture of Al, Zn, Ca and RE, usually Mg industry used Yttrium [32, 36, 37]. The widely known effects of the rare earth elements are grain refinements through the precipitation, improved high temperature properties, improved corrosion resistance and weakening the strong basal textures. Usually addition of small amounts of alloying elements cause solid solution hardening in most casted alloys. However, according to Z. Wu et al., under the specific condition, addition of small amounts of RE ranging from 0.03 to 1.0 at.% could cause solid solution softening by the cross slip activation of <c+a>
dislocation rather than dislocation dissociation during the plastic deformation, which leaded to the decrease of the yield strength and strain hardening rate but the increase of the elongation [19, 23]. Also, addition of RE highly increases room temperature plasticity and activates <c+a> type slip with reduced stacking fault energy and c/a value reported by S. Sandlöbes et al [13].
All the references that mentioned above were carried out with poly crystal specimen and the grain boundaries could directly affected to the deformation in poly crystal specimen. W. B. Hutchinson et al. have reported the CRSS of each deformation modes in Mg were different between poly crystal and single crystal because the grain boundaries block slip bands, creating back stresses [5]. Therefore, it is necessary to distinguish the main deformation mode which cause the solid solution softening by single crystal specimen without any grain boundary.
3
1.2 Single crystal and Schmid factor criterion
The Schmid factor is a geometric relationship between each deformation mode and loading direction. The relationship between the angle and slip plane are shown in Figure 1.1. σ is defined as the normal stress where slip or twin is first detected. And define ø as the angle between the normal direction of slip or twin plane and loading direction; λ is the angle between slip direction on the slip or twin plane and loading direction. From this relationship Schmid factor (SF) and critical resolved shear stress (CRSS) were defined as follows:
SF = cos ø ᆞ cos λ ; τc = τy ᆞ cos ø ᆞ cos λ
Figure 1.1 Schematic diagram of relationship between the shearing stress and the force applied on single crystal.
It is well kwon that the deformation mechanisms of Mg single crystals are highly orientation-dependent due to the strong anisotropic nature of the single crystal [30].
Hence the absence of grain boundaries on single crystal specimen minimized the obstruction to slip [28]. Under crystallographic orientation condition, in each crystal the extensive glide occurs when the resolved shear stress reaches to critical value,
4
CRSS. This indicates that the mechanical testing with single crystal is a great approach to obtain theoretical information about deformation behavior of Mg.
1.3 Deformation behavior of Mg alloys
Ideally, the six independent deformation modes can be activated in Mg and Mg alloys including the four slips and the two twins. Each deformation system illustrated in Figure 1.2.
Figure 1.2 Possible deformation modes in HCP Mg. [38]
The slip mechanism of Mg and Mg alloys is mainly determined by the crystallographic orientation and Schmid factor criterion. The basal slip and the tensile twin are the two major deformation modes of commercial Mg and its alloys due to
5
the strong basal texture and the lowest critical resolved shear stress (CRSS). From the literature, the tensile twin evolution greatly affected to the final texture because it crystallographically rotated about 86o from the initial orientation [31, 33].
Furthermore, the tensile twin was one of the easiest deformation modes which could activated in Mg because of its sufficiently low CRSS [31, 33]. In addition, the recrystallization of subgrain via dynamic recrystallization (DRX) was nucleated from the specific compression twins. The ideal texture for good formability was determined by the combination of deformed texture and recrystallized texture.
However, the limited activation of deformation modes lead to low plasticity of Mg and its alloys at room temperature. Recently researchers focus on the activation of other non-basal deformation modes accompanied with c-axis deformation [4, 6, 14].
The <c+a> dislocation comprised with <a> vector and <c> vector, which induced c-axis deformation. The activation of <c+a> slip is rarely occurs at room temperature because of the high CRSS compared with other deformation modes. Also Z. Wu and S. Sandlöbes et al. reported <c+a> dislocations were dissociated into <a>
and <c> dislocations during the deformation, since <c> dislocations were sessile dislocation, dissociation of the dislocations could lead to sudden fracture at an early stage during the mechanical testing [16, 19]. For increasing the plasticity of Mg, weakening the basal texture and activating the non-basal slip is the most promising.
The alloying elements addition to Mg would induced solid solution hardening.
A. Tehranchi et al. reported solute atoms could strengthening the CRSS of basal slip [18]. Strengthening of the basal slip could enhance formability of Mg and its alloys by reducing the ratio of the other deformation modes to basal CRSS (CRSS ratio) which is able to activate the other deformation modes [5].
6
1.4 Research Objectives
Magnesium is a light weight structural material that has prospective application especially on the automotive industry by improving the fuel efficiency and ultimately reducing the CO2 emissions. Even though Mg is a high specific strength material, the formability of wrought Mg and its alloys is still low at room temperature due to its intrinsic HCP structure which induces crystallographic anisotropy and strong basal texture caused by limited number of the deformation modes.
Currently, significant researches has been reported the addition of RE in Mg enhanced the formability at RT through weakening the basal texture. However, the mechanistic origin is still not clear and development of new Mg-RE alloys is quite empirical [19]. As one of the RE elements, Nd not only refined the grain size, but also dramatically decreased the stacking fault energies to activate the pyramidal <c+a>
slips [13, 34]. Therefore, research of the plastic deformation process of Mg-Nd alloys is important to improve the mechanical properties and design new alloy concept.
In this study, deformation behavior of magnesium-neodymium single crystal was examined through tensile and compression tests at various temperatures at an initial strain rate of 1x10⁻⁴/sec along the [1 0 -1 0] direction of the single crystal specimen for the activation of non-basal slip system. In addition, compression tests along the [0 0 0 1] direction were performed at different temperatures for the activation of <c+a> slip and compression twin.
VPSC (visco-plastic self-consistant) simulations were carried out with the results obtained from both tensile and compression tests in order to obtain CRSS (critical resolved shear stress) values of six deformation modes. In addition, the
7
activities of six deformation modes of magnesium-neodymium single crystal were compared with those of pure magnesium single crystals.
This research provided experimental and theoretical basis on improving mechanical properties through investigating the intrinsic properties of Mg-Nd alloy.
The details are as follows:
1. Casting sound pure Mg and Mg alloy single crystals by Bridgman method, and determining its crystallographic orientation and composition.
2. Manufacturing the tensile and compressive specimens with specific crystallographic orientation from single crystals via EDM, the mechanical properties were tested along different orientations. The differences of mechanical properties were examined, and the microstructures of each specimens were observed after deformation.
3. Backscattered electron diffraction analysis was performed to analyze the effect alloying elements and temperature with different orientation on the mechanical properties and microstructure of the material. The relationship between orientation and deformation behavior of alloys was investigated as a function of temperature.
4. VPSC simulation was operated to calculate the CRSS values and activities of each deformation mode, and further calculate the CRSS Ratio, to define the improved ductility of Mg alloy.
8
Chapter 2. Experimental procedure
2.1 Characterization of single crystals
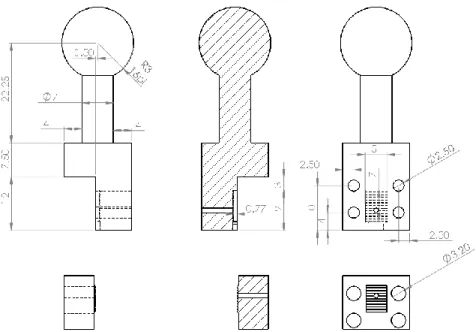
Binary solid solution alloy single crystals of magnesium-neodymium were first prepared by Bridgman method. The four concentrations were decided below the maximum solubility of Nd in Mg; 0, 0.02, 0.04 and 0.06 at.%. A gravity casted Mg- xNd (x=0, 0.02, 0.04, 0.06 at.%) was melted at 780oC in the graphite mold and slowly cooled at the speed of 1.45 mm/hr under the Ar atmosphere. The single crystals were successfully casted as shown in Figure 2.1.
Figure 2.1 Dimensions of successfully casted Mg-Nd alloy single crystal.
The casted alloy single crystal bar were then polished by sand paper up to # 2000 before chemically etched in a solution containing HNO3 and distilled water. The crystallographic orientation of each casted single crystals was determined by Laue X- ray back diffraction method. The stereographic projection of each plane was rotated to the desired plane and direction by OrientExpress 3.4.
Tensile and Compression samples were prepared via electrical discharge
9
machining (EDM) with each three desired crystallographic orientation. The tensile specimen was cut from the as casted alloy single crystal in the form of rectangular cross section with 3 mm x 2 mm and 12 mm gauge length. Compression specimens were prepared by the same procedure with tensile specimens, with cross section of 4 mm x 4 mm and 6 mm gauge length. The specimens were mechanically polished with silicon carbide (Sic) paper, 0.3 um and 0.05 um alumina powder. The specimens were then homogenized for 4 hours at 510oC in CO2 atmosphere to eliminate the residual stress and subsequent dislocations during the sample preparation. After homogenization, surface oxide layer was removed in a 2:1 mixture of CH3OH and HNO3.
2.2 mechanical property
Tensile and Compression tests were performed to evaluate mechanical behaviors of Mg-xNd alloy single crystal under the strain rate of 1 x 10⁻⁴/s at ten different temperatures of 298 K, 413 K, 453 K, 493 K, 533 K, 573 K, 613 K, 653 K, 693 K and 733 K. Since single crystal tensile specimens were easy to be deformed and the size was small compared with conventional poly crystal specimens, new designed jig with special gripping system was used during the tensile test. (Figure 2.2)
10
Figure 2.2 Design for tensile test jig.
11
2.3 microstructure and texture developments
The microstructure after tensile and compression tests was examined by optical microscopy. Tensile specimens for the microstructure observation were mechanically polished with # 4000 sandpapers and 0.3, 0.05um alumina powder before chemically etched in a 2:1 solution of CH3OH and HNO3. Compression samples were chemical etched in a mixed etchant of acetic and picric acid (4.2 g picric acid, 10 ml acetic acid, 10 ml H2O, and 70 ml ethyl alcohol) after compression test to identify the tensile twin fraction. More intensively, electron backscatter diffraction (EBSD) analysis was performed for the examination of tensile twin evolution after compressive deformation. The sample for EBSD analysis prepared via electrolytic polishing and ion milling.
12
2.4 Simulation
Simulation of deformation behavior and texture has been considered as a powerful tool to investigate deformation mechanisms and texture formation.
Deformation simulations were carried out with the collected data from tensile and compression tests at different temperatures in order to calculate CRSS values of the entire deformation modes via viscoplastic self-consistent (VPSC) implemented into a genetic optimization algorithm (GA) theory. The VPSC simulation in order to predict the contribution of each deformation modes originally used for analyzing the deformation of polycrystalline [5]. In this research, VPSC simulation was used as a simulation for analyzing of single crystal deformation with different orientations. The calculations have included {0001} <11-20>, {10-10} <11-20>, {10-11} <11-23>, {11-22} <11-23> slip and {10-12} <10-11> and {10-11} <10-12> twin modes [1, 35].
13
Chapter 3. Results and discussion
3.1 Effects of orientation and temperature on deformation behavior of Mg alloy single crystals
3.1.1 Introduction
The low formability due to limited number of deformation modes was the main drawback of the Mg as the structure material. However, new alloy design with RE has been an alternative method to improve formability at room temperature, which sufficiently increasing the CRSS of basal slip and activating other deformation modes.
During the half century, researchers has been reported alloy single crystals with small amounts of alloying elements such as Al, Zn, Zr and RE increase the yield strength and the basal slip CRSS [1, 11, 18]. On the other hand, Z. Wu, S. Sandlöbes and A.
Kula mentioned the YS on the poly crystalline including small amounts of RE such as Y, Nd, Er, Ho, Tb, Dy under 3 at.% via rolling and extrusion had decreased, which caused solid solution softening of the YS by pyramidal <c+a> slip activation [9, 13, 15, 19, 32]. In this study, in order to investigate the influence of the RE on the deformation behavior especially the activation of pyramidal I & II <c+a> slip Mg-Nd alloys with 0, 0.02, 0.04, 0.06 at.% Nd single crystals, three specific orientations were chosen. The basic information of each orientations and schmid factors were shown in Table 3.1.1.
14
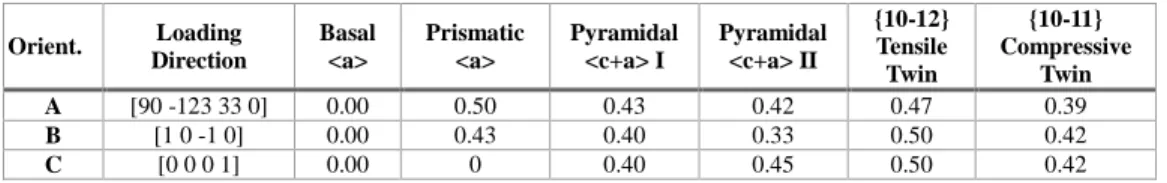
Table 3.1.1 Schmid factors of each deformation modes for 3 different orientations.
3.1.2 Orientation A
Orientation A is designed to activate only prismatic slip when the prismatic plane is inclined 45o to the loading direction which makes the SF of the prismatic slip is 0.5. The tensile tests were performed at ten different temperatures from 298K to 733K. Each tests were finished at 10% strain. The strain rate of each tests was 10- 4s-1. The schematic illustration of direction and texture was plotted in Figure 3.1.1.
Stress strain curves of Orientation A for each four concentrations was shown in Figure 3.1.2. The yield strength (YS), tensile strength (UTS) and CRSS were shown in Table 3.1.2. As the temperature increased, the YS and the UTS decreased.
The yield strength increased from 95.9 MPa at pure Mg and subsequently increased to 115.6 MPa at 0.06 at.% Nd. From the schmid factor criterion, addition of Nd showed solid solution hardening of the prismatic slip at A orientation. The CRSS values for the prismatic slip were decreased sharply with increasing temperature and showed strong temperature dependent behavior. At 298K, except pure Mg, the Nd added specimen showed less elongation and that decreased with the higher Nd concentration. The strain hardening rate of A orientation at 298K increased along with the concentration. However, above 413 K, the elongation tremendously increased as the CRSS of the prismatic slip was decreased enough to activate. Besides, the strain
Orient. Loading Direction
Basal
<a>
Prismatic
<a>
Pyramidal
<c+a> I
Pyramidal
<c+a> II
{10-12}
Tensile Twin
{10-11}
Compressive Twin
A [90 -123 33 0] 0.00 0.50 0.43 0.42 0.47 0.39
B [1 0 -1 0] 0.00 0.43 0.40 0.33 0.50 0.42
C [0 0 0 1] 0.00 0 0.40 0.45 0.50 0.42
15
hardening rate of A orientation above 413K decreased as the temperature increased.
This indicated that the Nd addition had a significant effect on the strain hardening of magnesium on orientation A, especially at lower temperature from 298K to 493K.
The relationship between the YS and Nd concentration is shown in the Table 3.1.2 and Fig. 3.1.3
Figure 3.1.1 (0 0 0 2) and (1 0 -1 0) pole figures according to direction in Orientation A.
16 a)
b)
17 c)
d)
Figure 3.1.2 Flow stress curves of Orientation A tension;
a) pure Mg [39], b) 0.02 Nd c) 0.04 Nd, d) 0.06 Nd
18
Table 3.1.2 Tensile properties of Orientation A.
19
Figure 3.1.3 Relationship between YS and Nd concentration of Orientation A as a function of temperature.
The deformed microstructures as well as the slip traces after tensile tests were observed via OM in Fig 3.1.4. Since the SF of prismatic slip is 0.5 on orientation A, only prismatic slip could be activated on the specimen surface with the angle of 45o.
The slip traces were hardly appeared from 298K to 493K. However, they obviously presented above 533K. This massive activation of prismatic slip over 533K is due to the significant decrease of the CRSS on prismatic slip. Thus the slip traces over 533K became much severe as the Nd concentration increasing.
300 400 500 600 700
0 50 100
Pure Mg 0.02 Nd 0.04 Nd 0.06 Nd
Stress (MPa)
Temperature (K)
20
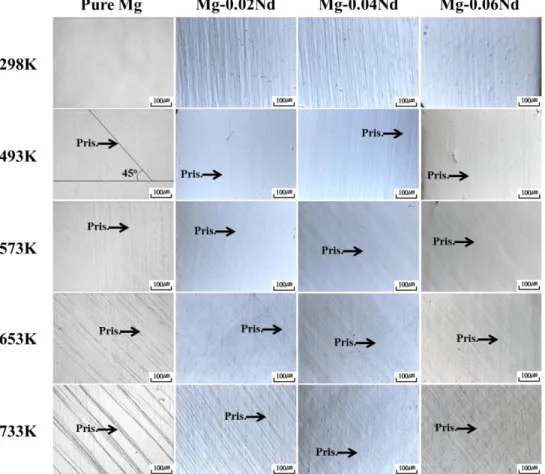
Figure 3.1.4 Microstructures on the (0 0 0 1) plane of A orientation specimen after tensile test at various temperatures.
21
3.1.3 Orientation B
Orientation B is used to activate the multiple slips which containing non-basal slips when loaded along [1 0 -1 0] direction. The SF values of each five deformation modes except basal slip and tensile twin were quite similar from 0.33 to 0.43.
Previous researchers already reported the TEM analysis for detecting the <c+a>
dislocations and the tensile twin when compressed perpendicular to c-axis. Also the texture simulations that were carried out by different authors revealed the activation of the <c+a> slip [30, 36, 37].
Both tensile and compression tests were conducted on B orientation. The flow stress of both tests decreased with increasing temperature and increased with increasing Nd concentration, as shown in Figure 3.1.5 and Figure 3.1.6. The strain to fracture increased at high temperatures in tensile tests, whereas it decreased in compression tests. The YS and UTS (UCS) of each concentrations as a function of temperature were plotted in Table 3.1.3.
From the tensile test strain stress curves, in the range between 298K and 533K, YS decreased compared with Pure Mg as increasing Nd concentration from 0.02 to 0.04 at.%. After 533K, the YS of Mg-Nd specimen was higher than the pure Mg. The elongation of B orientation tensile tests was greatly increased by small Nd addition in the range of 0.02 to 0.04 at.%. Besides, strain hardening rates decreased with increasing Nd concentration from 0.02 to 0.04 at.%. On the other hand, it always showed strengthening effect at 0.06 at.% Nd and strain hardening rates were increased when compared with the pure Mg. The relationship between the YS and Nd concentration was plotted below in Figure 3.1.7. Also the strain hardening rates of B orientation in entire concentration showed decreased tendency with increasing temperature.
22 a)
b)
23 c)
d)
Figure 3.1.5 Flow stress curves of Orientation B tension; a) pure Mg, b) 0.02 Nd c) 0.04 Nd, d) 0.06 Nd
24 a)
b)
25 c)
d)
Figure 3.1.6 Flow stress curves of Orientation B compression; a) pure Mg, b) 0.02 Nd c) 0.04 Nd, d) 0.06 Nd
26 a)
27 b)
Table 3.1.3 Tensile and compressive properties of Orientation B; a) tension, b) compression
28 a)
b)
Figure 3.1.7 Relationship between YS and Nd concentration of Orientation B as a function of temperature; a) tension, b) compression
29
Microstructures on (0001) and (10-10) plane after the tensile deformation until 10% strain was observed via OM (Figure 3.1.9). The possible slip traces of non-basal slip modes were displayed in Figure 3.1.8. No significant change was detected from 298K to 533K. But after 533K, massive slip traces with 60o angle were observed on (0001) plane of every composition. With same trend, massive 0o slip traces were detected on (10-10) plane of pure Mg specimens above 533K. However, few slip traces with 28o and 35o were additionally observed on (10-10) plane of Mg-xNd specimen. By the theoretical geometric prediction, those traces were originated from prismatic slip and pyramidal <c+a> I & II slips.
Figure 3.1.8 Possible traces of each deformation modes in HCP Mg loaded along [1 0 -1 0].
30
Figure 3.1.9 Microstructures on the (0 0 0 1) plane of B orientation specimen after tensile test at various temperatures.
31
In case of compression test, even though the reduction of YS is quite small, the YS decreased with increasing temperatures. The flow stress, especially UCS, decreased sharply with increasing test temperatures. From the early stages of the compression tests, mostly tensile twins were activated until 6% strain. More specific, the reduction of YS was quite small, which means the activation energy for the tensile twin was insensitive to the temperature. The YS and UCS of B orientation compression tests, always showed strengthening tendency with increased Nd concentration.
In order to identify the effect of Nd on activation of tensile twinning during the compression tests, the microstructures at 2% strain were observed via EBSD and OM.
By different crystallographic misorientation compared with matrix, twins were colored differently.
From the EBSD analysis, twins activated from the early stages of compression tests were tensile twin which had 86o misorientation with the matrix, as shown in Figure 3.1.10. The tensile twins only perpendicular to the compressive loading direction were observed, and no other angled tensile twin occurred. This indicated only the tensile twin with a maximum SF of 0.5, is operated. At the 298K, the texture of compression specimen was analyzed. At 10% strain, the entire (0 0 0 1) plane rotated into tensile twin as shown in Figure 3.1.11 a). Tensile twin activated in the range between 298K and 693K, however, at 733K, not a single tensile twin activated during the whole procedure even at 25% strain (Figure 3.1.11 b)).
The evolved Twin during the compression tests was colored with picric acid then observed via OM (Figure 3.1.12). Twin fractions as a function of concentration and temperature were calculated via ImageJ software and quantified in Table 3.1.4. As the temperature increased, the less twin activated which meant other deformation systems were more activated than tensile twin. In addition, tensile twin fraction after
32
compression tests at 2% strain decreased with increased Nd concentration. The number of tensile twin was much abundant at 298K. Whereas, as the temperature increased, the number of tensile twin was decreased and the width of tensile twin increased. Moreover, over 693K, No twin was observed. This phenomenon could be explained by nucleation & growth mechanism. Nucleation of twin greatly activated at the high temperature, and growth vice versa.
Figure 3.1.10 Tensile twin activated on (0 0 0 1) plane of Mg-Nd single crystal compression specimen at 2% strain, 298K.
33
Figure 3.1.11 IPF images of (0 0 0 1) plane after compression test;
a) 298K, 10% strain, b) 733K, 25% strain
34 a)
b)
35 c)
Figure 3.1.12 Microstructures on (0 0 0 1) plane of compression specimen with 2% strain at various temperatures; a) 298K, b) 493K, c) 693K
Table 3.1.4 Quantification of twin fraction after 2% strain compression tests as a function of concentration and temperature.
Pure Mg Mg-0.02Nd Mg-0.04Nd Mg-0.06Nd
298 K
Tensile Twin (%) 41.43 37.60 22.13 20.37
Matrix (%) 58.57 62.40 77.87 79.63
493 K
Tensile Twin (%) 40.36 34.72 21.80 20.01
Matrix (%) 59.64 65.28 78.20 79.91
693 K
Tensile Twin (%) 27.27 26.81 20.29 17.14
Matrix (%) 72.73 73.19 79.71 82.86
36
3.1.4 Orientation C
In order to activate the <c+a> pyramidal I & II slip, and compression twin, orientation C compression tests were performed which loaded along [0 0 0 1]
direction (Figure 3.1.13). Many researchers in the world have been reported the deformation behavior about this C orientation on pure Mg, Mg-Zn, Mg-Al and Mg- Y single crystals especially for the recrystallization [6, 29]. Also, the CRSS from previous reports were not systematically calculated but followed traditional schmid factor criterion even at the multiple slip system [4, 8, 10]. Since the VPSC only could simulate the hardening range of the mechanical tests, the compression tests were only conducted until the sudden drop of flow stress. The strain to fracture decreased with increasing temperatures, especially YS did not change drastically until 493K.
The YS and UCS of C orientation were plotted in Table3.1.5. Both YS and UCS of compression tests were decreased with increasing temperature. The YS dropped slightly from 298K to 493K, but above 533K it rapidly decreased. From 298K to 453K, mechanical deformation of each different composition was accompanied with plastic deformation followed by elastic deformation. As the temperature increased, the less plastic deformation region was detected. Especially above 573K, there was only elastic region without strain hardening. The disappearance of strain hardening region was due to the activation of the compression twin and subsequent double twin, which had sufficiently decreased CRSS at high temperatures.
The notable phenomenon was the YS drop in 0.02, 0.04 at.% Nd C orientation compression specimens compared with those of pure Mg in the temperature range from 298K to 533K. The YS decreased as the Nd concentration increased to 0.04 at.%, however, it suddenly increased at the 0.06 at.% Nd. The activation of pyramical
<c+a> I and II slip was predicted from the decreased YS and increased elongation at
37 0.02, 0.04 at.% Nd specimen.
a)
b)
38 c)
d)
Figure 3.1.13 Flow stress curves of Orientation C compression;
a) pure Mg, b) 0.02 Nd c) 0.04 Nd, d) 0.06 Nd
39
Table 3.1.5 Compressive properties of Orientation C.
40
Figure 3.1.14 Relationship between YS and Nd concentration of Orientation A as a function of temperature.
41
The compression tests of each concentration were conducted at 298K, 493K and 693K until the sudden drop of flow stress. The possible deformation traces during the compression tests loaded long [0001] direction and the microstructure of C orientation after compression test were shown in Figure 3.1.15 and Figure 3.1.16, respectively. Little basal slip traces and tensile twin were observed on the surface of compression specimens even though the error angle was less than 1o. The CRSS of basal slip and tensile twin were investigated considerably low to be activated even at the small error angle from the previous experiments.
From pure Mg deformed specimen at 298K, only 55o pyramidal <c+a> II slip and severe 60o compression twin were detected on (11-20) plane. However, in 0.04 at.% Nd deformed specimen, considerable 43o, 62o pyramidal <c+a> I slip traces were observed including 55o pyramidal <c+a> II slip and 60o compression twin on (11-20) plane. Also in 0.06 at.% Nd deformed specimen, less 43o, 62o pyramidal <c+a> I slip traces than 0.04 at.% Nd were observed with 55o pyramidal <c+a> II slip and 60o compression twin on (11-20) plane. This indicated the dilute Nd concentration under 0.06 at.% in pure Mg greatly increased the activity of pyramidal <c+a> I slip.
However, at high temperature, the slip traces of pyramidal <c+a> slip were decreased because of the shortage of strain hardening region. Mostly compression twins were activated at the strain to fracture. This was due to the CRSS of compression twin was sufficiently decreased to be activated. And more after the sudden decrease of flow stress, compression twins evolved into double twin and finally formed shear bands.
42
Figure 3.1.15 Possible traces of each deformation modes in HCP Mg loaded along [0 0 0 1].
43 a)
b)
44 c)
d)
Figure 3.1.16 Microstructures on (1 0 -1 0) and (1 1 -2 0) planes of compression specimen until fracture at 298K;a) pure Mg, b) 0.02 Nd, c) 0.04 Nd, d) 0.06 Nd
45
3.2 CRSS and activity via VPSC-GA
3.2.1 Introduction
Recently, the Schmid criterion for the multiple slip conditions has been questioned for the crystal plasticity modelling of Mg and its alloys. In order to solve this drawback and derive much accurate CRSS values in the multiple slip condition, computer simulations were carried out using the visco-plastic self-consistent (VPSC) theory [22]. The VPSC-GA simulations were carried out with the data from tensile and compression tests of multiple slip systems at different temperatures in order to calculate CRSS and activities of the entire deformation modes. The purpose of this research is to figure out what the major deformation mode is to activate the non-basal slip and solid solution softening in Mg-Nd single crystal.
46
3.2.2 Critical resolved shear stress
The present VPSC simulations were carried out for ten different temperatures to calculate the CRSS and activities of major deformation modes from B orientation tensile and B, C orientation compression data; the {0002} <11-20>basal slip, first- order {10-11} <11-23>pyramidal slip, second-order {11-22} <11-23>pyramidal slip, {10-12} <10-11> tensile twin and {10-11} <10-12> compressive twin. The CRSS were plotted in Table 3.2.1. The results of VPSC simulations were shown in Figure 3.2.1.
The changes of CRSS on basal slip and tensile twin were insensitive to the temperature. All the CRSS values decreased with increasing temperatures as shown in Figure 3.2.2 and 3.2.3. More specifically, even with the decreasing tendency of the CRSS with increasing temperatures, the CRSS differences of basal <a> slip and tensile twin were quite small to the first decimal place. However, the CRSS of prismatic <a> slip, pyramidal <c+a> I & II slip and compression twin were greatly dependent on the temperature in order of pyramidal <c+a> I slip, compression twin, prismatic <a> slip and pyramidal <c+a> II slip. In Mg-Nd alloy the CRSS of pyramidal <c+a> I slip greatly reduces than Pure Mg, even though the CRSS of other deformation systems was always higher on Mg-Nd alloy than pure Mg. The CRSS values for 5 deformation modes except pyramidal <c+a> I slip were increased with the increasing Nd concentration and decreased with the increasing test temperatures.
That is, the deformation mode which caused solid solution softening was pyramidal
<c+a> I slip. The evidence of the decreasing CRSS of pyramidal <c+a> I was shown in the microstructure after c-axis compression test in Figure 3.1.16. In Pure Mg specimen, no slip traces of pyramidal <c+a> I slip, but in Mg-Nd specimens, a few slip traces of pyramidal <c+a> I slip were observed.
47
The calculated prismatic <a> slip CRSS from VPSC was well matched with the experimental data. It was found that the CRSS values from direct experiment of single slip tensile test were quite close to those determined by the simulation under multiple slip condition. The deviations of experimental to simulated values were plotted in Figure 3.2.5. At lower temperatures from 298K to 533K, there was little differences of CRSS of prismatic <a> slip. However, at the temperatures above 533K, the differences became smaller and smaller. The reason of the CRSS error between two was due to the interactions with other deformation modes in multiple slip condition.
As the test temperature increased, every CRSS of each deformation modes was decreased. Nevertheless, the drop rate of CRSS was different in every deformation modes. The absolute value of CRSS and drop rate were two main factors which defined the activities during the deformation.
48 a)
b)
49 c)
d)
Figure 3.2.1 Experimental and simulated stress-strain curves of three orientation; a) pure Mg, b) 0.02Nd, c) 0.04 Nd, d) 0.06 Nd
50 a)
b)
51 c)
d)
Figure 3.2.2 Calculated CRSS values of each deformation modes;
a) pure Mg, b) 0.02Nd, c) 0.04 Nd, d) 0.06 Nd
52
53
Table 3.2.1 Calculated CRSS of each deformation modes via VPSC-GA
54 a)
b)
0.00 0.02 0.04 0.06
0.0 0.2 0.4 0.6 0.8 1.0 1.2
1.4 Basal <a>
CRSS (MPa)
Concentration (at.%)
298K 413K 453K 493K 533K 573K 613K 653K 693K
0.00 0.02 0.04 0.06
0 20 40 60
Prismatic <a> 298K
413K 453K 493K 533K 573K 613K 653K 693K
CRSS (MPa)
Concentration (at.%)
55 c)
d)
0.00 0.02 0.04 0.06
0 50 100 150
200 Pyramidal <c+a> I 298K
413K 453K 493K 533K 573K 613K 653K 693K
CRSS (MPa)
Concentration (at.%)
0.00 0.02 0.04 0.06
0 20 40 60 80
100 Pyramidal <c+a> II 298K
413K 453K 493K 533K 573K 613K 653K 693K
CRSS (MPa)
Concentration (at.%)
56 e)
f)
Figure 3.2.3 Effect of test temperature on each deformation modes as a function of concentration; a) basal <a>, b) prismatic <a>, c) pyramidal <c+a> I, d) pyramidal
<c+a> II, e) tensile twin, f) compression twin
0.00 0.02 0.04 0.06
1.0 1.5 2.0
2.5 Tensile Twin (1 0 1 2) 298K
413K 453K 493K 533K 573K 613K 653K 693K
CRSS (MPa)
Concentration (at.%)
0.00 0.02 0.04 0.06
0 50 100 150
200 Compression Twin (1 0 1 1) 298K
413K 453K 493K 533K 573K 613K 653K 693K
CRSS (MPa)
Concentration (at.%)
57 a)
b)
300 400 500 600 700
0.0 0.2 0.4 0.6 0.8 1.0 1.2 1.4
Basal <a> Mg
Mg-0.02Nd Mg-0.04Nd Mg-0.06Nd
CR S S (MP a )
Temperature (K)
300 400 500 600 700
0 20 40 60
Prismatic <a> Mg
Mg-0.02Nd Mg-0.04Nd Mg-0.06Nd
CR S S (MP a )
Temperature (K)
58 c)
d)
300 400 500 600 700
0 50 100 150
200 Pyramidal <c+a> I Mg
Mg-0.02Nd Mg-0.04Nd Mg-0.06Nd
CR S S (MP a )
Temperature (K)
300 400 500 600 700
0 50
100 Pyramidal <c+a> II Mg
Mg-0.02Nd Mg-0.04Nd Mg-0.06Nd
CR S S (MP a )
Temperature (K)
59 e)
f)
Figure 3.2.4 Effect of Nd concentration on each deformation modes as a function of temperature; a) basal <a>, b) prismatic <a>, c) pyramidal <c+a> I, d) pyramidal
<c+a> II, e) tensile twin, f) compression twin
300 400 500 600 700
0 1 2
3 Tensile Twin Mg
Mg-0.02Nd Mg-0.04Nd Mg-0.06Nd
CR S S (MP a )
Temperature (K)
300 400 500 600 700
0 50 100 150
200 Compression Twin Mg
Mg-0.02Nd Mg-0.04Nd Mg-0.06Nd
CR S S (MP a )
Temperature (K)
60
Figure 3.2.5 CRSS Deviation of prismatic <a> slip between experiment and simulation.
300 400 500 600 700
0 20 40 60 80 100
Experiment Simulation
Prismatic <a> Mg
Mg-0.02Nd Mg-0.04Nd Mg-0.06Nd
CR S S (MP a )
Temperature (K)
61
3.2.3 Activity
The activities of each deformation modes during the tensile and compression tests were also determined via VPSC simulation. The calculation on the activities was based on the CRSS changes of each deformation modes. In this research, activities of six deformation modes only concerned on multiple slip system and the results were shown in Figure 3.2.6 – 3.2.8
From the B orientation tensile test (Figure 3.2.6), the major deformation mode was prismatic <a> slip, basal <a> slip and tensile twin are following. As the deformation strain increased, the activity of prismatic <a> slip was increased and that of basal <a> slip was decreased. Also, the activity of prismatic <a> slip increased with increasing test temperatures. That is, the major deformation modes which decided the YS of B orientation tensile tests was prismatic slip.
In B orientation compression test, YS of compression tests loaded in the same direction were directly related to the CRSS of tensile twin. In Figure 3.2.7, the basal activities increased with decreasing tensile twin activities and the activities of compression twin subsequently increased at room temperature. The basal slip was activated from the crystallographically rotated portion by tensile twin and caused hardening effect on the specimen. As temperatures increased, the activities of compression twin decreased and the activities of pyramidal II slip increased from 413 K to 533 K. At further increased temperatures from 613 K, the activities of prismatic slip increased after the activation of tensile twin was finished, and dominated the deformation system instead of the pyramidal II slip system. Above 693 K, the activities of prismatic slip further increased than the activities of basal slip.
The CRSS of Pyramidal II slip defined the YS of compression tests on orientation C. In Figure 3.2.8, from the early stages of pure Mg compression test at
62
298K, the pyramidal <c+a> II slip activities increased until about 1.5% strain. After that, the activities of compression twin activity subsequently increased with decreasing pyramidal II slip. The decreasing trend of the pyramidal <c+a> II slip CRSS was a little different with the previous research. Previous researchers reported the CRSS of pyramidal <c+a> II slip was highly sensitive to the test temperature [30].
However, the YS of C orientation did not strongly affected by increased temperatures until 533 K, hence the CRSS of pyramidal II decreased slightly until 533 K. The onset activity of pyramidal <c+a> II slip increased with increasing temperatures due to the decreasing CRSS. Although the CRSS of pyramidal II slip decreased enough to activate the pyramidal II slip above 533 K, the fracture occurred rapidly at relatively low strain, because the CRSS reduction of compression twin activated the compression twin at the early stage.
From C orientation compression test in Mg-xNd, the activity of the pyramidal
<c+a> I slip increased which hardly activated at the pure Mg compression test. As mentioned before with OM analysis, Nd effectively increased the activation of pyramidal <c+a> I slip system in Mg. The activity of pyramidal <c+a> I slip greatly increased in 0.02 at.% Nd and slowly decreased with increasing Nd concentration.
The activation of pyramidal <c+a> I slip during the compression test also leaded much decreased strain hardening rate than that of pure Mg without the activation of pyramidal <c+a> I slip. The solid solution softening in Mg-0.02 and 0.04 at.% Nd alloy could be explained by this mechanism.
63 a)
b)
64 c)
d)
Figure 3.2.6 Activity of each deformation modes on B orientation tension;
a) pure Mg, b) 0.02 Nd, c) 0.04 Nd, d) 0.06 Nd
65 a)
b)
66 c)
d)
Figure 3.2.7 Activity of each deformation modes on B orientation compression; a) pure Mg, b) 0.02 Nd, c) 0.04 Nd, d) 0.06 Nd
67 a)
b)
68 c)
d)
Figure 3.2.8 Activity of each deformation modes on C orientation compression;
a) pure Mg, b) 0.02 Nd, c) 0.04 Nd, d) 0.06 Nd
69
3.3 CRSS ratio in Mg-Nd system
3.3.1 Introduction
The relative ratio of the harder deformation modes compared to the softer ones played an important role in determining texture, strength and ductility [5]. In Mg, the easiest deformation mode was the basal slip which slipped parallel to the basal plane.
Strengthening of basal slip could enhance formability of magnesium by decreasing the ratio of prismatic, pyramidal <c+a> I & II and compression twin to basal critical resolved shear stress (prismatic/basal, pyramidal/basal, compression twin/basal CRSS ratio) [41, 42]. Overall, the solute strengthening of basal slip is predicted for a wide range of solutes as a function of temperature and solute concentration at VPSC simulations. The simulation results provided an accurate calculation for estimating basal solute strengthening in binary Mg-Nd alloys and thus estimating the non- basal/basal CRSS ratio.
3.3.2 Effects of Nd and temperature on deformation behavior in Mg
The CRSS ratio calculations included the major slip and twinning modes:
prismatic to basal, pyramidal to basal, tensile twin to basal and compressive twin to basal are listed in Table 3.3.1. The CRSS ratio for all the non-basal slip decreased with the Nd addition at the same temperature which derived the increase of the non- basal slip activity compared to that of pure Mg.
From the Figure 3.3.1 it was found that the CRSS ratio decreased as the Nd concentration increased. For example, the CRSS ration for the prismatic slip was
70
69.487 for the pure Mg, 298K. And the value of the CRSS ratio for 0.06 Nd was decreased to 50.603. Which means the non-basal slip is easier to active with the increasing Nd concentration in the Mg-Nd binary alloy single crystal system. In addition, the effect of temperature on the CRSS ratio is also investigate. With the temperature increased the CRSS ratio decreased [43]. For example, the CRSS ratio for the Pyramidal <c+a> I slip was 262.114 for the pure Mg, 298K while at 653K the value was decreased to 162.117.
Therefore, addition of dilute Nd concentration effectively decreased the CRSS ratio and contributed to the formability improvement.
71
72
Table 3.3.1 CRSS ratio of Mg-xNd single crystals.
73
Figure 3.3.1 CRSS ratio of Mg-xNd sing

![Figure 1.2 Possible deformation modes in HCP Mg. [38]](https://thumb-ap.123doks.com/thumbv2/123dokinfo/11498888.0/18.774.146.688.462.785/figure-possible-deformation-modes-in-hcp-mg-38.webp)