저작자표시-비영리-변경금지 2.0 대한민국 이용자는 아래의 조건을 따르는 경우에 한하여 자유롭게
l 이 저작물을 복제, 배포, 전송, 전시, 공연 및 방송할 수 있습니다. 다음과 같은 조건을 따라야 합니다:
l 귀하는, 이 저작물의 재이용이나 배포의 경우, 이 저작물에 적용된 이용허락조건 을 명확하게 나타내어야 합니다.
l 저작권자로부터 별도의 허가를 받으면 이러한 조건들은 적용되지 않습니다.
저작권법에 따른 이용자의 권리는 위의 내용에 의하여 영향을 받지 않습니다. 이것은 이용허락규약(Legal Code)을 이해하기 쉽게 요약한 것입니다.
Disclaimer
저작자표시. 귀하는 원저작자를 표시하여야 합니다.
비영리. 귀하는 이 저작물을 영리 목적으로 이용할 수 없습니다.
변경금지. 귀하는 이 저작물을 개작, 변형 또는 가공할 수 없습니다.
경제 사 위논문
Small-Scale Rural Water Supply and Development: A Historical
Experience of Korea
소규모 상수도의 도입과 한 근· 현대 인 본
2019 년 2 월
울대 교 대 원
경제 부 경제 전공
윤 양 근
Small-Scale Rural Water Supply and Development: A Historical
Experience of Korea
지도 교수 홍 철
이 논문을 경제 사 위논문으 제출함
2018 년 10 월
울대 교 대 원
경제 부 경제 전공
윤 양 근
윤양근의 경제 사 위논문을 인준함
2019 년 1 월
위 원 장 이 철 희 ( 인 )
부위원장 홍 철 ( 인 )
위 원 이 정 민 ( 인 )
문 초
한 전쟁 이후 정부는 안전한 수 공급을 위 상수도 정수 설에 대한 투 를 다. 그러나 경제 타당성에 대한 고려 인 대부분의 설이 도 지 으 집중되었고, 농촌 지 의 정수 공급은 매우 제한 이었다. 이에 대한 대안으 정부 및 관계 부처는
1960년대 후반부터 소규모 상수도를 농촌 지 에 설치 기 다.
이와 같은 한 의 사 경험을 토대 , 본 논문은 소규모 상수도 설의 도입이 민건강과 인 본형성에 미친 향을 장기 인 관점에 조망한다. 먼 , 소규모 상수도 도입의 기 ·지 변이를 이용 , 정책 개입이 장티푸스 발병률 감소에 상당한 기 를
다는 정 결과를 제 한다. 다음으 , 1995년, 2000년, 2010년,
2015년 인 총조사 마이크 데이터 부터 한 코호트 표본을 이용 소규모 상수도의 도입 전후에 태어난 이들의 교육 성과를 비교한다. 이를 통 정책 개입을 통한 질병 환경의 개선이 장기 으 인 본형성에 향을 미친다는 점을 제 한다.
주요어 : 소규모 상수도, 장티푸스, 생애초기가설, 인 본 번 : 2015-22519
Abstract
Small-Scale Rural Water Supply and Development: A Historical Experience
of Korea
Yangkeun Yun Department of Economics The Graduate School Seoul National University
After the Korean War, Korean government began to make investments on (large- scale) water purification plants for clean and safe water supply. But their intro- duction was mostly limited to urban areas due to lack of economic validity in rural areas. Instead, the government began to install small-scale water supply system in rural areas since the late 1960s. Using the historical experience, this paper investigates the effects of small-scale water supply interventions on health and hu- man capital formation in the long-term perspectives. First, exploiting the timing and geographic variations of small-scale water facilities, I estimate that the inter- vention substantially reduced the incidence of typhoid fevers. Second, I compare educational attainments of cohorts born in rural areas before and after small-scale facilities were introduced by using cohort samples constructed from the 1995, 2000, 2010, and 2015 Korean population censuses. I found that early-life exposure to the intervention was beneficial to human capital formation.
Keywords: Water supply investments, Small-scale water supply system, Typhoid fever, Early-life condition, Human capital development Student Number: 2015-22519
Contents
1 Introduction 1
2 Small-scale Water Supply System and Typhoid fever 4
2.1 Water Supply Interventions after Korean War . . . 4 2.2 Available Data and Sample Areas . . . 5 2.3 Emprical Strategy and Results . . . 6
3 Long-term Followup from Early Childhood Exposure to Small-scale Water Supply System 11
3.1 Census Data and Identification Strategy . . . 11 3.2 Later Outcomes . . . 12
4 Discussion 15
5 Concluding Remarks 18
List of Tables
1 Long-term followup based on the Small system inter- vention and the difference of typhoid fever for cohorts born in 1945-1980 . . . 14 2 Estimation by alternative specification . . . 16 A1 Summary statistics . . . 22
List of Figures
1 Trend of sample regions, 1960-1984 . . . 6 2 Estimated impact of water supply interventions on ty-
phoid fever for years before, during, and after adoption 8 3 Increase of penetration rate of each systems after initial
adoption . . . 10 5 Estimated effect on later outcomes by exposure to the
small-scale water supply system and typhoid risk before and after the intervention . . . 13 6 Supply ratio of drinking water treatment and sewage
treatment . . . 17 A1 Map of average typhoid incidence before the introduc-
tion of small-scale water supply system . . . 19 A2 Trend of nation and sample areas . . . 20 A3 Estimated impact of water supply interventions on diph-
theria for years before, during, and after adoption . . . 21
1 Introduction
Approximately 800 million people, or one-ninth of the world’s pop- ulation in 2015, are not receiving safe drinking water (WHO,2015).
About 80% of diseases in developing countries are water-borne dis- eases caused by contaminated drinking water and poor sanitation sys- tems. Especially, the young children including fetus and infancy are vulnerable to diarrhoeal diseases—such as typhoid fever, cholera, and dysentery, which is the leading cause of child mortality and morbidity in the developing world.
Diarrhoea infection is spread through contaminated water, or from person-to-person as a result of poor hygiene. Interventions to pre- vent diarrhea, including safe drinking water, improved sanitation and hand washing with soap can reduce disease risk. That is, a signifi- cant proportion of diarrhoeal disease can be prevented through safe drinking-water and adequate sanitation.
The most pressing issues are how to supply clean water to suf- fered areas. One of the useful methods is studying the experience of past policy interventions. For the case of the early twentieth cen- tury United States,Cutler and Miller(2005) demonstrate that water purification system decreased typhoid mortality by 25 percent in the United States. Ferrie and Troesken (2008) estimate that from 30 to 50 percent of mortality reduction from the late 19 century to the early 20 century can be attributed to water purification and the subsequent decrease of diarrhoeal diseases and its sequella.
Furthermore, studies stressing the importance of early life condi- tion in later human capital accumulation have become increasingly popular in recent years (Almond and Currie, 2011; Almond et al., 2012, 2018; Barker,1998;Costa,2000). The findings have been sup- ported by the theoretical mechanism that life-cycle interactions be-
tween health and human capital investments might be influenced by childhood disease environment (Bleakley,2010).
According to Beach et al. (2016), typhoid risk in early life had substantial effects on the long-term human capital formation. They used typhoid mortality as an indicator of water quality and explored how early life exposure to typhoid fever influenced later life outcomes in terms of income, educational attainment and so on. Zhang and Xu (2016) demonstrate an educational benefit to rural youth in China from piped water treatment program in the 1980s. They find the program increased the final grades of education of rural youth by 1.1 years. Therefore, water purification has a significant and diffuse effect on long-run perspective.
This current study seeks similar evidence from the historical ex- perience of South Korea. Korean government suddenly introduced small-scale water supply in the late 1960s to address the shortage of purified water in rural areas, and people experienced the dramatic decrease of typhoid fever in the early 1970s. Thus, the experience of South Korea provides a useful historical framework for identify- ing the causal effect of clean water policy on lowering the burden of waterborne disease and its spillover impacts on the human capital accumulation.
The benefits of studying Korean case include other aspects. First, Korea government implemented distinctive clean water policy since the late 1960s. In areas where purified water was not available, this intervention enabled residents to access chlorinated water. Since it is crucial to provide resources efficiently, the Korean case resonates with an economic interest understanding which intervention methods are beneficial to supply water purification facilities in areas where large-scale clean water intervention is limited.
Second, Korea has experienced remarkable economic growth in re-
2
cent years. Korea is the exemplar that shows the link between public health promotion and economic growth. Notably, after the indepen- dece from Japanese colonial government, the miracle of high growth was achieved through the 1950s-1980s, with the efforts of public health investments such as sanitation improvement, disease eradication, and thus productivity increase. This study is the first study that seeks the development path of Korea relating to water supply intervention in that period. Therefore, the Korean case can give a meaningful implication for developing countries today.
Third, Korea showed relatively mild typhoid severity even in the pre-decline period (before the early 1970s). Almond et al. (2018) stress that early life exposure to the ‘mild’ disease environment merit more study because the disease that is small in magnitude can also severely impair child development. However, past typhoid-related lit- erature focused on the case of the early 20th century America, and the typhoid incidence in that period America far exceeded even the most severe typhoid endemic regions today.1 Relatively mild typhoid intensity in the 1960s Korea is more comparable with that of high-risk countries today. Thus, this paper will widen the scope of understand- ing regarding the impacts of the elimination of milder diseases.
I organized this paper as follows. In Section 2, I discuss the ex- perience of water supply interventions and improvement of typhoid environment in Korea with the empirical analysis. In Section3, I also study the impact of small-scale water supply treatment on later educa- tional outcomes. After discussing competing explanations in Section 4, I conclude the findings of this study with the implications from the perspective of development economics.
1According toWhipple(1908), the typhoid mortality in the early 20th century America was above 40 deaths per 100,000 population. However, the most severe countries today (Pakistan, Bangladesh, Bhutan, and India) show only below 10 per 100,000 population (WHO,2018).
2 Small-scale Water Supply System and Ty- phoid fever
2.1 Water Supply Interventions after Korean War
During the 1950s-1960s Korea, the water supply was insufficient as the Korean War severely destroyed the related infrastructures. The water supply facilities were expanded in earnest from the 1960s when the first economic development plan was established. Since then, large- scale planning and investments in water purification plant (henceforth, Purification system) have been made to cope with the increasing de- mand for purified water supply (Cho et al.,2008).
However, water purification infrastructures were mainly provided to urban areas due to lack of economic validity in rural areas. Rural residents have traditionally dug wells or carrying the water home from a natural spring. The wells in which the majority of the farmers de- pended on were shallow aquifers and mainly located in the residential areas. So these are likely to be contaminated by adjacent toilets, hous- ing, and sewage (Cho,2013). They were used without being sterilized, so they were often unsanitary (Kim,1992). This led to problems such as frequent outbreaks of waterborne diseases.
Thus, the government started the installation of small-scale water supply system (henceforth, Small system) in 1967 as a part of its local community development policy.2 Moreover, the 5-Year Economic De- velopment Plan and the New Village Movement provided the impetus, and the water supply projects in rural areas have been promoted in earnest.3
2SeeCho(2013) for more detailed information about small-scale waterworks.
3Small-scale water supply system includes the village water supply system and simple waterworks.
4
2.2 Available Data and Sample Areas
This study collected district level aggregated data on typhoid infec- tion, Purification system, and Small system to explore the causal rela- tionship between the water supply interventions and waterborne dis- ease. I rely on the Statistical Yearbook (for 1960-1969 and 1979-1984) and Yearbook of Public Health and Social Statistics (for 1970-1978) to measure the extent to which typhoid fever was severe in each region by year. Purification system and Small system data comes from Sta- tistical Yearbook and Ministry of Environment, respectively. Since Small system data was surveyed once in 2009, I am only able to know the number of people using Small system in 2009, not during my an- laysis period. However, the Small system facilities were not renovated since the initial adoption, thus I calculated the penetration rate by using the capacity information.4 From these sources, I constructed district-year panel data.5 Since the information of typhoid incidence for the entire period is available in shaded areas in Figure A1, panel data of these 136 regions from 1960 to 1984 are used when I estimate the effect of water supply investments on typhoid incidence.6
Figure1shows the trend of Small system, Purification system, and typhoid fever incidence from 1960 to 1984 for the 136 sample regions.
There are some interesting features in this figure. First, the gap of the penetration rate of Purification system between city and county was huge and even becomes larger as time passed. Second, the supply of
4Water Supply and Waterworks Installation Act defines village water supply system as a general water supply facilities that provide water to more than 100 to 2,500 people or that have a daily capacity between 20m3 and 500m3. Also, simple waterworks facility refers to water supply facilities with a population of 100 or fewer, which is defined as a capacity of 20m3 or less per day. By using this relationship between the daily capacity and supply population information, I acquired the pseudo-penetration rate of Small system during my analysis period (= capacity per day×5
population ×100).
5The geographic unit of this paper is city and county (si andgunin Korean).
6FigureA2shows that the whole nation have similar trends with that of sample regions. Thus, I assume that those sample regions represent the Korean case.
Figure 1: Trend of sample regions, 1960-1984
020406080Penetration rate per 100 1960 1963 1966 1969 1972 1975 1978 1981 1984
Purification System
051015Penetration rate per 100 1960 1963 1966 1969 1972 1975 1978 1981 1984
Urban Cities Rural Counties
Small System
0510152025Incidence per 100,000 1960 1963 1966 1969 1972 1975 1978 1981 1984
Typhoid Fever
Notes: The penetration rate per 100 for Purification system is the number of population using Purification system per 100 population. The penetration rate per 100 for Small saystem are calculated based on the daily capacity (=
Capacity per day×5
Population ×100). City and county are divided based on 1975 administra- tive code. The number of city and county is 32 and 104, respectively. The sample covers around 80% (136 out of 155) of the country.
Small system abruptly increased since the late 1960s, particularly in county regions. Finally, there was a difference in typhoid incidence be- tween city and county areas, and the incidence dramatically decreased in the early 1970s especially in rural counties.
2.3 Emprical Strategy and Results
In this subsection, I estimate the effects of Small system on typhoid fever incidence. My empirical analysis relies on difference-in-differences approach by using variations across districts and years. A possible concern to this method is the differential trends on outcome variable in the pre-treatment period. Specifically, there is a concern that districts may have begun to install water supply facilities in response to specific events such as a high incidence of waterborne diseases. Relatively high incidence just before the adoption of each system could cause my esti- mates to capture a mean-reversion. Alternatively, relative reductions
6
in incidences in the years just prior to the adoption may suggest that my estimates are confounded by secular incidence declines. To allevi- ate these concerns, I try to check whether the trends of typhoid fever incidence across districts are common in the pre-treatment period.
I start with the event study around the year of initial introduction of water supply systems. The basic idea is to compare typhoid inci- dence against the relative years according to the intervention in each district. The estimation equation becomes
Tjt =
6
X
k=−4
βkDjtk(t−i=k) +δt+δj +jt (1)
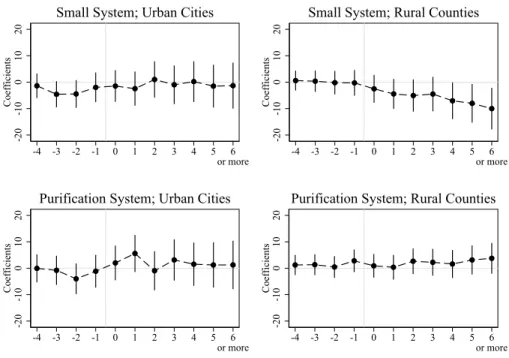
where Tjt denotes the typhoid incidence per 100,000 population in district j during calender year t. I define Dkjt(t−i= k) as dummy variables that indicate the duration (years) before or after the in- tervention.7 I add indicator variables for 1,2, 3, and 4 years before intervention (k = −1 to −4), years 1 to 5 after intervention (k = 1 to 5), and year 6 forward (k = 6). The final variable Djtk(t−i= 6) is equal to one in each year, starting with the sixth year of interven- tion.8 I also controlled the year and district fixed effects,δtandδj, to eliminate potentially confounding year-specific changes and district- specific conditions, respectively.
The estimatedβkcoefficients are summarized with the 95 percent confidence intervals in Figure2. I divided sample regions into urban cities and rural counties based on 1975 administrative code. There is
7To capture the intervention, I construct the treatment variable by detecting a relatively large and sudden increase in the penetration rate asZhang and Xu(2016) did. I code a district in a particular year as being covered by intervention based on two conditions: (1) initial intervention year is included in my analysis period; or (2) initial intervention year is not identified during 1960-84, but penetration rate rises by more than 10 % points compared to previous year.
8The lead variableDkjt(t−i=−5), which is equal to one in each year before the fifth year of intervention, is omitted to avoid the multicollinearity. Thus, the interpretation of eachβk becomes the relative incidence of typhoid fever in each relative yearkcompared to the average incidence before relative year 5.
Figure 2: Estimated impact of water supply interventions on typhoid fever for years before, during, and after adoption
-20-1001020Coefficients
-4 -3 -2 -1 0 1 2 3 4 5 6
or more
Small System; Urban Cities
-20-1001020Coefficients
-4 -3 -2 -1 0 1 2 3 4 5 6
or more
Small System; Rural Counties
-20-1001020Coefficients
-4 -3 -2 -1 0 1 2 3 4 5 6
or more
Purification System; Urban Cities
-20-1001020Coefficients
-4 -3 -2 -1 0 1 2 3 4 5 6
or more
Purification System; Rural Counties
Notes: I conducted the regressions in equation (1). I depicted the estimated coefficientsβkagainst the relative year of initial adoption with the 95 confidence intervals. City and county are divided based on 1975 administrative code.
8
no sigificant result for Purification system even after the intervention.
This may be due to the bias of the allocation of Purification system in areas where the water-related conditions were already better. In a similar vein, the results for Small system of city sample also do not significantly deviate from zero.9
However, since counties mainly consist of rural areas, I expect that the effects of Small system would be much larger in those regions. The coefficients on the leads are close to zero, indicating little evidence of systematic high or low typhoid incidence right before Small system intervention. In the year of adoption, typhoid incidence begins to decrease, after which this decrement continues from 4 to 8 points over the subsequent five years. It averages 10 points in year 6 forward.
Overall evidence suggested in this event study is that the intervention through Small system substantially led the decline of typhoid fever in rural areas.
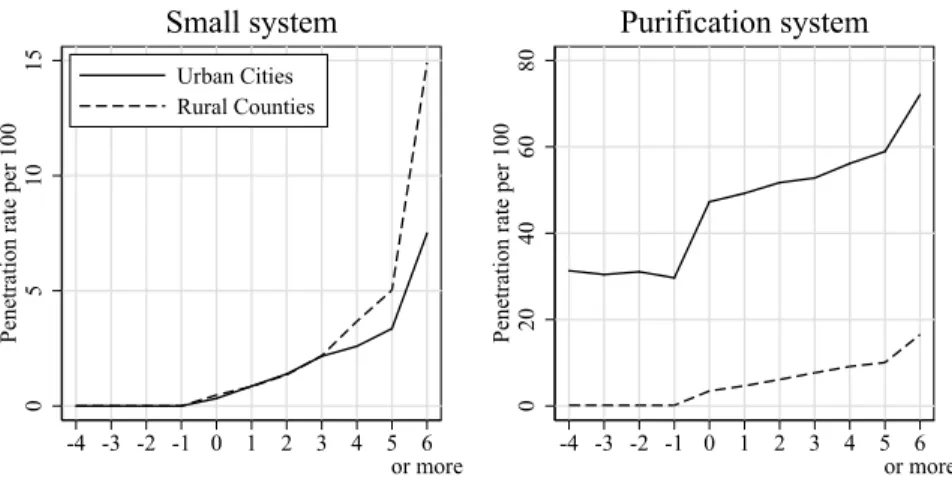
I need to investigate whether the distribution of Small system within districts expanded after intervention starts. In figure 3, it is remarkable that the penetration rate of Small system slightly increases at the begining, but rapidly increases subsequent years, especially in county areas. Therefore, I can understand the reason typhoid inci- dence gradually decreases since the intervention.
9Small systems were mainly supplied to rural areas where Purification systems were not installed and rural areas account only small proportion in cities, so it was difficult to obtain large benefits from Small system even in cities adopting Small system.
Figure 3: Increase of penetration rate of each systems after initial adoption
051015Penetration rate per 100
-4 -3 -2 -1 0 1 2 3 4 5 6 or more Urban Cities
Rural Counties
Small system
020406080Penetration rate per 100
-4 -3 -2 -1 0 1 2 3 4 5 6 or more
Purification system
Notes: Thex-axis denotes the relative year since intervention begins. The pen- etration rate per 100 for Purification system is the number of population using Purification system per 100 population. The penetration rate per 100 for Small system are calculated based on the daily capacity (= capacity per day×5
population ×100). City and county are divided based on 1975 administrative code.
10
3 Long-term Followup from Early Childhood Exposure to Small-scale Water Supply Sys- tem
3.1 Census Data and Identification Strategy
From now on, I estimate the long-term effects of Small system during childhood period on later outcomes. I constructed synthetic cohorts data from 1995 (10%), 2000 (10%), 2010 (10%), and 2015 (20%) cen- suses by creating cells according to birth year, birth district, gender, and census year.10 Since the critical period of Small system increase and typhoid fever decrease is around the late 1960s to the early 1970s, the constructed data brackets that period.
Variables related to final education are available for a substantial stretch of cohorts. I exploit three educational outcome vairables: final years of schooling, completing high school or higher, and completing college or higher for age 30-50 those who were born from 1945 to 1985.
Summary statistics of these variables are provided in TableA1.
The identification strategy in this analysis comse from the timing of distribution of Small system which induces variation in childhood exposure to the clean water condition across birth years and birth dis- tricts. However, it is undesirable to estimate the effect of childhood exposure to Small system by simply comparing later outcomes. Con- sidering such concerns, I use the average of typhoid incidence before Small system intervention at birth district as an additional variation to control these confounding factors. Therefore, I assume that people
10The geographic units employed in this analysis should be a place of birth rather than current residence. Matching individuals with early life conditions by current residence would be problematic because of selective migration. Korean population census from the Microdata Integrated Service (MDIS) provides birth district through authorized data by using Remote Access Service (RAS).
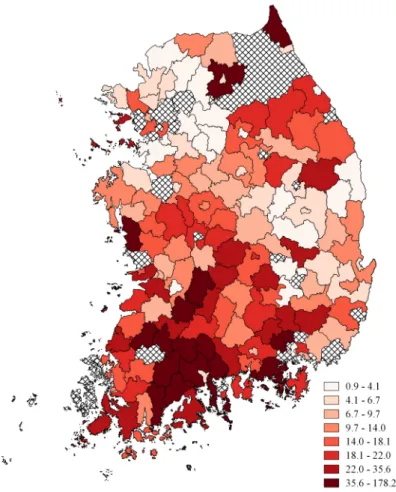
in areas with severe typhoid incidence were in a position to benefit from Small system, whereas areas with low incidence were not. This heterogeneity (diplayed in Figure A1) permits a treatment–control estimation strategy.
3.2 Later Outcomes
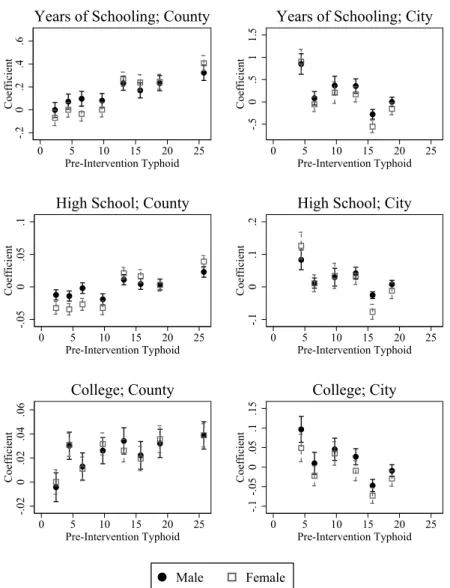
I start with a simple graphical analysis by investigating the changes in adult outcomes across the pre-intervention typhoid incidence using the following equation.
yjtk =α+βSjt+X
i
βi(Sjt×T Dji) +δj+δt+δk+jtk (2) where yjtk is the average educational attainment among the cohort born in district j and year t, and found in census year k. Sjt is an indicator whether year t is after small-scale water supply inter- vention in district j. T Dij are dummies that indicate whether the 1960-66 average typhoid incidence in districtj is the ith decile (i.e., pre-intervention typhoid risk measure).11 δj,δt, and δk are birth dis- trict, census year, and birth year dummies, respectievely.
In this equation, βi estimates the effect among theith decile ty- phoid risk districts compared with that in the 1st decile districts. As stated above, I expect thatβi increases with i. In Figure 5, the esti- mated coefficients ofβi indicate that the adult educational outcomes are positively correlated with the pre-intervention typhoid at the birth district. This implies that the gap caused by childhood exposure to Small system is more substantial among those born in highly improved districts in terms of typhoid incidence.
In Figure5, the level of association between the outcome gap and typhoid difference in birth district is decided by slope of the fitted
11The reference becomes 1st decile.
12
Figure 5: Estimated effect on later outcomes by exposure to the small- scale water supply system and typhoid risk before and after the inter- vention
-.20.2.4.6Coefficient
0 5 10 15 20 25
Pre-Intervention Typhoid
Years of Schooling; County
-.50.511.5Coefficient
0 5 10 15 20 25
Pre-Intervention Typhoid
Years of Schooling; City
-.050.05.1Coefficient
0 5 10 15 20 25
Pre-Intervention Typhoid
High School; County
-.10.1.2Coefficient
0 5 10 15 20 25
Pre-Intervention Typhoid
High School; City
-.020.02.04.06Coefficient
0 5 10 15 20 25
Pre-Intervention Typhoid
College; County
-.1-.050.05.1.15Coefficient
0 5 10 15 20 25
Pre-Intervention Typhoid
College; City
Male Female
Notes: Each panel plotsβiin equation (2) to investigate the cross-cohort change in the outcomes against deciles of pre-intervention typhoid risk.
line. As a positive slope is steeper, childhood exposure to Small sys- tem more largely benefited later results. I estimate the relationship between Small system supply and later outcomes more thoroughly by using the following estimation equation.
yjtk =α+β1Sjt+β2(Sjt×Tj) +δj+δt+δk+ijt (3) whereyjtkis adult outcome variable of interest. Tj denotes the average of typhoid incidence before intervention (1960-1966) in districtj. δj, δt, and δk are birth district, census year, and birth year dummies, respectievely.
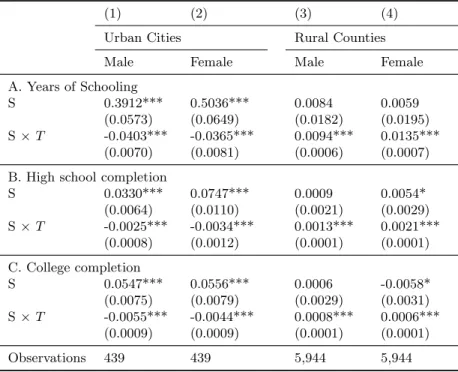
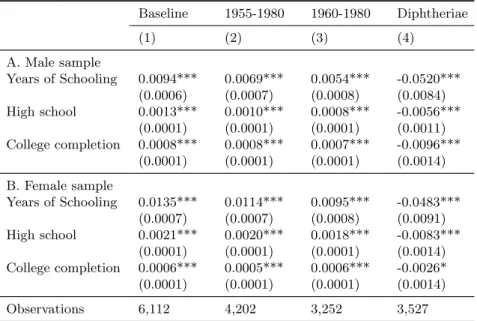
Table 1 Long-term followup based on the Small system intervention and the difference of typhoid fever for cohorts born in 1945-1980
(1) (2) (3) (4)
Urban Cities Rural Counties
Male Female Male Female
A. Years of Schooling
S 0.3912*** 0.5036*** 0.0084 0.0059
(0.0573) (0.0649) (0.0182) (0.0195) S×T -0.0403*** -0.0365*** 0.0094*** 0.0135***
(0.0070) (0.0081) (0.0006) (0.0007) B. High school completion
S 0.0330*** 0.0747*** 0.0009 0.0054*
(0.0064) (0.0110) (0.0021) (0.0029) S×T -0.0025*** -0.0034*** 0.0013*** 0.0021***
(0.0008) (0.0012) (0.0001) (0.0001) C. College completion
S 0.0547*** 0.0556*** 0.0006 -0.0058*
(0.0075) (0.0079) (0.0029) (0.0031) S×T -0.0055*** -0.0044*** 0.0008*** 0.0006***
(0.0009) (0.0009) (0.0001) (0.0001)
Observations 439 439 5,944 5,944
Notes: I conducted the regressions in equation (3) by urban cities, rural counties, and gender. Each cell reports only the coefficients that correspond to the elements ofβ1 andβ2. Standard errors are in parenthesis. A single asterisk denotes statistical significance at the 90% level of confidence, double 95%, and triple 99%.
14
The results of Table 1 are consistent with the graphical evidence in Figure 5. Cohorts with access to Small system were beneficial to educational attainment in the long-term particularly among those born in district with high decline of typhoid incidence, especially in county regions.
4 Discussion
I discuss the previous results in two aspects. First, I examine whether the results of the baseline estimation in Table 1 are robust under changes in regression specification. In Table 2, I narrow the sample years of birth cohort from 1955 to 1980 to 1960 to 1980 in column (2) and (3) to test whether the Korean war (1950-1953) can cause biases to the baseline estimation. The estimated coefficients, which are similar to those of the baseline estimation, strengthen the results of baseline estimation. I use alternative measures in birth district in column (4), average incidence of diphtheriae, which is not a waterborne disease.
This measure gives me an opportunity to check whether the previous results are specific to water-related improvement. The results strongly support the baseline results.
Second, in addtion to water supply investment, sewage supply also plays a crucial role in public health (Alsan and Goldin,forthcoming).
However, Korean case can avoid the confounding effect from sewage supply because the sewage system had began to be adopted in Korean large cities from the late 1970s. The first sewage treatment plant was built in Seoul in 1976. As shown in Figure6, supply ratio of sewage treatment was extremely low even until the end of my analysis period.
Thus, the estimated effects in this study would be little influenced by the introduction of sewage system.
Table 2 Estimation by alternative specification
Baseline 1955-1980 1960-1980 Diphtheriae
(1) (2) (3) (4)
A. Male sample
Years of Schooling 0.0094*** 0.0069*** 0.0054*** -0.0520***
(0.0006) (0.0007) (0.0008) (0.0084) High school 0.0013*** 0.0010*** 0.0008*** -0.0056***
(0.0001) (0.0001) (0.0001) (0.0011) College completion 0.0008*** 0.0008*** 0.0007*** -0.0096***
(0.0001) (0.0001) (0.0001) (0.0014) B. Female sample
Years of Schooling 0.0135*** 0.0114*** 0.0095*** -0.0483***
(0.0007) (0.0007) (0.0008) (0.0091) High school 0.0021*** 0.0020*** 0.0018*** -0.0083***
(0.0001) (0.0001) (0.0001) (0.0014) College completion 0.0006*** 0.0005*** 0.0006*** -0.0026*
(0.0001) (0.0001) (0.0001) (0.0014)
Observations 6,112 4,202 3,252 3,527
Notes: I conducted the regressions in equation (2) for different specifications.
Each cell reports only the coefficients that correspond to the elements of β2. Panel A is the results of male sample, Panel B is for female. I conduct alternative specificatoins from column (2) to column (5) in addition to baseline estimation in column (1). Standard errors are in parenthesis. A single asterisk denotes statistical significance at the 90% level of confidence, double 95%, and triple 99%.
16
Figure 6: Supply ratio of drinking water treatment and sewage treat- ment
Sample period
in this study Drinking water treatment
Sewage treatment
020406080100Ratio 1955 1960 1965 1970 1975 1980 1985 1990 1995 2000 2005 2010
Notes: Drinking water treatment only refers to Purification system in this study.
5 Concluding Remarks
The effects of public investment occur over a long period. In recent years, there have been some claims that early-life environments can affect individual health and socioeconomic levels, and some studies show that such effects may be transferred between generations (Al- mond and Currie,2011;Barker,1998;Currie and Moretti,2007;Heck- man,2007). Taking these facts into consideration, the social benefits of public investment can be much more significant than known.
In developing countries, 660 million people are suffering from wa- ter shortages (WHO,2015). In particular, water supply ratio is less than 30 percent in the least developed countries. Because of this situ- ation, about 80% of diseases in developing countries are water-borne diseases caused by contaminated water and inadequate sanitation sys- tems. Thus, solving the problem of water shortage is a top priority in developing countries.
Until the 1960s, Korea was in a similar situation to the devel- oping countries today. But with the government’s small-scale water supply intervention, Korea overcame the problem in a brief period.
Specifically, the expansion of the small-scale water supply system has significantly contributed to the reduction of typhoid fever outbreaks and the improvement of longer term educational attainment. There- fore, the experience of Korea is substantially beneficial for developing countries today.
18
Appendix
Figure A1: Map of average typhoid incidence before the introduction of small-scale water supply system
Notes: The typhoid data is matched with the 1975 administrative map.
Figure A2: Trend of nation and sample areas
203040506070Penetration rate per 100 1960 1963 1966 1969 1972 1975 1978 1981 1984
Nation Sample
Purification System
0246Penetration rate per 100 1960 1963 1966 1969 1972 1975 1978 1981 1984
Small System
05101520Incidence per 100,000 1960 1963 1966 1969 1972 1975 1978 1981 1984
Typhoid Fever
01234Incidence per 100,000 1960 1963 1966 1969 1972 1975 1978 1981 1984
Diphtheriae
Notes: Solid lines are the trends of whole nation and dashed lines are those of 136 sample districts. The penetration rate per 100 for Small system are calculated based on the daily capacity.
20
Figure A3: Estimated impact of water supply interventions on diph- theria for years before, during, and after adoption
-4-202Coefficients
-4 -3 -2 -1 0 1 2 3 4 5 6
or more
Small System; Urban Cities
-1012Coefficients
-4 -3 -2 -1 0 1 2 3 4 5 6
or more
Small System; Rural Counties
-20246Coefficients
-4 -3 -2 -1 0 1 2 3 4 5 6
or More
Purification System; Urban Cities
-.50.511.5Coefficients
-4 -3 -2 -1 0 1 2 3 4 5 6
or More
Purification System; Rural Counties
Notes: I conducted the regressions in equation (1) by using diphtheria as an out- come variable. I depicted the estimated coefficientsβk against the relative year of initial adoption with the 95 confidence intervals. City and county are divided based on 1975 administrative code.
Table A1 Summary statistics
(1) Total (2) City (3) County A. Male sample
Years of Schooling 12.458 12.936 12.385 (1.210) (1.134) (1.204)
High school 0.795 0.835 0.789
(0.157) (0.130) (0.160)
College 9.477 9.523 9.470
(0.078) (0.078) (0.075)
Cell size 317.570 915.947 226.374
(709.344) (1810.472) (133.704) B. Female sample
Years of Schooling 11.321 11.901 11.233 (1.857) (1.712) (1.863)
High school 0.679 0.740 0.670
(0.264) (0.227) (0.268)
College 9.034 9.078 9.027
(0.093) (0.089) (0.091)
Cell size 307.099 909.110 215.349
(702.747) (1790.773) (131.059) C. Average incidence 1960-1966
Typhoid 0.758 -4.174 1.260
(11.011) (4.029) (11.366)
Diphtheriae -0.332 0.297 -0.408
(1.111) (0.784) (1.121)
Number of districts 136 32 104
Notes: In panel A, male sample means and standard deviations are reported. Panel B is for female sample. Panel C shows the av- erage incidence of typohid and diphtheriae before small-scale water supply intervention.
22
References
Almond, Douglas and Janet Currie (2011) “Killing me softly: The fetal origins hypothesis,” The Journal of Economic Perspectives, Vol. 25, pp. 153–172.
Almond, Douglas, Janet Currie, and Valentina Duque (2018) “Child- hood circumstances and adult outcomes: Act II,” Journal of Eco- nomic Literature, Vol. 56, pp. 1360–1446.
Almond, Douglas, Janet Currie, and Mariesa Herrmann (2012) “From infant to mother: Early disease environment and future maternal health,” Labour Economics, Vol. 19, pp. 475–483.
Alsan, Marcella and Claudia Goldin (forthcoming) “Watersheds in child mortality: The role of effective water and sewerage infrastruc- ture, 1880 to 1920,”Journal of Political Economy.
Barker, David James Purslove (1998) Mothers, babies and health in later life, Edinburgh: Churchill Livingstone.
Beach, Brian, Joseph Ferrie, Martin Saavedra, and Werner Troesken (2016) “Typhoid fever, water quality, and human capital forma- tion,”The Journal of Economic History, Vol. 76, pp. 41–75.
Bleakley, Hoyt (2010) “Health, human capital, and development,”
Annual Review of Economics, Vol. 2, pp. 283–310.
Cho, Eulsaeng (2013) 2012 modularization of Korea’s development experience: Small-scale waterworks and sewerage systems, Korea Environment Institute.
Cho, Sungki, Insuk Seo, Jeongeun Kim, and Boram Lee (2008) 100- year history of Seoul waterworks 1908-2008, Seoul: Office of water- works Seoul Metropolitan Government.
Costa, Dora L (2000) “Understanding the twentieth-century decline in chronic conditions among older men,”Demography, Vol. 37, pp.
53–72.
Currie, Janet and Enrico Moretti (2007) “Biology as destiny? Short- and long-run determinants of intergenerational transmission of birth weight,”Journal of Labor economics, Vol. 25, pp. 231–264.
Cutler, David and Grant Miller (2005) “The role of public health improvements in health advances: the twentieth-century United States,” Demography, Vol. 42, pp. 1–22.
Ferrie, Joseph P and Werner Troesken (2008) “Water and Chicago’s mortality transition, 1850–1925,” Explorations in Economic His- tory, Vol. 45, pp. 1–16.
Heckman, James J (2007) “The economics, technology, and neuro- science of human capability formation,”Proceedings of the national Academy of Sciences, Vol. 104, pp. 13250–13255.
Kim, Younggyu (1992) “A study on the drinking water quality and problem of simple piped water supply system in a rural area,”Ko- rean Journal of Environmental Health, Vol. 18, pp. 39–51.
Whipple, George Chandler (1908)Typhoid fever: Its causation, trans- mission and prevention, New York: J. Wiley & sons.
WHO (2015)Progress on sanitation and drinking water: 2015 update and MDG assessment, Geneva, Switzerland: World Health Organi- zation.
(2018) “Diarrhoeal disease,” URL: http://www.who.int/
mediacentre/factsheets/fs330/en/, accessed on 2018-01-02.
Zhang, Jing and Lixin Colin Xu (2016) “The long-run effects of treated water on education: The rural drinking water program in China,”
Journal of Development Economics, Vol. 122, pp. 1–15.
24