저작자표시-변경금지 2.0 대한민국 이용자는 아래의 조건을 따르는 경우에 한하여 자유롭게
l 이 저작물을 복제, 배포, 전송, 전시, 공연 및 방송할 수 있습니다. l 이 저작물을 영리 목적으로 이용할 수 있습니다.
다음과 같은 조건을 따라야 합니다:
l 귀하는, 이 저작물의 재이용이나 배포의 경우, 이 저작물에 적용된 이용허락조건 을 명확하게 나타내어야 합니다.
l 저작권자로부터 별도의 허가를 받으면 이러한 조건들은 적용되지 않습니다.
저작권법에 따른 이용자의 권리는 위의 내용에 의하여 영향을 받지 않습니다. 이것은 이용허락규약(Legal Code)을 이해하기 쉽게 요약한 것입니다.
Disclaimer
저작자표시. 귀하는 원저작자를 표시하여야 합니다.
변경금지. 귀하는 이 저작물을 개작, 변형 또는 가공할 수 없습니다.
i
工學碩士學位論文
Facile synthesis of Amorphous Carbon-coated NiO Nanofibers for Electrochemical Capacitor Applications
전기화학적 커패시터로의 응용을 위한 무정형 탄소가 코팅 된 니켈옥사이드
나노파이버의 유용한 합성
2014年 2月
서울大學校 大學院
化學生物工學部
申 東 燻
ii
Abstract
Facile synthesis of Amorphous Carbon-coated NiO
Nanofibers for Electrochemical Capacitor Applications
Dong Hoon Shin School of Chemical and Biological Engineering The Graduate School Seoul National University
Amorphous carbon-coated nickel oxide nanofibers (NiC NFs) were fabricated using vapor deposition polymerization (VDP) on electrospun nickel oxide nanofibers (NiO NFs), followed by carbonization. To decorate the surface with amorphous carbon, the NiO NFs starting materials were prepared by electrospinning a PVP solution containing a nickel oxide precursor (NiAc2·4H2O) and calcining the electrospun NFs. Then, polypyrrole (PPy)-coated NiO nanofibers (NiP NFs) were fabricated as
iii
intermediate materials using the pyrrole monomer in the VDP method.
Finally, carbonization of the NiP NFs converted the PPy into amorphous carbon and thereby formed the NiC NFs. According to X-ray diffraction (XRD) and Barrett–Joyner–Halenda (BJH) analyses, the NiO structure was maintained during the PPy coating and heat-treatment processes.
Furthermore, a new pore structure was formed with each fabrication step.
The NiC NFs were used as electrochemical capacitors (ECs) with 1 M KOH as the electrolyte. The electrochemical results show that NiC NFs with a thin coating (NiC_L) had a higher specific capacitance (288 F g–1 at 0.3 A g–1) and longer cycle stabilization (89 % capacitance maintained after 3000 cycles) than pristine NiO NFs (221 F g–1 at 0.3 A g–1; 56 % capacitance maintained after 3000 cycles). Here in, the synthetic methodology is an effective route to obtain hybrid core (inorganic)/shell (organic) nanostructures for electrochemical applications.
Keywords: Electrochemical capacitors, nickel oxide, amorphous carbon, electrospinning, vapor deposition polymerization.
Student Number: 2012-20956
iv
Contents
Chapter 1. Introduction ... 1
1.1 Electrochemical Capacitor electrode materials... 1
1.1.1 Classification of Electrochemical Capacitors ... 1
1.1.2 Electrospinning Method ... 2
1.1.3 Organic/Inorganic Composite Materials ... 2
1.2 Objective of this study ... 4
Chapter 2. Experimental ... 5
2.1 Materials ... 5
2.2 Fabrication of the Hybrid NiO NFs ... 6
2.3 Characterization of the Hybrid NiO NFs ... 7
2.4 Evaluation of the Electrochemical Electrodes ... 8
Chapter 3. Results and discussion ...
103.1 Fabrication of the Hybrid NiO NFs ... 10
3.2 Characterization of the Hybrid NiO NFs. ... 17
3.2.1 X-ray diffraction (XRD) and Raman spectroscopy of the hybrid NiO NFs
...
17 3.2.2 X-ray photoelectron spectroscopy (XPS) of the hybridv
NiO NFs ... 20
3.3.3 BET and BJH measurements of the hybrid NiO NFs ... 23
3.3 Electrochemical capacitance of the hybrid NiO NFs. ... 27
3.3.1 Electrochemical performance of the hybrid NiO NFs .... 27
3.3.2 Specific capacitance of the hybrid NiO NFs with various current density and scan rate ... 34
3.3.3 Long-term cycling performance of the hybrid NiO NFs .... 39
3.3.4 Electrochemical Impedance Spectroscopy of the hybrid NiO NFs ... 42
Chapter 4. Conclusion ... 44
References ... 46
국문초록 ... 51
vi
List of Figures
Figure 1. Illustrative diagram for the fabrication of amorphous carbon-coated NiO nanofibers.
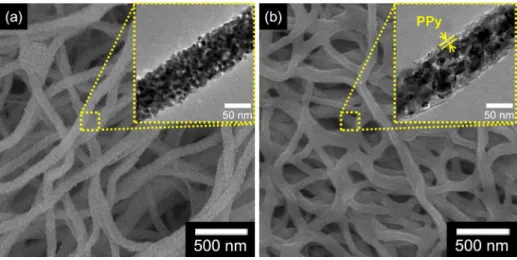
Figure 2. FE-SEM and TEM (inset) images of (a) pristine NiO NFs with a diameter of ca. 90 nm and (b) PPy coated NiO NFs with a diameter of ca. 100 nm (coated PPy layer thickness is ca. 5 nm).
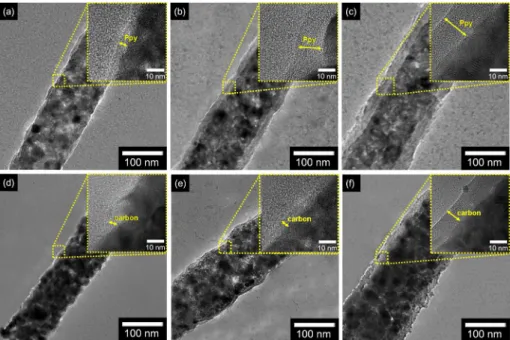
Figure 3. TEM and HR-TEM (inset) images of various thickness of PPy-coated NiO NFs of (a) ca. 5 nm (NiP_L), (b) ca. 10 nm (NiP_M) and (c) ca. 15 nm (NiP_H), and amorphous carbon-coated NiO NFs of (d) ca. 3 nm (NiC_L), (e) ca. 7 nm (NiC_M) and (f) ca. 13 nm (NiC_H), respectively.
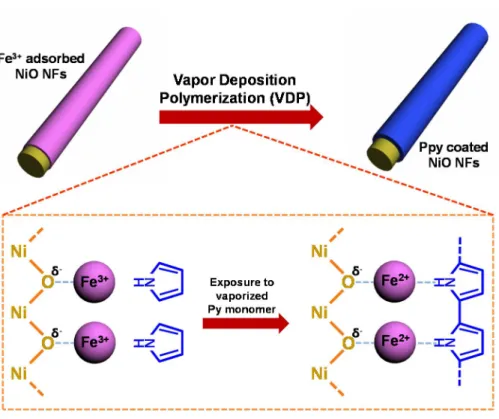
Figure 4. Illustration of the chemical oxidation polymerization process on the NiO NFs surfaces.
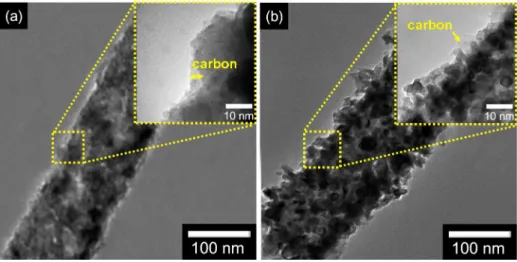
Figure 5. TEM and HR-TEM (inset) images of NiC NFs cabonized at (a) 500 °C and (b) 600 °C for 1 h with argon flow.
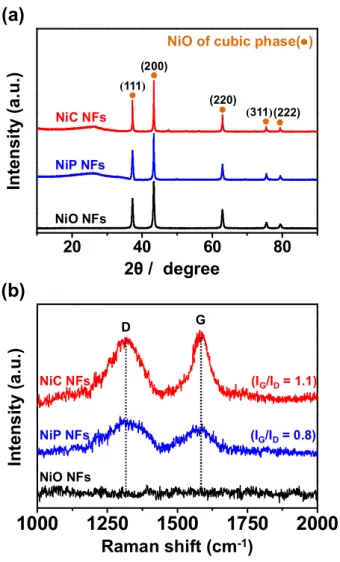
Figure 6. (a) X-ray diffraction (XRD) patterns and (b) Raman spectroscopy of pristine NiO NFs (black), NiP NFs (blue), and NiC NFs (red).
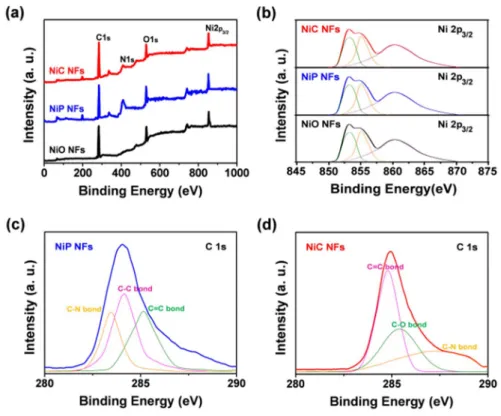
Figure 7. XPS patterns of (a) fully scanned spectra of pristine NiO NFs (black), NiP NFs (blue), and NiC NFs (red). High resolution spectrum of (b) Ni 2p3/2 for hybrid NiO NFs (pristine NiO NFs: black; NiP NFs: blue; NiC NFs: red), and C 1s for (c)
vii NiP NFs and (d) NiC NFs.
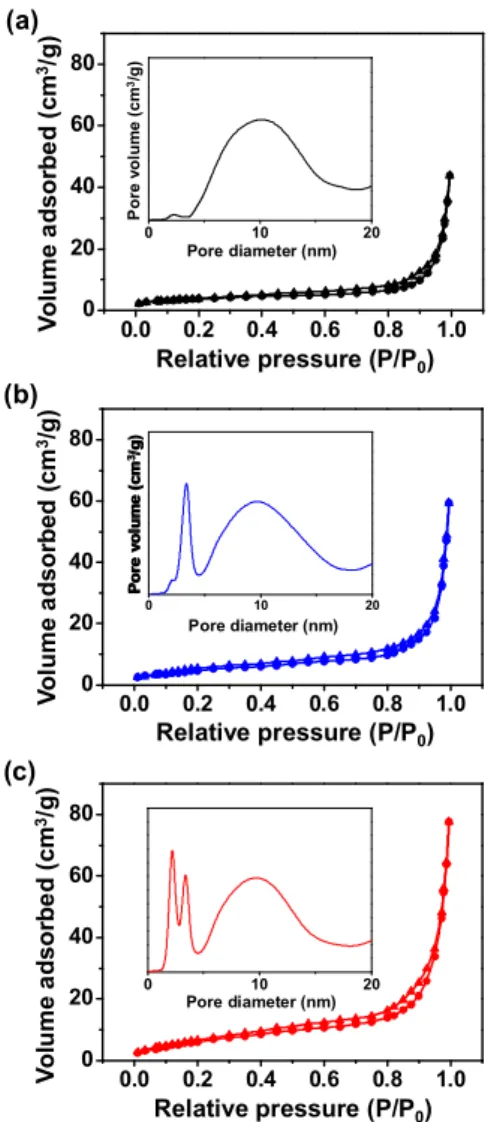
Figure 8. Brunauer-Emmett-Teller (BET) measurement and Barett-Joyner-Halenda (BJH) pore size distribution curve (inset) of (a) pristine NiO NFs, (b) NiP_L NFs and (c) NiC_L NFs.
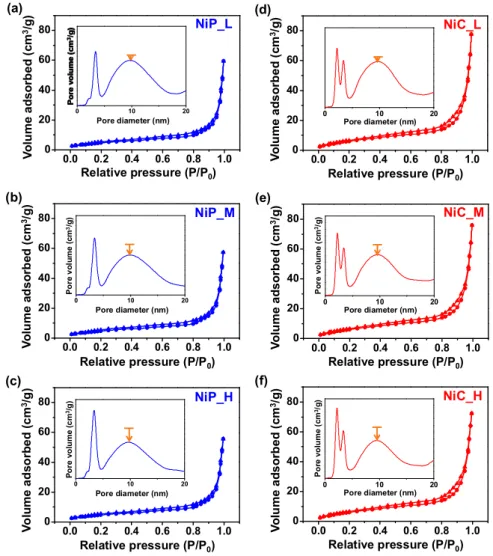
Figure 9. BET and BJH (inset) of polypyrrole coated NiO NFs with (a) low, (b) medium, (c) high thickness coating layer, and amorphous carbon-coated NiO NFs with (d) low, (e) medium, (f) high thickness coating layer.
Figure 10. CV curves (scan rate : 10 mV s–1) and galvanostatic charge/discharge curves (current density : 0.3 A g–1) of (a), (d) PPy NTs (orange), CNTs (purple) and pristine NiO NFs (black), and (b), (e) various NiP NFs (NiP_L: red; NiP_M: blue;
NiP_H: green), and (c), (f) various NiC NFs (NiC_L: red; NiC_M: blue; NiC_H:
green).
Figure 11. TEM images of (a) PPy NTs and (b) CNTs fabricated by hard template method.
Figure 12. CV curves with various scan rate (10 to 100 mV s-1) of (a) PPy NTs, (b) CNTs, (c) pristine NiO NFs, (d) NiP_L, (e) NiP_M, (f) NiP_H, (g) NiC_L, (h) NiC_M and (i) NiC_H.
Figure 13. Galvanostatic charge/discharge with various current density (0.3 to 10 A g-1) of (a) PPy NTs, (b) CNTs, (c) pristine NiO NFs, (d) NiP_L, (e) NiP_M, (f) NiP_H, (g) NiC_L, (h) NiC_M and (i) NiC_H.
viii
Figure 14. (a) Specific capacitance value for each sample with 0.3 A g-1 current density (PPy NTs: orange; CNTs: purple; pristine NiO NFs: black; NiP NFs: blue;
NiC NFs: red). (b) Specific capacitance value change with various current density (0.3 to 10 A g-1) of hybrid NFs (PPy NTs: orange; CNTs: purple; pristine NiO NFs:
black; NiP_L: blue; NiC_L: red).
Figure 15. Specific capacitance of (a) NiP NFs with medium (blue) and high thickness (green) and (b) NiC NFs with medium (blue) and high thickness (green) at different current density (0.3 to 10 A g-1).
Figure 16. Specific capacitance of (a) pristine NiO (black), PPy NTs (orange),
CNTs (purple), (b) NiP NFs and NiC NFs with different scan rate (10 to 100 mV s-
1).
Figure 17. Long-term cycling performance of pristine NiO NFs (black), PPy NTs (orange), CNTs (purple), NiP_L (blue) and NiC_L (red).
Figure 18. Long-life cyclic stability of (a) medium thickness coated of NiP NFs (blue) and NiC NFs (red) and (b) high thickness of coated NiP NFs (blue) and NiC NFs (red).
Figure 19. Electrochemical impedance spectrum of pristine NiO NFs (black), NiP_L NFs (blue), NiC_L NFs (red) in the frequency range from 100 kHz to 10 mHz.
ix
List of Tables
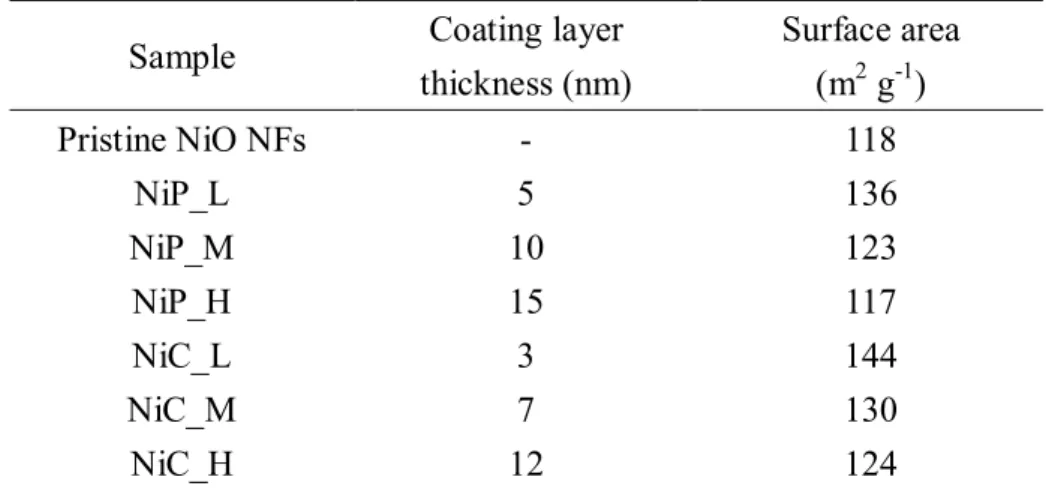
Table 1. Coating layers thickness and surface area of each sample.
x
List of Abbreviations
VDP: Vapor Deposition Polymerization ECs: Electrochmical Capacitors
EDLC: Electrical Double Layer Capacitor NiO NFs: Nickel Oxide Nanofibers
NiP NFs: Polypyrrole-coated Nickel Oxide Nanofibers NiC NFs: Amorphous carbon-coated Nickel Oxide Nanofibers PVP: Poly(vinylpyrrolidone)
NiAc2·4H2O: Nickel(ΙΙ) Acetate Tetrahydrate FeCl3: Iron(ΙΙΙ) Chloride
DMF: N,N-Dimethylformamide PVDF: Poly(vinylidene fluoride) NMP: N-methyl-2-pyrrolidone
TEM: Transmission Electron Microscope
HR-TEM: High Resolution Transmission Electron Microscope XRD: X-ray Diffraction spectroscopy
XPS: X-ray Photoelecton spectroscopy BET: Brunauer-Emmett-Teller
BJH: Barrett-Joyner-Halenda
xi CV: Cyclic Voltammetry
GCD: Galvanostatic Charge/Discharge
EIS: Electrochemical Impedance Spectroscopy Rct: Charge Transfer Resistance
1
Chapter 1. Introduction
1.1 Electrochemical Capacitors
1.1.1 Classification of Electrochemical Capacitors
There has been growing demand for high-power energy storage systems for use in diverse applications such as hybrid electric vehicles, personal electronics, and industrial power backups.[1-7] Recent attention has focused on electrochemical capacitors (ECs, also called supercapacitors) to address these demands. ECs are promising new energy storage systems because of their high power density, long cycle life, short charging time, good safety, and simple mechanism. ECs can be classified as electrical double-layer capacitors (EDLC) and Faradaic redox reaction pseudo-capacitors on the basis of their electrode materials and the charge storage mechanism. In general, the energy density for an EC based on the pseudo- Faradaic process is higher than that of an EDLC owing to redox electron movements through the electrode materials. Transition metal oxides and conducting polymers have been used as the electrode materials of pseudo-capacitors to enhance the energy density.[8-13]
2
1.1.2 Electrospinning Method
Electrospinning has been used for many years to generate one-dimensional (1D) inorganic nanomaterials with controllable morphologies because it is a simple and cost- effective process. More importantly, electrospun nanofibers (NFs) possess extremely high surface-to-volume ratios due to their ultra-long lengths and the porous structure that was formed during heat treatment. One-dimensional NFs fabricated by electrospinning are of increasing interest in energy devices for the following reasons. First, the 1D geometry permits efficient electron transport along the longitudinal direction. Second, the 1D structure increases the ion flux at the interface between the active material and the electrode because of the large surface-to-volume ratio with the electrolyte and the reduced ion diffusion length.[14-19]
1.1.3 Organic/Inorganic Composite Materials
Transition metal oxides, such as vanadium oxide, ruthenium oxide, copper oxide, cobalt oxide, manganese oxide, and nickel oxide, have been qualified as electrochemical capacitor materials.[20-33] Among them, nickel oxide (NiO) is one of the most important because of its low cost and high theoretical capacitance (2584 F g–1 within 0.5 V), which is similar to
3
that of amorphous RuO2. However, a large specific volume change occurs in the electrode matrix of the metal oxide during the cycling process, thus, leads to pulverization of the electrodes and rapid capacity decay. High resistivity is also another drawback of ECs for practical applications. Therefore, several studies have combined metal oxide and carbon- based materials to improve the cyclability and reduce the resistivity of ECs compared with pristine metal oxides.[34-46] For example, Quinting et al. synthesized V2O5/PPy core/shell NFs using liquid-phase oxidation polymerization.[47] Bing et al. fabricated NiO/graphene composites by exploiting a charge interaction between the metal precursor and graphene oxide followed by heat treatment. [48] However, these approaches have problems that are thickness control of decorated layer and complex fabrication steps.
4
1.2 Objective of this study
In this study, we fabricated amorphous carbon-coated nickel oxide nanofibers (NiC NFs) via electrospinning, vapor deposition polymerization (VDP), and carbonization. The thickness of the coating was controlled by adjusting the concentration of the initiator solution.
The specific capacitance of the NiC NFs was ca. 288 F g–1, which is higher than that of pristine NiO NFs (ca. 220 F g–1); the NiC NFs also displayed better cyclability. The coated amorphous carbon layers limited degradation of the NiO structure and enhanced the specific capacitance because of its EDLC ability. Furthermore, this fabrication method can also be applied to other metal oxides to improve its electrochemical properties and cyclic abilities.
5
Chapter 2. Experimental
2.1 Materials
Poly (vinylpyrrolidone) (PVP, Mw = 1,300,000), nickel(II) acetate tetrahydrate (NiAc2·4H2O), pyrrole (98 %), and iron(III) chloride (FeCl3) were purchased from Aldrich Chemical Co. N,N-Dimethylformamide (DMF, Aldrich) was used as the solvent for the PVP.
6
2.2 Fabrication of the hybrid NiO NFs
In a typical synthesis, a PVP solution was prepared by dissolving 0.9 g of PVP and 0.3 g of nickel acetate in 9 mL of DMF at 60 °C for 1 h with vigorous stirring. The viscous solution was then injected into the electrospinning instrument by a syringe and delivered by a syringe pump (KD Scientific, USA) at a 10-µL/min flow rate. The diameter of the needle was 0.1 mm and was linked to the positive terminal of a power supply to provide a high voltage, i.e., 15 kV at 15 cm from the collector. The electrospun NFs were heated at 5 °C min–1 to the calcination temperature of 600 °C, where they were held for 1 h. These as- prepared NiO NFs were soaked in various concentrations of ethanolic FeCl3 solutions. They were then exposed to pyrrole monomer vapor for 5 min at room temperature in vacuo to form NiP NFs. These were then heated at 5 °C min–1 in flowing argon gas to 400 °C, where they were held for 2 h to complete the carbonization.
7
2.3 Characterization of the hybrid NiO NFs
FE-SEM images of the synthesized hybrid NFs were obtained with a JEOL 6700 instrument. TEM and HR-TEM images were obtained with JEOL JEM-200CX and JEOL JEM-2010F microscopes, respectively. Samples of nanomaterials were dispersed in ethanol and cast onto copper grids. XPS and XRD spectra were obtained using JPS-9000MS (JEOL, Mg Kα X-ray source) and M18XHF-SRA (Rigaku, SmartLab, λ = 1.5418 Å) spectrometers, respectively. Raman spectra were recorded using an FRA 1106/S FT-Raman (Bruker) spectrometer with 1064-nm laser excitation. Samples for Raman analysis were dried in a vacuum oven for 12 h at room temperature. BET surface areas and BJH pore size distributions were measured with an ASAP 2010 analyzer (Micrometrics).
8
2.4 Evaluation of the Electrochemical Electrodes
The working electrode for an electrochemical capacitor was fabricated by mixing 2.5 mg of the as-prepared samples and 0.15 mg of poly(vinylidene fluoride) (PVDF) as a binder with a moderate amount of N-methyl-2-pyrrolidone (NMP) to make a homogeneous paste.
Additionally, PPy nanotubes (PPy NTs) and carbon nanotubes (CNTs) fabricated by hard template with 100 nm diameter and 15 nm thickness were also used as working electrode materials.[49-51] The mixture was applied to a 1 x 1 cm2 of stainless-steel mesh (SUS 304) and dried in an oven at 60 °C. The electrochemical properties of the NiC NFs were measured in a three-electrode cell that used platinum wire (CH Instruments, Inc.) as a counter electrode, Ag/AgCl as reference electrode (Ag+ = 0.01M, + 0.682 V vs. NHE), and the NiC hybrid paste as the working electrode in 1 M KOH electrolyte solution. Cyclic voltammetry (CV) tests were conducted between -0.3 and 0.2 V vs. Ag/Ag+ at various scan rate (10 to 100 mV s–1). Galvanostatic charge/discharge (GCD) experiments were also performed from -0.3 to 0.2 V vs. Ag/Ag+ at various current density (0.3 to 10 A g–1). Long-term cycling performance was assessed by GCD testing at a current density of 0.3 A g–1 over 3000 cycles. Nyquist plots were obtained from 100 kHz to 10 mHz using a Zahner Electrik IM6 analyzer. Fitting
9
software (ZMAN 2.3) was used to extract significant data from the plots.
10
Chapter 3. Results and discussion
3.1 Fabrication of the Hybrid NiO NFs
Figure 1 illustrates the overall procedure for the fabrication of NiC NFs via electrospinning, vapor deposition polymerization (VDP), and carbonization. First, a PVP solution contained the NiO precursor (NiAc2·4H2O) was electrospun onto the collector at a constant voltage and heated at 5 °C min–1 to 600 °C, and held at this temperature for 1 h to achieve calcination. These as-prepared pristine NiO NFs were 90 nm in diameter and were aggregate-free (Figure 2a). The NiO NFs were then dipped into ethanol solutions containing various concentrations of FeCl3. As a result, Fe cations were adsorbed on the NiO surfaces because of a charge–charge interaction between Fe3+ ions and the partial negative charge of the oxygen atoms in the NiO structure (Figure 4). When sufficient Fe cations were absorbed, the surface was exposed to pyrrole monomer vapor. Polymerization occurred via chemical oxidation polymerization on the NiO NFs surface.[52] The fabricated 100-nm-diameter PPy- coated NiO nanofibers (NiP NFs) had a 5-nm-thick PPy coating (Figure 2b).
Furthermore, there was no aggregation of the coated nanofibers despite the
11
polymerization steps; that is because the Fe cations were uniformly dispersed over the NiO surfaces. Moreover, the thickness of the PPy coating correlated with the initiator concentration. Figure 3a–c shows transmission electron microscope (TEM) and high- resolution transmission electron microscope (HR-TEM) images of hybrid NFs with PPy coatings of different thicknesses on the NiO NFs surfaces. The coating thickness increased from ca. 5 to ca. 15 nm with increasing initiator concentration from 1 to 10 wt% (the NiP NFs with 5-, 10-, and 15-nm-thick coatings are denoted NiP_L, NiP_M, and NiP_H, respectively). The as-prepared NiP NFs were then carbonized at 400 °C for 1 h in an argon atmosphere to obtain the NiC NFs (Figure 3d–f). The carbonization was carried out at 400 °C because the amorphous carbon membrane detached from the NiO surfaces at higher temperatures (Figure 5). Additionally, the thickness of the coated layer decreased slightly as the PPy layer was converted into amorphous carbon during carbonization (the NiC NFs with 3-, 7-, and 13-nm-thick coatings are denoted NiC_L, NiC_M, and NiC_H, respectively).
12
Figure 1.Illustrative diagram for the fabrication of amorphous carbon-coated NiO nanofibers.
13
Figure 2. FE-SEM and TEM (inset) images of (a) pristine NiO NFs with a diameter of ca. 90 nm and (b) PPy coated NiO NFs with a diameter of ca.100 nm (coated PPy layer thickness is ca. 5 nm).
14
Figure 3.TEM and HR-TEM (inset) images of various thickness of PPy-coated NiO NFs of (a) ca. 5 nm (NiP_L), (b) ca. 10 nm (NiP_M) and (c) ca. 15 nm (NiP_H), and amorphous carbon-coated NiO NFs of (d) ca. 3 nm (NiC_L), (e) ca. 7 nm (NiC_M) and (f) ca. 13 nm (NiC_H), respectively.
15
Figure 4. Illustration of the chemical oxidation polymerization process on the NiO NFs surfaces.
16
Figure 5. TEM and HR-TEM (inset) images of NiC NFs cabonized at (a) 500 °C and (b) 600 °C for 1 h with argon flow.
17
3.2 Characterization of the Hybrid NiO NFs
3.2.1 X-ray diffraction (XRD) and Raman spectroscopy of the hybrid NiO NFs
Crystal structures were determined by powder X-ray diffraction (XRD) analysis (Figure 6a). The XRD spectrum of the pristine NiO NFs matched the standard spectrum of cubic NiO (JCPDS 4-0835). The formation of crystalline NiO NFs was revealed by the diffraction peaks at 2θ values of 37.28, 43.30, 62.92, 75.44, and 79.39°, which correspond to (111), (200), (220), (311), and (222) of the cubic phase. Additionally, these peaks were also found for other hybrid NFs, indicating that the NiO structure was maintained through the VDP and heat treatment. The broad peak at about 2θ = 24° for the NiP NFs indicated formation of PPy; this peak derives from scattering by the PPy chains at the interplanar spacing. The NiC NF spectrum shows a broad peak at about 2θ = 23° indicating an amorphous carbon phase;
however, this peak is similar to that for PPy. Thus, the IG/ID ratio from the Raman spectra was used to further characterize the coatings (Figure 6b). This ratio is higher for NiC NFs (ca.
1.1) than for NiP NFs (ca. 0.8), and the peaks for NiC NFs are sharper than those for NiP
18
NFs. These findings confirm that the PPy layer was successfully converted into amorphous carbon through the carbonization process.
19
Figure 6. (a) X-ray diffraction (XRD) patterns and (b) Raman spectroscopy of pristine NiO NFs (black), NiP NFs (blue), and NiC NFs (red).
1000 1250 1500 1750 2000 Raman shift (cm-1)
Intensity (a.u.)
NiP NFs (IG/ID= 0.8)
D G
NiC NFs (IG/ID= 1.1)
NiO NFs
20 40 60 80
NiO NFs
2θ / degree Intensity (a.u.) (200)(111)
(220)
(311)(222)
NiO of cubic phase( )
NiP NFs NiC NFs
(a)
(b)
20
3.2.2 X-ray photoelectron spectroscopy of the hybrid NiO NFs
The chemical composition of each sample was studied by X-ray photoelectron spectroscopy (XPS). The complete spectra demonstrate that C, O, N, and Ni atoms were present in the hybrid NiO NFs, whereas pristine NiO NFs were N-free and contained only C, O, and Ni (Figure 7a). The N 1s atom peak is attributed to nitrogen atoms from the pyrrole component. The high-resolution XPS spectrum of the Ni 2p3/2 region around 850 eV is shown in Figure 7b. This band was deconvoluted into three components as follows. The first peak located at a binding energy of 853.7 eV matched Ni2+ in the standard Ni–O octahedral bonding arrangement in cubic rocksalt NiO. The second peak centered at 860.8 eV is attributed to a shake-up process in the NiO structure. The third peak located at 855.5 eV is attributed to the Ni2+ vacancy-induced Ni3+ ion or nickel hydroxides and oxyhydroxides.
Compared to pristine NiO NFs, the Ni 2p3/2 peaks for the hybrid NiO NFs were unchanged, implying that the PPy coating and carbonization did not change the structure of the NiO NFs.
Figure 7c shows the high-resolution C 1s spectra of NiP NFs. Three components were observed at 283.9, 284.4, and 284.9 eV, indicating the presence of C=C, C–C, and C–N groups in the PPy structure, respectively. NiC NFs displayed a major peak at 284.6 eV,
21
which is ascribed to graphitic sp2 carbon, and two additional peaks at 285.5 and 287.9 eV, which are assigned to C–O and C–N, respectively (Figure 7d). Thus, it can be concluded that the NiO structure maintained its crystallinity during the VDP and carbonization steps, additionally, amorphous carbon comes from PPy were synthesized using the heat treatment.
22
Figure 7. XPS patterns of (a) fully scanned spectra of pristine NiO NFs (black), NiP NFs (blue), and NiC NFs (red). High resolution spectrum of (b) Ni 2p3/2 for hybrid NiO NFs (pristine NiO NFs: black; NiP NFs: blue; NiC NFs: red), and C 1s for (c) NiP NFs and (d) NiC NFs.
23
3.3.3 BET and BJH measurements of the hybrid NiO NFs
Brunauer–Emmett–Teller (BET) and Barrett–Joyner–Halenda (BJH) measurements were performed to confirm the surface area and pore size distributions of the hybrid NiO NFs (Figure 8). Starting from 118 m2 g–1 for the pristine NiO NFs, the surface area increased to 144 m2 g–1 for the NiC_L NFs due to formation of small pores during the VDP and heat treatment. The pore size distribution of the hybrid NFs showed the same main peak at ca. 10 nm, which is attributed to the NiO structure. This presence of peak for the hybrid NFs confirms that the NiO structure was well maintained through the VDP and heat treatment.
However, other peaks were observed for the coatings on the NiO surfaces. For the NiP NFs, ca. 4-nm-diameter pores were found, which derived from the VDP process. Other small
pores (ca. 2 nm in diameter) were found for the NiC NFs, derived from the carbonization process. The BET and BJH data of other hybrid NFs were suggested in the Figure 9.
Furthermore, calculated surface area of hybrid NiO NFs also displayed in Table 1. Thus, it can be concluded that these small pores were generated by structural changes in the coating layer during the heating process.
24
Figure 8. Brunauer-Emmett-Teller (BET) measurement and Barett-Joyner-Halenda (BJH) pore size distribution curve (inset) of (a) pristine NiO NFs, (b) NiP_L NFs and (c) NiC_L NFs.
0.0 0.2 0.4 0.6 0.8 1.0 0
20 40 60 80
0 10 20
0.0 0.2 0.4 0.6 0.8 1.0 0
20 40 60 80
0 10 20
(c)
Relative pressure (P/P0) Volume adsorbed (cm3/g)
Pore diameter (nm) Pore volume (cm3/g)
(b)
Relative pressure (P/P0) Volume adsorbed (cm3/g)
Pore diameter (nm) Pore volume (cm3/g)
(a)
Relative pressure (P/P0) Volume adsorbed (cm3/g)
Pore diameter (nm) Pore volume (cm3/g)
0.0 0.2 0.4 0.6 0.8 1.0 0
20 40 60 80
0 10 20
25
Figure 9. BET and BJH (inset) of polypyrrole coated NiO NFs with (a) low, (b) medium, (c) high thickness coating layer, and amorphous carbon-coated NiO NFs with (d) low, (e) medium, (f) high thickness coating layer.
0.0 0.2 0.4 0.6 0.8 1.0 0
20 40 60 80
(b)
Relative pressure (P/P0) Volume adsorbed (cm3/g)
Pore diameter (nm) Pore volume (cm3/g)
0 10 20
NiP_M
0.0 0.2 0.4 0.6 0.8 1.0 0
20 40 60 80
(c)
0 10 20
Relative pressure (P/P0) Volume adsorbed (cm3/g)
Pore diameter (nm)
Pore volume (cm3/g) NiP_H
0.0 0.2 0.4 0.6 0.8 1.0 0
20 40 60 80
0 10 20
(e)
Relative pressure (P/P0) Volume adsorbed (cm3/g)
Pore diameter (nm)
Pore volume (cm3/g) NiC_M
Pore diameter (nm) Pore volume (cm3/g)
0.0 0.2 0.4 0.6 0.8 1.0 0
20 40 60 80
0 10 20
(f)
Relative pressure (P/P0) Volume adsorbed (cm3/g) NiC_H
0.0 0.2 0.4 0.6 0.8 1.0 0
20 40 60 80
0 10 20
(d)
Relative pressure (P/P0) Volume adsorbed (cm3/g)
Pore diameter (nm)
NiC_L
Pore volume (cm3/g)
0.0 0.2 0.4 0.6 0.8 1.0 0
20 40 60 80
(a)
0 10 20
Relative pressure (P/P0) Volume adsorbed (cm3/g)
Pore diameter (nm)
Pore volume (cm3/g) NiP_L
26
Table 1. Coating layers thickness and surface area of each sample.
Sample Coating layer thickness (nm)
Surface area (m2 g-1)
Pristine NiO NFs - 118
NiP_L 5 136
NiP_M NiP_H
10 15
123 117
NiC_L 3 144
NiC_M 7 130
NiC_H 12 124
27
3.3 Electrochemical capacitance of the hybrid NiO NFs
3.3.1 Electrochemical performance of the hybrid NiO NFs
Cyclic voltammetry (CV) and galvanostatic charge/discharge (GCD) tests were used to measure the electrochemical properties using a three-electrode cell system (Figure 10). The various hybrid NiO NFs were tested under the same experimental conditions, and a polymeric binder (poly(vinylidene fluoride) (PVDF)) was used to prepare the electrode.
Additionally, PPy NTs and CNTs fabricated by hard tamplate method with 100 nm/15 nm diameter/thickness were also used to compare electrocapacity of hybrid NiO NFs (Figure 11).[49-51] CV curves were obtained at a scan rate of 10 mV s–1 in the voltage window range of -0.3 to 0.2 V using 1 M KOH aqueous electrolyte solution. Figure 10a shows the CV curves of PPy NTs, CNTs and pristine NiO NFs. The area under the CV curve was greater for pristine NiO NFs than for PPy NTs and CNTs, indicating that metal oxide has high capacitance. Figure 10b shows the CV curves of various hybrid NiP NFs with controlled PPy coating layer thickness. The CV curves area of NiP_L was larger than pristine NiO NFs due to following reasons. First, the formation of PPy porous layer acted as ion channels to react
28
NiO surface with electrolyte as pseudo-capacitor materials. Second, PPy layer acted as electrochemical capacitor materials owing to its own capacitance. However, the growth of the PPy coating layer led to a decrease in the area under the CV curve. This is because the thicker coating layer decreased the efficient penetration of electrolyte from the bulk solution to the surface of the NiO NFs for ion exchange. Nevertheless, thicker layer coated NiO NFs showed higher CV curve area than that of PPy NTs owing to synergetic capacitance effect of NiO NFs. Furthermore, the CV curves of the pristine NiO and hybrid NiP NFs were quasi- rectangular in shape, indicating a Faradaic pseudo-capacitance. The tendency in the area under CV curves of NiC NFs is similar to that for the NiP NFs, i.e., increased thickness of the amorphous carbon coating layer led to a smaller area under the CV curve (Figure 10c).
Interestingly, this area is greater for NiC NFs than for NiP NFs because of changes in the coating layer structure with the additional formation of new ion channels during heat treatment. Moreover, this tendency was also shown with various voltage scan rate (10 to 100 mV s-1) (Figure 12).
GCD measurements were obtained for more accurate information concerning the specific capacitances. The voltage window range was chosen by taking into account the CV curve (0.5 V) with the current density at a fixed 0.3 A g–1 to compare the performances of hybrid
29
NiO NFs. Figure 7d show the charge/discharge times of the pristine NiO NFs (ca. 737 s) were longer than for the PPy NTs (ca. 320 s) and CNTs (ca. 395 s). Furthermore, hybrid NiO NFs with thin coating layer (ca. 800 s for NiP_L and ca. 1000 s for NiC_L) were longer than for the pristine NiO NFs (Figure 10e and f). This is due to the thinness of the PPy and amorphous carbon layers, which have their own specific capacitances and small ion transfer channels that can transport ions from the electrolyte to the NiO NFs surface. However, the specific capapcitance of the hybrid NiO NFs with thicker layers were between pristine NiO NFs and PPy NTs/CNTs, because the increased coating layers interfere with ion transfer.
Furthermore, this tendency was also shown with various current (0.3 to 10 A g-1) (Figure 13).
30
Figure 10. CV curves (scan rate : 10 mV s–1) and galvanostatic charge/discharge cur ves (current density : 0.3 A g–1) of (a), (d) PPy NTs (orange), CNTs (purple) and pr istine NiO NFs (black), and (b), (e) various NiP NFs (NiP_L: red; NiP_M: blue; NiP _H: green), and (c), (f) various NiC NFs (NiC_L: red; NiC_M: blue; NiC_H: green).
-0.3 -0.2 -0.1 0.0 0.1 0.2 -2
-1 0 1 2
NiC_L NiC_M NiC_H
E (V vs Ag/AgCl)
I (A/g)
(c)
0 200 400 600 800 1000 -0.3
-0.2 -0.1 0.0 0.1
0.2 NiC_L
NiC_M NiC_H
(f)
Time (s)
E (V vs Ag/AgCl)
-0.3 -0.2 -0.1 0.0 0.1 0.2 -2
-1 0 1 2
NiO CNTs PPy NTs
E (V vs Ag/AgCl)
I (A/g)
(a)
-0.3 -0.2 -0.1 0.0 0.1 0.2 -2
-1 0 1 2
NiP_L NiP_M NiP_H
E (V vs Ag/AgCl)
I (A/g)
(b)
0 200 400 600 800 1000
-0.3 -0.2 -0.1 0.0 0.1
0.2 NiO
CNTs PPy NTs
(d)
Time (s)
E (V vsAg/AgCl)
0 200 400 600 800 1000
-0.3 -0.2 -0.1 0.0 0.1
0.2 NiP_L
NiP_M NiP_H
(e)
Time (s)
E (V vs Ag/AgCl)
31
Figure 11. TEM images of (a) PPy NTs and (b) CNTs fabricated by hard template method.
32
Figure 12. CV curves with various scan rate (10 to 100 mV s-1) of (a) PPy NTs, (b) CNTs, (c) pristine NiO NFs, (d) NiP_L, (e) NiP_M, (f) NiP_H, (g) NiC_L, (h) NiC _M and (i) NiC_H.
-0.3 -0.2 -0.1 0.0 0.1 0.2 -15
-10 -5 0 5 10 15
10 mV s-1 30 mV s-1 50 mV s-1 100 mV s-1
E (V vs Ag/AgCl)
I (A/g)
(a)
PPy NTs
-0.3 -0.2 -0.1 0.0 0.1 0.2 -15
-10 -5 0 5 10 15
10 mV s-1 30 mV s-1 50 mV s-1 100 mV s-1
E (V vs Ag/AgCl)
I (A/g)
(b) CNTs
-0.3 -0.2 -0.1 0.0 0.1 0.2 -15
-10 -5 0 5 10 15
10 mV s-1 30 mV s-1 50 mV s-1 100 mV s-1
E (V vs Ag/AgCl)
I (A/g)
(c) NiO
-0.3 -0.2 -0.1 0.0 0.1 0.2 -15
-10 -5 0 5 10 15
10 mV s-1 30 mV s-1 50 mV s-1 100 mV s-1
E (V vs Ag/AgCl)
I (A/g)
(d) NiP_L
-0.3 -0.2 -0.1 0.0 0.1 0.2 -15
-10 -5 0 5 10 15
10 mV s-1 30 mV s-1 50 mV s-1 100 mV s-1
E (V vs Ag/AgCl)
I (A/g)
(e) NiP_M
-0.3 -0.2 -0.1 0.0 0.1 0.2 -15
-10 -5 0 5 10 15
10 mV s-1 30 mV s-1 50 mV s-1 100 mV s-1
E (V vs Ag/AgCl)
I (A/g)
(f) NiP_H
-0.3 -0.2 -0.1 0.0 0.1 0.2 -15
-10 -5 0 5 10 15
10 mV s-1 30 mV s-1 50 mV s-1 100 mV s-1
E (V vs Ag/AgCl)
I (A/g)
(I) NiC_H
-0.3 -0.2 -0.1 0.0 0.1 0.2 -15
-10 -5 0 5 10 15
10 mV s-1 30 mV s-1 50 mV s-1 100 mV s-1
E (V vs Ag/AgCl)
I (A/g)
(h) NiC_M
-0.3 -0.2 -0.1 0.0 0.1 0.2 -15
-10 -5 0 5 10 15
10 mV s-1 30 mV s-1 50 mV s-1 100 mV s-1
E (V vs Ag/AgCl)
I (A/g)
(g) NiC_L
33
Figure 13. Galvanostatic charge/discharge with various current density (0.3 to 10 A g
-1) of (a) PPy NTs, (b) CNTs, (c) pristine NiO NFs, (d) NiP_L, (e) NiP_M, (f) NiP_
H, (g) NiC_L, (h) NiC_M and (i) NiC_H.
0 200 400 600 800 1000
-0.3 -0.2 -0.1 0.0 0.1
0.2 0.3 A g-1
1 A g-1 3 A g-1 7 A g-1 10 A g-1
(a)
Time (s)
E (V vs Ag/AgCl)
PPy NTs
0 200 400 600 800 1000
-0.3 -0.2 -0.1 0.0 0.1 0.2
0.3 A g-1 1 A g-1 3 A g-1 7 A g-1 10 A g-1
(b)
Time (s)
E (V vs Ag/AgCl)
CNTs
0 200 400 600 800 1000
-0.3 -0.2 -0.1 0.0 0.1
0.2 0.3 A g-1
1 A g-1 3 A g-1 7 A g-1 10 A g-1
(c)
Time (s)
E (V vs Ag/AgCl)
NiO
0 200 400 600 800 1000
-0.3 -0.2 -0.1 0.0 0.1
0.2 0.3 A g-1
1 A g-1 3 A g-1 7 A g-1 10 A g-1
(d)
Time (s)
E (V vs Ag/AgCl)
NiP_L
0 200 400 600 800 1000
-0.3 -0.2 -0.1 0.0 0.1
0.2 0.3 A g-1
1 A g-1 3 A g-1 7 A g-1 10 A g-1
NiC_L (g)
Time (s)
E (V vs Ag/AgCl)
0 200 400 600 800 1000
-0.3 -0.2 -0.1 0.0 0.1
0.2 0.3 A g-1
1 A g-1 3 A g-1 7 A g-1 10 A g-1
NiP_H (f)
Time (s)
E (V vs Ag/AgCl)
0 200 400 600 800 1000
-0.3 -0.2 -0.1 0.0 0.1
0.2 0.3 A g-1
1 A g-1 3 A g-1 7 A g-1 10 A g-1
NiP_M (e)
Time (s)
E (V vs Ag/AgCl)
0 200 400 600 800 1000
-0.3 -0.2 -0.1 0.0 0.1
0.2 0.3 A g-1
1 A g-1 3 A g-1 7 A g-1 10 A g-1
NiC_M (h)
Time (s)
E (V vs Ag/AgCl)
0 200 400 600 800 1000
-0.3 -0.2 -0.1 0.0 0.1
0.2 0.3 A g-1
1 A g-1 3 A g-1 7 A g-1 10 A g-1
NiC_H (i)
Time (s)
E (V vs Ag/AgCl)
34
3.3.2 Specific capacitance of the hybrid NiO NFs with various current density and scan rate
Figure 14a shows the calculated specific capacitances of Ppy NTs, CNTs, pristine NiO NFs and various hybrid NiO NFs by galvanostatic discharge time with 0.3 A g-1 of current density. By reference to PPy NTs (102 F g–1), CNTs (121 F g–1) and pristine NiO NFs (221 F g–1), the capacitances of the NiP NFs were 243, 167, and 134 F g–1 for NiP_L, NiP_M, and NiP_H, respectively. The NiC NFs followed the same trend, i.e., NiC_L (288) > NiC_M (179)
> NiC_H (147).
Figure 14b show the calculated specific capacitance of hybrid NiO NFs with various current density (-0.3 to 10 A g-1). The high current density is a very important factor for the industrial devices to get high power density. According to the current density increased, the specific capacitance was decreased due to high current density prevent the accessibility of electrilyte ions form bulk to sample surface. The retainability with different current density of the hybrid NiO NFs with thin coating layers (ca. 82 %) has better retention in comparison with pristine NiO NFs (ca. 69 %), PPy NTs (ca. 79 %) and CNTs (ca. 80 %). Futhermore, the specific capacitance retainability of other hybrid NiO NFs was suggested in Figure 15. In
35
addition, specific capacitance change with different voltage scan rate also same tendency as shown in Figure 16. As a result, hybrid NiO NFs have improved rate capability, which is important for high power density.