저작자표시-비영리-변경금지 2.0 대한민국 이용자는 아래의 조건을 따르는 경우에 한하여 자유롭게
l 이 저작물을 복제, 배포, 전송, 전시, 공연 및 방송할 수 있습니다. 다음과 같은 조건을 따라야 합니다:
l 귀하는, 이 저작물의 재이용이나 배포의 경우, 이 저작물에 적용된 이용허락조건 을 명확하게 나타내어야 합니다.
l 저작권자로부터 별도의 허가를 받으면 이러한 조건들은 적용되지 않습니다.
저작권법에 따른 이용자의 권리는 위의 내용에 의하여 영향을 받지 않습니다. 이것은 이용허락규약(Legal Code)을 이해하기 쉽게 요약한 것입니다.
Disclaimer
저작자표시. 귀하는 원저작자를 표시하여야 합니다.
비영리. 귀하는 이 저작물을 영리 목적으로 이용할 수 없습니다.
변경금지. 귀하는 이 저작물을 개작, 변형 또는 가공할 수 없습니다.
Master of Science
Multi-hop, Multi-channel Protocol for Tree Topology in LoRa
The Graduate School of the University of Ulsan Department of Electrical & Computer Engineering
Duong Cong Tan
[UCI]I804:48009-200000173352 [UCI]I804:48009-200000173352
Multi-hop, Multi-channel Protocol for Tree Topology in LoRa
Supervisor: Professor Kim Myung-Kyun
A Thesis Submitted to
the Graduate School of the University of Ulsan In Partial Fulfillment of the Requirements
for the Degree of Master of Science
By
Duong Cong Tan
Department of Electrical & Computer Engineering Ulsan, Korea
December, 2018
Multi-hop, Multi-channel Protocol for Tree Topology in LoRa
This certifies that the master thesis of Duong Cong Tan is approved.
Committee Chair: Prof. In-Soo Koo
Committee Member: Prof. Seok-Hoon Yoon
Committee Member: Prof. Myung-Kyun Kim
Department of Electrical/Electronic & Computer Engineering Ulsan, Korea
December, 20
Acknowledgement
Firstly, I offer my gratitude to my dear parents who guided me and supported me morally and financially at every stage of my life to achieve this success. Moreover, I appreciate the kind and affection supervision of my research advisor Prof. Myung-Kyun Kim, which enabled me to complete my degree in a sophisticated way and instilled in me deep research potentials. I am thankful to all my family members, friends and colleagues whom their wishes and support helped me to get to this milestone.
Next, I would like to thank the National Research Foundation of Korea (NRF) funded by the Ministry of Education, Science and Technology for their financial support.
Moreover, I am thankful to Korean government to provide me with Brain Korea 21 (BK21) scholarship which enables me to pursue my studies, join local and international conferences and publish my research manuscripts in international journals. I would like to acknowledge my committee members for their valuable comments and for their broad perspective in redefining the ideas in this dissertation.
DUONG CONG TAN
Ulsan, December 2018
Abstract
Multi-hop, Multi-channel Protocol for Tree Topology in LoRa
BY DUONG CONG TAN
In the upcoming Internet of Things (IoT) era, smart system, such as energy management and surveillance control systems, are expected to be widely deployed in buildings, industrial area or city. New transceiver technologies have emerged which enable power efficient communication over very long distances. LoRa is one of them recently has been developed as a crucial IoT access network technology in terms of long distance and low power consumption. This technology has some feature make it different with others such as long time on air, CAD (carrier activity detection) mechanism, channel separation using different spreading factor (SF), and capture effect. Although improved communication range, some researches showed that under many real deployments there are so many obstacles that will strongly affect to communication range, so a multi-hop protocol will be efficient in not only this problem but also power efficient and reliability.
In this paper, we firstly have performed comprehensive experiment to investigate CT performance of LoRa under variation of power offsets and timing offsets in the real environment. Then we propose a scheme to construct a tree topology that included assigning channel and time slot for upward data transmission in one-time flooding. By the channel and time slot assignment in upward data transmission, we show a method to allow downward data and perform aligning cycle timing in data transmission period. With analysis power consumption in tree construction period and evaluation performance of protocol from experiment in real environment, this protocol is feasible to apply in some specific IoT applications with large coverage and high reliability.
Contents
Acknowledgement...iv
Abstract...v
1 Introduction...1
1.1 Wireless Sensor Networks...1
1.2 LoRa Communication Technology...2
1.2.1 LoRa Technology Overview...2
1.2.2 LoRa Modulation...5
1.2.3 Operation in LoRa Transceiver...6
1.3 Organization of Master Thesis...10
2 Motivations...11
3 Practical LoRa Network Simulator Using Capture Effect of Concurrent Transmission...13
3.1 Concurrent Transmission Experiment...13
1.2.1 Experiment Method...13
1.2.2 Experiment Results...15
3.2 LoRa Simulator...17
1.2.1 Collision Behavior Model...17
1.2.2 Simulator and Comparison result between using simulator and experiment under flooding protocol...18
4 Multi-hop, Multi-channel Protocol for Tree Topology in LoRa...23
4.1 LoRa Channel in Korea...23
4.2 Contention Random Delay in LoRa...24
4.3 Protocol Design...25
4.4.1 Protocol Structure...25
4.4.2 Tree Construction Period...26
4.4.2.1 Messages, Notations and Definitions...26
4.4.2.2 Construction Tree Process...29
4.4.2.3 Constraint maximum child and maximum depth...32
4.4.3 Upward Data Transmission Period...33
4.4.4 Downward Data Transmission Period...33
4.4.5 Wake-up Time Calculation...34
4.4 Performance Evaluation...36
4.4.1 Analysis power consumption in construction tree period...36
4.4.2 Experiment Evaluation...38
4.4.2.1 Experiment Setup...38
4.4.2.2 Results...40
5 Conclusion...43
List of Figures
Figure 1-1. Typical multi-hop wireless sensor network architecture [12]... 1
Figure 1-2. LoRa Physical Packet... 4
Figure 1-3. LoRa time-frequency spectrogram... 6
Figure 1-4. Data Transmission Sequence... 6
Figure 1-5. Data Reception Sequence... 7
Figure 1-6. Channel Activity Detection Sequence... 8
Figure 1-7. CAD time duration... 9
Figure 1-8. Organization of research thesis report... 10
Figure 3-1. Timing Diagram... 14
Figure 3-2. Nodes Deployment... 14
Figure 3-3. Concurrent Transmission Experiment Results... 16
Figure 3-4. LoRa Collision Behavior Model... 17
Figure 3-5. Linearization for PRR Surface... 18
Figure 3-6. Normal Flooding and Offset-CT Flooding timing diagram... 19
Figure 3-7. Nodes Deployment for Flooding experiment... 20
Figure 4-1. LoRa Contention Random Delay... 25
Figure 4-2. Protocol Structure... 26
Figure 4-3. INIT message format... 26
Figure 4-4. JOIN message format... 27
Figure 4-5. Cell format... 27
Figure 4-6. CON message format... 27
Figure 4-7. ADV message format... 28
Figure 4-8. Network Topology... 30
Figure 4-9. Tree Construction Scheme... 31
Figure 4-10. Upward Data Transmission Scheme... 33
Figure 4-11. Downward Data Transmission Scheme... 34
Figure 4-12. Clock drift between two nodes... 35
Figure 4-13. Timing Alignment... 36
Figure 4-14. Nodes Deployment... 40
Figure 4-15. Rate of number of nodes successfully joining in TCP... 41
Figure 4-16. Average number of slots used in data transmission period: (a) Node Deployment Scenar io 1; (b) Node Deployment Scenario 2... 42
List of Tables
Table 3-1. Result and Comparison between Experiment and Simulation... 22
Table 4-1. LoRa regulations in Korea... 23
Table 4-2. Time duration of messages and slots in TCP... 37
Table 4-3. Energy consumption in TCP... 38
1 Introduction
1.1 Wireless Sensor Networks
Wireless Sensor Network (WSN) is a network formed by a large number of sensor nodes where each node is equipped with a sensor and wireless communication interface to surveillance physical environment such as light, heat, pressure, etc... and then forward their data to the sink. WSNs are regarded as a revolutionary information gathering method to build the information and communication system which will greatly improve the reliability and efficiency of infrastructure systems. Compared with the wired solution, WSNs feature easier deployment and better flexibility of devices. With the rapid technological development of sensors, WSNs will become the key technology for IoT. Fig.1-1 shows the typical multi-hop wireless sensor network architecture. The data is relayed through some intermediate nodes to the sink. The sink acts as gateway to synthesize data from all sensor node to forward to the server where the data can be analyzed, visualized and observed via internet connection.
Figure 1-1. Typical multi-hop wireless sensor network architecture [12]
There are a lot of challenges when designing and deploying wireless sensor network.
Sensor nodes communicate over wireless connection without supporting from infrastructure. An additional challenge is related to the limitation of energy supply of sensor nodes due to the difficulties of changing and recharging battery. In order to prolong the longevity of the network, the protocols should be designed from the beginning with the objective of efficient management of the energy resources. WSN design issues are
mentioned in [13]. They can be summarized as follows:
· Fault Tolerance: Since nodes may run out of energy or might be damaged, or since the wireless communication between two nodes can be permanently interrupted, it is important that the WSN as a whole is able to tolerate such faults. To tolerate node failure, redundant deployment is necessary, using more nodes than would be strictly necessary if all nodes functioned correctly.
· Lifetime: In many scenarios, nodes will have to rely on a limited supply of energy (using batteries). Replacing these energy sources in the field is usually not practicable, and simultaneously, a WSN must operate at least for a given mission time or as long as possible. Hence, the lifetime of a WSN becomes a very important figure of merit.
Evidently, an energy-efficient way of operation of the WSN is necessary.
· Scalability: Since a WSN might include a large number of nodes, the employed architectures and protocols must be able scale to these numbers
· Wide range of densities: In a WSN, the number of nodes per unit area – the density of the network – can vary considerably. Different applications will have very different node densities. Even within a given application, density can vary over time and space because nodes fail or move; the density also does not have to homogeneous in the entire network (because of imperfect deployment, for example) and the network should adapt to such variations.
· Programmability: Not only will it be necessary for the nodes to process information, but also they will have to react flexibly on changes in their tasks. These nodes should be programmable, and their programming must be changeable during operation when new tasks become important. A fixed way of information processing is insufficient.
· Maintainability: As both the environment of a WSN and the WSN itself change (depleted batteries, failing nodes, new tasks), the system has to adapt. It has to monitor its own health and status to change operational parameters or to choose different trade- offs (e.g. to provide lower quality when energy resource become scarce). In this sense, the network has to maintain itself; it could also be able to interact with external maintenance mechanisms to ensure its extended operation at a required quality.
1.2 LoRa Communication Technology
1.2.1 LoRa Technology Overview
LoRa [1] is one of preeminent communication technologies in term of long transmission range and low power which is specifically designed by SemTech to meet the
needs of the Internet of Things. With using narrow band to counter interference and special modulation technique, LoRa receiver can decode transmissions 19.5 dB below noise floor.
That allows very long communication distances. The displayed communication range of LoRa is more than 15 km for suburban environments. From a research of Petajajarvi [2]
addressed a range of 15 km to 30 km in a city, where the transmitter was on the roof of car, and in a boat on open water, meanwhile the receiver was deployed in a 24 m tall tower.
Nowadays, many kinds of LoRa transceiver available can operate between 137 MHz to 1020 MHz such as SX1276. Especially SX1280 provide ultra-long range communication in the 2.4 GHz with the linearity to withstand heavy interference. This makes them the ideal solution for robust and reliable wireless solutions.
Carrier frequency is the center of frequency that can be programmed in steps of 61 Hz between 127 MHz to 1020 MHz. Depending on LoRa transceiver particular, it can provide different frequency ranges such as: SX1272: 860 MHz to 1020 MHz, SX1276: 137 MHz to 1020 MHz.
Bandwidth is the width of frequency in the transmission band. Higher BW gives a higher data rate (thus shorter time on air), but a lower sensitivity (because of integration of additional noise). A lower BW gives a higher sensitivity, but a lower data rate. LoRa chip typically has three programmable bandwidth settings: 500 kHz, 250 kHz, 125 kHz.
Transmission Power on LoRa radio chip can be adjusted from -4 dBm to 20 dBm in 1 dB steps. But due to limitation in hardware implementation, the range often limited to 2 dBm to 20 dBm.
Spreading Factor is ratio between the symbol rate and chip rate. A higher spreading factor increases the Signal to Noise Ratio (SNR), and thus sensitivity and range, but also increases the air time of the packet. Radio communications with different SF are orthogonal to each other and network separation using different SF is possible.
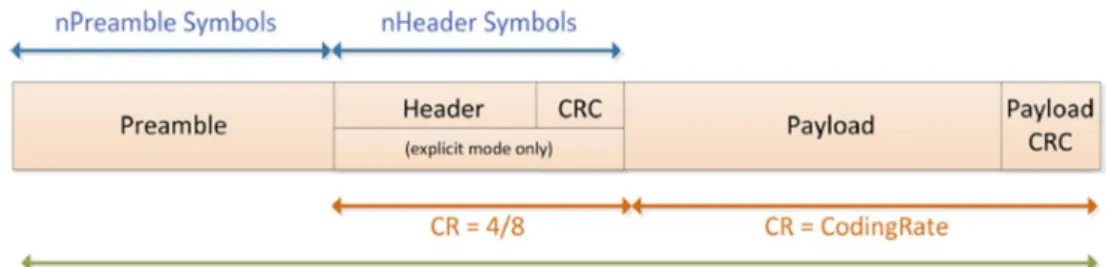
Coding rate is the FEC rate used by the LoRa modem that offers protection against bursts of interference, and can be set to either 4/5, 4/6, 4/7 or 4/8. A higher CR offers more protection but increases time on air. Radios with different CR (and same CF, SF and BW), can still communicate with each other if they use an explicit header, as the CR of the
payload is stored in the header of the packet.
Figure 1-2. LoRa Physical Packet
The LoRa packet structure is shown in Fig.1-2. Starting of packet is preamble, it can be programable 6 to 65535 symbols, to which the radio appends 4.25 symbols. In fact, the receiver needs at least 4 symbol time to acquire lock on a preamble, so the range of preamble as shown is reasonable. Thereafter is an optional header. There are two type of header mode: explicit mode and implicit mode. With explicit mode, header provides information on the payload including payload length, forward error correction code rate and the presence of an optional 16-bits CRC for the payload. In term of implicit mode, the payload length, coding rate and CRC presence are fixed or known in advance. They are must be manually configured on both sides of radio link. At the end of the payload an optional 16-bit CRC may be included.
The airtime of a LoRa transmission depends, besides the payload size and preamble length, on the combination of SF, BW, and CR. The LoRa packet duration is the sum of the duration of the preamble and the transmitted packet as equation (1):
= + (1)
The duration of preamble can be calculated as follows:
= + 4.25 (2)
where is the programmed preamble length.
And the duration of payload can be calculated as follows:
=
8 + max( 8 − 4 + 28 + 16 − 20
4( − 2 ) ( + 4), 0) (3)
where PL is the number of bytes of payload, SF is the spreading factor, IH = 1 when implicit header mode is enabled and IH = 0 when explicit header mode is used. DE set to 1 indicates the use of the low data rate optimization, 0 when disabled. CRC indicates the presence of the payload CRC = 1 when on 0 when off. CR is the programmed coding rate from 1 to 4.
1.2.2 LoRa Modulation
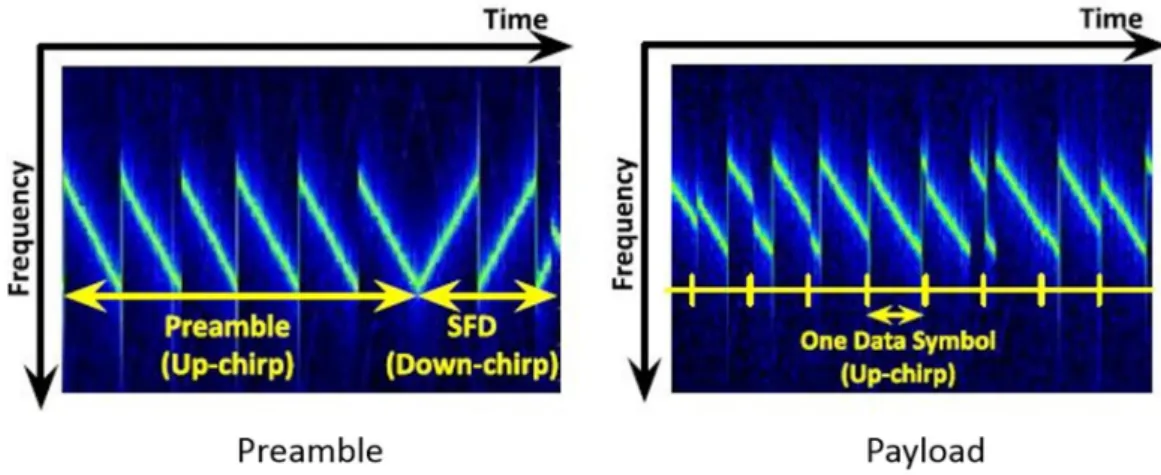
In LoRa modulation the spreading of the spectrum is achieved by generating a chirp signal that continuously varies in frequency. An advantage of this method is that timing and frequency offsets between transmitter and receiver are equivalent, greatly reducing the complexity of the receiver design. The frequency bandwidth of this chirp equivalent to the spectral bandwidth of the signal. The wanted data signal is chipped at a higher data rate and modulated onto the chirp signal. From the publication [4], it can be inferred that LoRa is a chirp-modulated high-order M-ary FSK system with the time-frequency spectrogram shown in Fig.1-3. As we know, LoRa packet consists of a series discontinuous chirp symbols, that is including: first part with several up-chirps for preamble modulation, two down-chirps in the end of preamble part for start of Frame Delimiter (SFD) and discontinuous up-chirps for payload modulation. Besides, in the some Semtech LoRa transceiver such as SX1272, SX1276, they add two symbols for SyncWord [10] which is appended at just before the down-chirp of SFD. So, the yielding number of symbols for preamble includes more 4.25 symbols long from syncword and SFD. The Syncword is for differentiating among network applications using LoRa. In each symbol, the linear up-
chirps always shift toward the positive direction with the same sloop until reaching the edge of bandwidth.
Figure 1-3. LoRa time-frequency spectrogram
1.2.3 Operation in LoRa Transceiver
a. Data Transmission Sequence
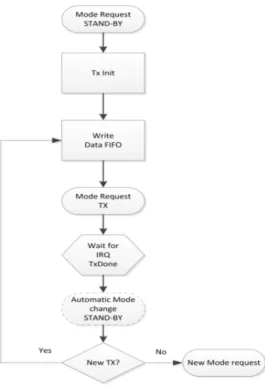
Figure 1-4. Data Transmission Sequence
The Data Transmission Sequence is displayed in detail as the Fig.1-4. for sending a data packet. Note that static configuration registers can only be accessed in Sleep mode,
Standby mode or FSTX mode. However, the LoRa FIFO buffer should only be filled in Standby mode and cannot be filled in Sleep mode. The packet actually sends when modem changes to TX mode. Upon completion the TxDone interrupt is issued and radio returns to Standby mode.
b. Data Reception Sequence
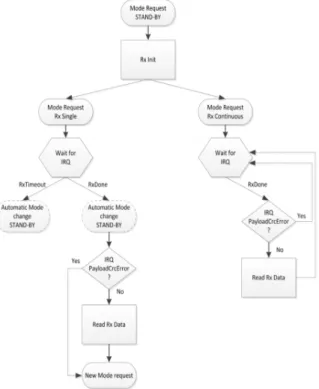
In the LoRa transceiver from Semtech [7], they provide two kind of mode to receive the packet, that are RX single mode and RX continuous mode as Fig.1-5. Before changing to RX mode, the transceiver must be set configurations same with transmitter did. In the single RX mode, the transceiver tries to receive a packet then go to standby mode automatically. In case of RX continuous mode, the receiver will automatically continue to try to receive new packet. However, at the starting of mode, transceiver tries to search the valid preamble during a given timeout duration that is set in register RegSymbTimeout for single RX mode and always scan valid preamble for continuous RX mode. In single RX mode, if a preamble has not been found at the end of the timeout window, RX_TIMEOUT interrupt happen and transceiver then go to standby mode. To detect and lock preamble, the transceiver takes at least 4 symbol time including 3 symbol time for sensing preamble and 1 symbol time for processing. That is reason why 3 symbol time offset in LoRa capture effect is critical point. Right after detecting and locking the valid preamble, transceiver will then await two down-chirps to synchronize the starting time of payload for receiving.
Figure 1-5. Data Reception Sequence
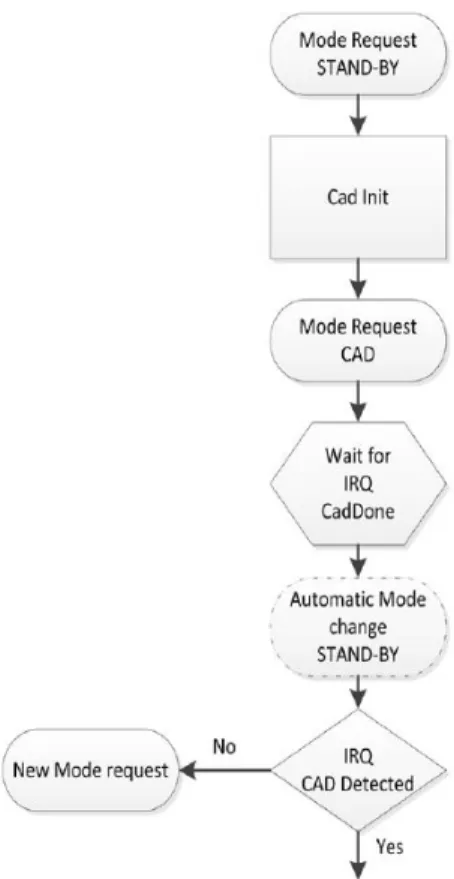
c. Channel Activity Detection (CAD) Sequence
The channel activity detection mode is designed to detect a LoRa preamble on the radio channel with the best possible power efficiency. CAD mode undergo two short phases:
sensing phase and processing phase. Once in CAD mode, the transceiver will perform a very quick scan of the band to detect a LoRa packet preamble. The sequence is shown as Fig.1-6. Once changing to CAD mode, the modem senses preamble symbol of data from channel. And then, modem stop sensing and goes to digital processing. The modem searches for a correlation between the radio captured samples and the ideal preamble waveform. This correlation process takes a little bit less than a symbol period to perform.
Once the calculation is finished the modem generates the CadDone interrupt. If the correlation was successful, the CadDetected is generated simultaneously and goes back to Standby mode.
Figure 1-6. Channel Activity Detection Sequence
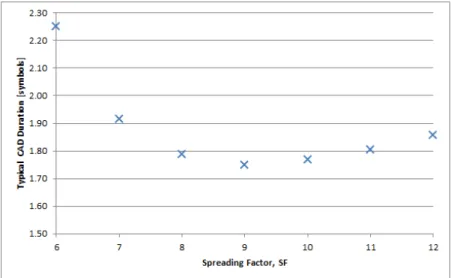
With the SX1272/74/76/77/78/79, the CAD process takes approximately 2 symbol period. The modem only requires on about 1 symbol to sense preamble:
= ( + ) seconds (4)
And correlation processing time:
= ( SF*∗ ) seconds (5) Totally:
= + (6)
The CAD process time is shown in detail as a function of spreading factor as the Fig.1-7.
Figure 1-7. CAD time duration
1.3 Organization of Master Thesis
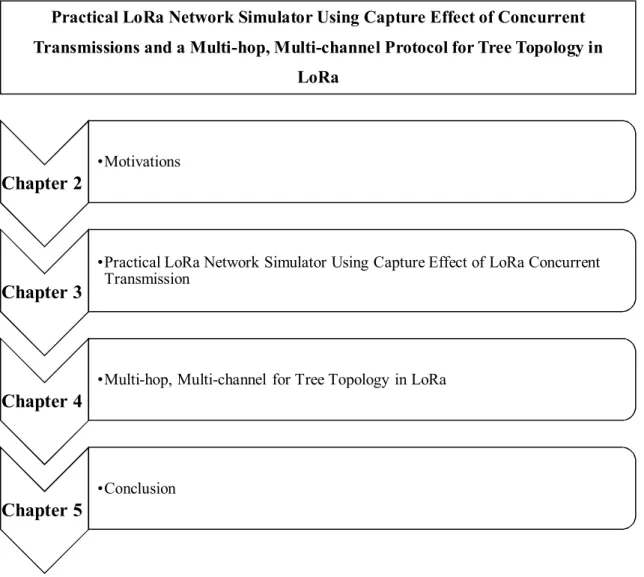
Research work for the Master thesis are organized in the given manner presented in Fig.1-8.
Figure 1-8. Organization of research thesis report
Chapter 2
•Motivations
Chapter 3
•Practical LoRa Network Simulator Using Capture Effect of LoRa Concurrent Transmission
Chapter 4
•Multi-hop, Multi-channel for Tree Topology in LoRa
Chapter 5
•Conclusion
Practical LoRa Network Simulator Using Capture Effect of Concurrent Transmissions and a Multi-hop, Multi-channel Protocol for Tree Topology in
LoRa
2 Motivations
In general, in terms of capability receiving a packet, it depends on the distance and environment and the configuration parameters set for radio chip such as SF (Spreading Factor), BW (bandwidth), and TP (transmission power). These elements affect to the Received Signal Strength Indicator (RSSI) value. In fact, a transmission is successfully received if the received signal power greater than the sensitivity threshold of the receiver.
In the simulation, the sensitivity value we use is the information in the specification of the LoRa transceiver and the value we get from the experiment. When multiple transmission signals reaching at a receiver, the Lora receiver can receive one of the signals based on the capture effect [3]. That is the phenomenon of signal reception when a receiver receives two different frequency modulated signals with unequal amplitudes at the same time. In [5] [6], they provided an experiment for capture effect in the case of power offset of two transmissions greater than 6 dB only. And based on that result, they built a simple capture effect model to determine collision. Recently, Liao et al. presented a LoRa receiver’s capturing effect under CT environment in both theory and experiment in their paper about LoRa concurrent transmission (CT) [4]. However, in their experiment they only evaluate packet reception rate (PRR) in the case two transmissions have same transmission power and timing offset from 0 to 2 symbol time. In reality, capture effect happens depending on both the power offset and timing offset. The previous researches did not consider the capture effect considering both of them.
Besides, the LoRa Public Network - LoRaWAN [16,17] typically laid out as star topology in which gateways relay messages between end-devices and a central core network server. However, some application deployed in industrial area do not want to use LoRa public network or that area do not have the public network infrastructure. Moreover, from the research [4] shows that, in spite of long transmission range, achieving extensive indoor coverage is still very difficult by a single-hop star topology unless the base stations are deployed with enough density and in proper locations. Comparing with other communication technology, LoRa has some different characteristics such as long time on air (ToA), carrier activity detection (CAD), channel separation using different spreading
factor and capture effect, so it is not efficient to simply use LoRa transceiver with existing MAC protocol and routing mechanism that have emerged in the IoT domain [5]. There are some existing researches tried to build multi-hop MAC protocol using LoRa such as LoRaBlink in [5] and LoRa multi-hop for linear network [14] with some limitations. In the LoRaBlink protocol, every node will be synchronized by listening the beacon triggered by sink node in beacon slots. In the data slots, a node has data to transmit selects the next available data slot and transmits, thus collision may happen to lead low reliability.
Synchronizing after finishing an epoch by always listening the beacon consumes more energy. In the LoRa multi-hop for linear topology, that is not suitable for the network in which every are located randomly on wide area and that take long packet latency from a node to the sink. Accordingly, in this paper, we propose a new multi-hop MAC protocol which is based on TDMA for monitoring and control application by assigning time slot and channel for each node in forming tree period.
In summary, the main contributions of this thesis are as follows:
· We have performed comprehensive experiment to investigate CT performance of LoRa under variation of power offsets and timing offsets in the real environment.
· We propose a scheme to construct a tree topology that included assigning channel and time slot for upward data transmission in one-time flooding.
· By the channel and time slot assignment in upward data transmission, we show a method to allow downward data and perform aligning cycle timing in data transmission period.
· We analyze power consumption in tree construction period and make experiment to evaluate performance of protocol in real environment. The results show that our protocol is feasible to apply in some specific IoT applications with large coverage and high reliability.
3 Practical LoRa Network Simulator Using Capture Effect of Concurrent Transmission
In this chapter, we comprehensively investigate CT performance under experiment with variance of power offset and timing offset, especially the critical timing offset point 3 symbol time at first. Then we use the insight from our practical experiment result to implement simulator for flooding protocol under a collision behavior model for LoRa using python. By making proof-of-concept experiments, this simulator is feasible for evaluating protocol performing under CT.
3.1 Concurrent Transmission Experiment
1.2.1 Experiment Method
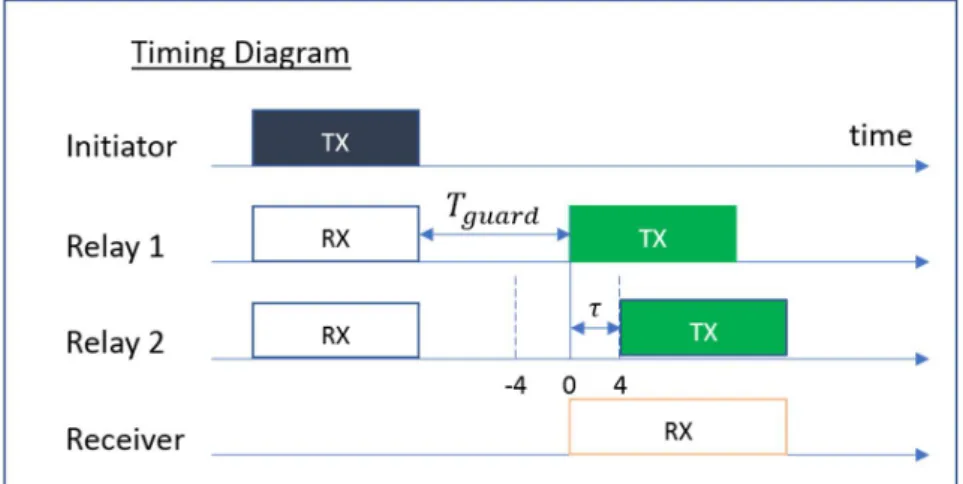
In the experiment, we use MultiTech mDot module [8] which is consist of Semtech SX1272 LoRa transceiver and a STM32F411RET processor. To checking capture effect phenomenon, we use 4 nodes including one initiator, two relay nodes and a receiver. They are deployed on the campus of university as Fig.3-2. Two relay nodes are placed close to each other to ensure that the pass loss of them to the receiver are same. The Initiator also is put near two relay nodes to guarantee two relay nodes always receive INIT message from initiator. The receiver is placed far away from two relay nodes approximately 120 m.
Besides, we chose place between receiver and two relay nodes is grass field and ran experiment overnight to reduce unstableness of environment. The configuration set is used BW 125 kHz, CR4/5, CRC enabled and 8 preamble symbols. The overview scheme operation of each node is shown in the Fig.3-1. The initiator node periodically broadcast an Init message on SF11 to synchronize timing for two relay nodes. The receiver is set RX continuous mode to always listen to receive the packet from relay nodes on SF12. Two relay nodes firstly try to receive Init message on SF11 from initiator. Right after receiving, Relay 1 is scheduled to send a packet on SF12 after guard time 300 ms with fixed transmission power 14 dBm. Different with Relay 1, Relay 2 will be scheduled after guard
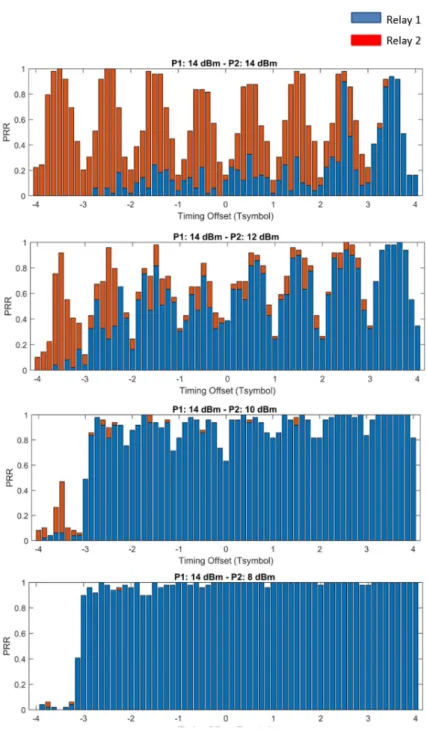
time 300 ms plus timing offset. The timing offset can be negative and is limited from -4 to 4 symbol time and is gradually increased with step 1/8 symbol time. we evaluate for each power offset 0 dB, 2 dB, 4 dB, 6 dB, 8 dB, 10 dB by setting transmission power for relay 2 as 14 dBm, 12 dBm, 10 dBm, 8 dBm, 6 dBm and 4 dBm, respectively. In total, we have 390 cases by combining 6 kinds of power offset and 65 kinds of timing offset. In each case, we measure on 100 times two relay nodes sending 5 Bytes packet. To be more accurate in term of power offset, before fixed position to run the test, we checked RSSI at receiver for each relay node sending independent to make sure that the actual power offset is same with transmission power offset.
Figure 3-1. Timing Diagram
Figure 3-2. Nodes Deployment
1.2.2 Experiment Results
The experiment results are shown in Fig.3-3 for each kind of power offset. In each bar, the blue color presents the probability receiver receive message from relay 1, and red color is probability receiver receive message from relay 2.
When 2 transmission are coming to the receiver with almost same signal strength, PRR tends to be high when the timing offset is away from the integer of symbol time and PRR is worst when timing offset is close to the integer of symbol time. In this case, as we can see at the Fig. 5, the receiver decodes most of packet from earlier one when a signal come earlier more than 3 symbol time. That means, after 3 preamble symbol time of earlier transmission, the receiver locked it and other cannot get any chance to be received even though later one can suppress the earlier one sometimes.
When the power offset gradually increases, the stronger transmission is highly received in the cases it reaches the receiver earlier or no later than 3 symbol time with the weaker transmission. But in case the stronger signal is later than 3 symbol time, the PRR is degraded significantly. It means that the receiver still wants to lock preamble of stronger signal when it has not completely locked the weaker one.
Figure 3-3. Concurrent Transmission Experiment Results
And the case power offset greater than 6 dB, receiver cannot decode any transmission in the case the stronger one is later than 3 symbol time. Contrarily, receiver totally receive packet from stronger signal or in other words, the weaker is not enough power to suppress stronger.
3.2 LoRa Simulator
1.2.1 Collision Behavior Model
Figure 3-4. LoRa Collision Behavior Model
From the insight of practical experiment result, we obviously the capture effect phenomenon in LoRa. Based on this, we can verify probability of collision happen when two signals present at receiver. The model is shown in Fig.3-4, is built using a process- based discrete-event simulation frame work on python, that is so-called as SimPy [9].
Before going to check capture effect of two signal, we must filter the case which do not make collision such as receptions separated, different frequency greater than threshold, different spreading factor are defined in [6]. In the collision behavior model, it will determine two transmission are collided at receiver or which one will be received by receiver depending power offset and timing offset. We can divide into two main case: the first is for case power offsetgreater than or equal 6 dB and second is for others case.
Figure 3-5. Linearization for PRR Surface
With first case, it easily bases on the timing offset to check the stronger signal coming later than weaker one or not. In this case, the receiver will receive the stronger one or nothing.
With second case, simulator will use random uniformly function to generate a value from 0 to 1 and then compare with the PRR which is mapped to the experiment result in Fig.3-3 based on timing offset and power offset. In fact, the timing offset and power offset cannot be exact with the cases in the Fig.3-3, so from experiment result in the section 3, we linearize to be enabled to get PRR for every possible case as Fig.3-5. When timing offset greater than 4 or less than -4 symbol time, we will scale the timing offset to the range 3 ~ 4 or -3 ~ -4 symbol time offset, respectively. Besides, we use receiving probability of each relay node in each case compare with uniform random value to determine packet from which node is received.
If we have more than 2 signals are presented at receiver, we can evaluate collision by all possible pair packet one by one. In this case the probability of collision of each packet will be increased.
1.2.2 Simulator and Comparison result between using simulator and
experiment under flooding protocol
In this part, we show proof-of-concept experiments to display feasibility of using this collision behavior model for protocol simulation. We used this model to simulate two kind of protocol normal flooding and offset-CT [4] flooding and then compare the result with experiment. They are shown in the Fig.3-6. With normal flooding, an initiator starts the first packet transmission, and the other relay nodes simply do immediate retransmission after the reception. Different with normal flooding, in the offset-CT flooding, after reception a node will in two-part delay. Part-A delay is a uniformly distributed random delay. They set the range of this random delay to be one symbol time. This delay is included in the packet. Part-B delay is a complementary delay to restore the timing alignment of each hop. Part-B delay is calculated as a symbol time minus previous Part-A delay to make the total delay fixed as one symbol time.
Figure 3-6. Normal Flooding and Offset-CT Flooding timing diagram
With these flooding protocols, we implement a simulator [11] based on SimPy, in which create LoRa nodes running parallel and independent in real-time. Every node can be placed randomly or fixed location on the map. Except for initiator in TX mode in the beginning to broadcast flooding message, other nodes is in RX mode to listen the packet.
Anytime a transmission is reached, they will push that transmission including Node Id, hop count, bandwidth, frequency, SF, RSSI value and arrival time information into overhear packet list. At the end of every transmission, the node will use collision behavior model to check collision with other transmission that is existed in overhear packet list. If the transmission is not collided with other, the node change to TX mode right away and schedule to broadcast its flooding message after time duration following design of protocol and finish flooding process. If the transmission is collied, the node continues in RX mode to try to receive flooding message from others.
A. Experiment
In this experiment, we use same module with experiment in section 3. We deployed 30 nodes and they are scattered on the campus as Fig.3-7. To avoid becoming star topology, we limit the transmission range by using SF7 and reducing transmission power to 2 dBm.
For each kind of flooding, we run 100 flooding times.
Figure 3-7. Nodes Deployment for Flooding experiment
B. Simulation
In simulation, we use same deployment with the experiment in term of distance.
However, we cannot build some obstacles as real environment. Thus, to calculate the power of signal in the receiver, we totally inherited receiver sensitivity and the path loss model from [6] in dependence of the communication distance d as following equation:
(d) = ( ) + 10 log( ) +
(7)Where:
·
(d): Is the path loss in dB.
·
( ) :
Is the mean path loss at the reference distance .· : Is the path loss exponent.
· : Is the normal distribution with zero mean and variance to account for shadowing.
We are also following their empirical measurements with reference distance 40 m and they determined in the built-up environment with the mean path loss is 127.41 dB, path loss exponent is 2.08 and σ is 3.57.
For each kind of flooding, we simulate 100 flooding times to compare with experiment results.
C. Results
The results of experiment and simulation are presented in the Table.3-1. We estimate the packet reception rate based on number of nodes do not receive any flooding message in 100 flooding times. Except for initiator, every node obviously receives one time in a flooding time in successful case. In additional, to evaluate degree of packet collision in each protocol, we focus on the average hop count and average maximum hop count a node obtained in 100 flooding times for whole network.
Because the path loss model is used in simulation entirely different with the real environment where we deployed the test, thus we appraise interrelation of CT-Offset flooding and normal flooding in both simulation and experiment. As the results in Table.3- 1, number of nodes do not receive any flooding message in normal flooding is higher than Offset-CT flooding in both cases. That leads PRR of normal flooding to be lower than Offset-CT. The average hop count and average maximum hop count of normal case are
higher in both test cases. It proves that the collision in normal case happen more often. In sum, the simulation and experiment have equivalent results when comparing normal flooding with Offset-CT flooding and the collision behavior model is feasible to make simulation for others protocol.
Table 3-1. Result and Comparison between Experiment and Simulation
4 Multi-hop, Multi-channel Protocol for Tree Topology in LoRa
This chapter represents a bi-directional protocol supporting multi-hop, multi-channel for tree topology using LoRa. It consists of construction tree, upward data transmission and downward data transmission.
4.1 LoRa Channel in Korea
For LoRa communication, every country has different rules and regulations. LoRa uses ISM Band (Industrial, Scientific, and Medical Radio Band), and ISM Band is a license- free frequency band like WiFi that has different rules and norms.
In Korea, the frequency band for LoRa is regulated from 920.9 – 923.3 MHz on bandwidth 125 kHz. In detail, the center frequency is shown as the Table 4-1. With each center frequency, the output power is limited respectively for both end-device and gateway.
Table 4-1. LoRa regulations in Korea
Although there are 13 frequency channels is allowed, in LoRa we can obtain more
channel by combining different frequency and spreading factor. But in this approach, to simplify we only divide channel by using different frequency.
4.2 Contention Random Delay in LoRa
Transceivers normally provide a CCA (Clear Channel Assessment) interface to detect an occupied channel. The CCA is used in communication protocols to decide if packets can be transmitted and to decide if the radio must be kept active to receive a message. In particular for power constrained nodes it is important to have an accurate and fast CCA mechanism as this enables implementation of power-efficient duty cycling. Nodes perform periodic short CCA checks and only power the receiver for longer if a transmission is detected.
LoRa transceivers do not provide a classical CCA interface based on an RSSI (Received Signal Strength Indicator) threshold to detect an occupied channel. Because LoRa can receive transmissions with a signal strength that is below the noise floor, an RSSI threshold check will not unveiled an occupied channel. LoRa modems provide therefore a CAD mode to detect a present preamble.
In the tree construction period, every node must check occupied channel before transmitting as the Fig.4-1. In other words, meanwhile waiting for transmitting within a random delay time, a node will listen to detect preamble from other nodes. If a preamble detected, it cancels its transmission.
Figure 4-1. LoRa Contention Random Delay
As we mentioned in the 1.2.3c, CAD process take a duration to detect preamble, thus we have to consider delay step as greater than CAD process time when choosing contention random delay.
≥ (8)
So, the delay can be calculated as follow:
= ∗ (9)
with random number: r = {0, CW-1}
4.3 Protocol Design
4.4.1 Protocol Structure
The protocol structure consists of the TCP (Tree Construction Period), UDTP) upward data transmission period and downward data transmission period as the Fig.4-2. In the TCP, every node will form the tree topology and receive channel and time slot assignment from its parent. Pair of channel and time slot is called a cell. In the UDTP, every node forward data packet to the sink node follow channel and time slot assignment. In the DDTP, the parent node can send control message to the descendant.
Figure 4-2. Protocol Structure
4.4.2 Tree Construction Period
4.4.2.1 Messages, Notations and Definitions
The construction period will be performed at the beginning of life time to form tree topology including a sink node and multiple sensor nodes. To forming the network, we assume that every node has given unique id in advance and have at least 1 connection with other node. This period is divided into cycles and the building tree will be executed within fixed number of cycles N. In every cycle, they are divided into 4 slots: S1, S2, S3, S4. And four messages are used as follows to exchange information among nodes:
· INIT: Request new child to join into network. INIT message is presented in Fig.4- 3:
Figure 4-3. INIT message format
Where:
- TYPE: Type of message (INIT) - DEPTH: Depth of sensor node
- CUR_CYCLE: Current cycle the node sends this message - N: Number of cycles for construction period
- r: random number to calculate contention delay time.
· JOIN: Response INIT message to become a child to parent node. JOIN message is presented in Fig.4-4:
Figure 4-4. JOIN message format
Where:
- TYPE: Type of message (JOIN) - DEPTH: Depth of sensor node
- UsedCell_List: List of used cell neighbor node already be assigned Cell consists of 4 bits times slot and 4 bits channel as Fig.4-5:
Figure 4-5. Cell format
· CON: Parent node responses JOIN message to confirm a node become a child and assign time slot and channel to child node. INIT message is presented in Fig.4-6:
Figure 4-6. CON message format
Where:
- TYPE: Type of message (CON) - DEPTH: Depth of sensor node
- Nr_Child: Number of children of sender at the time this message is transmitted
- Time Slot: the time slot parent assign to child
- Channel: the channel parent assign to child
· ADV: A node when receive CON from parent node, it will broadcast to neighbor node about its assignment. INIT message is presented in Fig.4-7:
Figure 4-7. ADV message format
Where:
- TYPE: Type of message (ADV) - DEPTH: Depth of sensor node
- Time Slot: assigned timeslot of sender - Channel: assigned channel of sender.
During constructing tree, the nodes try to exchange message to get the information including:
- P: parent node - D: depth of node
- P_List: list of alternative parent nodes
- Ch: list of children node consists of node id, cell assignment, used cell list of children.
- UC: list of cells (time slot, channel) that neighbor node already used For more convenient, we describe notations that usually used in this period:
- M: Total number of deployed nodes in the network.
- N: number of cycles for tree construction period
- :Duration of cycle
- , , , : duration of slot S1, S2, S3, S4 in a cycle, respectively.
- ToA(message): time on air or transmission duration of message.
4.4.2.2 Construction Tree Process
In principle of forming the tree topology, every sensor node will be listening to overhear INIT message and Sink node trigger this process by broadcasting INIT message at the beginning. The INIT message is sent at slot S1 of cycle only and must compete to access channel before transmitting during contention random delay time.
When a sensor node receives INIT, it tries to response to request joining as a child of the node just send INIT by sending JOIN message. Right after receiving INIT, the node will calculate and schedule to start next cycle and start slot S2, S3, S4 in current cycle using the information in INIT message. Besides, the node starts to count cycle by current cycle which is presented in INIT message. Sending JOIN message to the parent is also performed after successfully compete to access medium. If the node lost medium in contention, it will try to continue to send JOIN at slot S1 in next cycle and it will try to overhear the message of neighbor node to know and store their cell assignment into its UC in current cycle. A node only stops sending JOIN message when it receives CON message from the parent node.
Beyond, the node sent INIT it always tries to listen to receive JOIN message from any node want to become a child of it and overhear the message of neighbor node to know and store their cell assignment into its UC. When the node receives JOIN message, it assigns time slot and channel to the child by sending CON message at next slot in current cycle.
The time slot and channel are assigned based on the information its UC and the UsedCell_List in the JOIN message to avoid assigning same cell with neighbor node, that can make collision in Data Transmission period. Because in requirement every data message has to forwarded to sink node within one cycle in UDTP, the time slot is assigned in descending order and lower time slot of parent node. And the channel is assigned in ascending order in 13 channel we already shown in 4.1 section. CON message must compete to access channel before transmitting during contention random delay time
because it may have to contend with JOIN message of other nodes in slot S2.
In the child node, when it receives cell assignment of CON message from parent node.
It must broadcast ADV message at beginning of next slot in current cycle to announce its cell assignment to neighbor node without contention random delay. A node is reputed success in construction period when right after sending ADV message. In first slot of next cycle, the node will compete accessing channel to send INIT message.
Figure 4-8. Network Topology
To facilitate understanding, we demonstrate an example with network topology as Fig.4-8a and the tree construction scheme as Fig.4-9. There are 5 sensor nodes and 1 sink node. At slot S1 in first cycle, Sink node trigger tree construction process by broadcasting INIT message (sender_id: S, receiver_id: 0xFF, depth: 0, cur_cycle: 1, N: 5, r: 0).
Figure 4-9. Tree Construction Scheme
Node A and B receive and they:
· Schedule to start next cycle after:
_ _ = -ToA(INIT) – r* = -ToA(INIT) (10)
· Schedule to start slot S2 to compete accessing channel to send JOIN after:
_ = -ToA(INIT) – r* = -ToA(INIT) (11)
· Schedule to start slot S3 to listen to receive CON from their parent:
_ = + -ToA(INIT) – r* = + -ToA(INIT) (12)
· Schedule to start slot S4:
_ = + + -ToA(INIT) – r*
= + + −ToA(INIT) (13)
In the slot S2, node A and B compete to access medium. We assume B wins and B sends JOIN message to sink node include its UC information (at this time, UC list is empty). Sink node, node A, node C, node E receive JOIN of node B:
· Node C and node E ignore this message.
· Node A knows that it lost accessing medium and have to wait next cycle to try to send its JOIN message.
· Sink node accepts node B as its child.
In the slot S3, sink node will assign time slot and channel to node B. Because there are 5 deployed sensor nodes, sink node will spend 5 time slots to receive data packet from 5 sensor nodes in case of star topology. Thus, sink node will start assign time slot 5 to the first child and start from channel 0 and send CON(S,0,B, 0, ) to node B. Node A and node B receive:
· Node A stores this assignment into its UC.
· Node B knows and stores its assignment.
In the S4, node B announces its cell assignment to neighbor nodes by broadcasting ADV(B, 1, S, , ). Node C and node D store this assignment into their UC.
In the first slot S1 of next cycle, node A try to compete accessing channel to send JOIN message while node B compete to send INIT message. The following process will be performed same procedure as principle until ending time of construction period. After finishing tree construction, we can obtain a tree like Fig.4-8b. with cell assignment for each node.
4.4.2.3 Constraint maximum child and maximum depth
In the protocol, we can adapt the constraints that limited number of children a node allows to accept and limited the hop count in the tree topology.
To do so, when a node broadcasts INIT message, the other nodes receive this message will compare maximum depth in configuration with depth information in INIT message to make decision the sender of INIT message can be parent or not.
In term of limited number of child node, CON message includes current number of child node it already had. If the node overhears the CON message from the parent node it is choosing and trying to send JOIN message or from the node in alternative parent list, it
will compare the number of child node in CON message and maximum child in configuration to decide discard sender of CON out of parent list. It can change current parent to another parent one in the alternative parent list if possible or go back to scan mode to try to receive INIT message like beginning.
4.4.3 Upward Data Transmission Period
This period is divided into cycles with fixed duration. Every sensor node forward data packet in pipeline fashion to the sink node based on its cell assignment as the Fig.4-10. A node can combine the received data packet from its children with its own data and send
them together.
Figure 4-10. Upward Data Transmission Scheme
4.4.4 Downward Data Transmission Period
In this period, we design to allow parent node can send message to its children. To assigning time slot and channel for this period, we inherit the cell assignment in the UDTP by using “inverse time slot” and same channel that the child uses to send to parent node as the Fig.4-11.
Figure 4-11. Downward Data Transmission Scheme
4.4.5 Wake-up Time Calculation
In this section, we will show several factors affect how we choose the length of preamble and receiving timeout base on synchronization period to avoid loss synchronization. Denote the synchronization period as and the clock drift rate as . The maximum clock difference [15] between two nodes is:
= 2 ∗ ∗ (14)
Where the factor of two reflects the worst case when each node’s clock drifts in the opposite direction.
Between two nodes, the sender has a role as time source. So, we have two worst case:
1-clock of receiver is faster, 2-clock of receiver slower as the Fig.4-12. Denote minimum time for the modem to acquire lock on preamble as , is time on air of preamble and is duration receiving in RX mode to detect valid preamble.
in LoRa is as 4 symbol time which is described in Semtech LoRa transceiver document [7].
The length of preamble and timeout are configured in the register of radio chip. In this protocol, synchronization period is duration of cycle.
Figure 4-12. Clock drift between two nodes
In case 1, to detect preamble from sender, the timeout in receiver have long enough to overlap preamble at least 4 symbols. this means:
≥ + = 2 ∗ ∗ + 4 (15)
In case 2, to detect preamble, the preamble is long enough to overlap with receiving window of receiver at least 4 symbol time, this means:
≥ + = 2 ∗ ∗ + 4 (16)
In conclusion, to guarantee that every node does not loss synchronization during data operation, must satisfy 2 condition below:
⎩⎨
⎧ ≤ − 4
2
≤ − 4
2
(17)
Thus, in this protocol every node has to synchronize time after maximum number of cycles as ⌊ ⌋.
Different with linear network, tree topology cannot synchronize wake-up time from child timing because a node may have multiple child. Therefore, every node can synchronize wake-up time from parent node timing. The synchronizing wake-up time is performed in DDTP at the Fig.4-13. For example, node A after receives DDTP packet from
sink node, it will synchronize wake-up time for sending to packet to child (19) and wake- up in next cycle (18) after:
= _ − − (18)
_ = _ - (19)
Figure 4-13. Timing Alignment
4.4 Performance Evaluation
4.4.1 Analysis power consumption in construction tree period
Note that the transceiver is only in either RX mode to listen message from neighbor node or TX mode to send the message for exchanging information. Actually, before performing transmitting or receiving, transceiver goes to Standby mode for setting register in modem. However, it takes very short time comparing with TX and RX mode. Thus, that is negligible and can be ignored. There are many cases can happen when the node try to send any message depending on contention random delay, so measuring exactly energy consumption in CTP is very complex. To be simplified, we investigate maximum energy consumption of node in perfect case that means a node:
- Send INIT, JOIN and ADV one time.
- Send CON message maximum of number of child times
- And minimum number of cycles we are using for TCP will be 2*(M-1) (two time
of Number Deployed sensor nodes) because a node needs a cycle for sending JOIN message and a cycle for sending INIT message.
From message format we designed in section 4.3.2.1, we can calculate the time on air of each message as the Table 4-2. We are using the modem configuration set as SF12, Explicit Header mode, CRC enabled, CR4/5, BW125 and preamble length as 8 symbols.
With SF12, the node’s energy consumption is highest. In case of INIT, CON and ADV, they are fixed length. But length of JOIN message is variable and it depends on length of UsedCell_List. UsedCell_List is list of used cell neighbor node already be assigned, so maximum length of UsedCell_List is (M-2) bytes (excluding sink node and itself). In the Table 4-2, provide the duration time for each slot in a cycle. Slot S1 duration has to long enough to send INIT or JOIN message including maximum contention random delay. Slot S2 duration has to long enough to send JOIN or CON message including maximum contention random delay. Slot S3 duration has to long enough to send CON message including maximum contention random delay or ADV message. Slot S4 duration has to long enough to send ADV message.
Table 4-2. Time duration of messages and slots in TCP
In the experiment of this research, we use the transceiver SX1272 that consumes 11.2 mA in RX mode and 125 mA in TX mode with maximum transmission power. Based on Table 4-2 we can calculate energy consumption a node consumes in CTP at Table 4-3 depending on number of deployed node and maximum of child node. If we use the battery with 3500 mAh capacity, the percentage of energy a node consumes to perform tree construction is negligible.
Table 4-3. Energy consumption in TCP
4.4.2 Experiment Evaluation
4.4.2.1 Experiment Setup
In the experiment, we use MultiTech mDot module [8] which is consist of Semtech SX1272 LoRa transceiver and a STM32F411RET processor. To evaluate the performance of protocol, we make an experiment by deploying 16 nodes with set of parameters as Table.4-4 below:
Table 4-4. Fixed Parameters of Experiment
Table 4-5. Changed Parameters of Experiment
In the tree construction period, the collisions can happen with high probability at the receiver when many nodes choose same contention delay before sending or the senders cannot overhear preamble of each other because they are out of range transmission. To increase successfully receiving capability, we adopt Offset-CT method by adding short random delay to use capture effect of LoRa. This delay is in range 1 symbol time and we provided 32 kinds of possible uniformly distributed delay. Thus, the step of contention random delay we are choosing as 3 symbol time for CAD process and Offset-CT delay.
Table.4-5 shows all of cases in experiment by combining delay mode, contention window size and maximum child node.
The experiment is performed in 2 node deployment scenarios:
· Scenario 1: They are randomly placed in the office 5 m x 10 m. That means every node have reliable link to each other.
· Scenario 2: They are deployed on the campus of university as follow:
Figure 4-14. Nodes Deployment
4.4.2.2 Results
Fig.4-15 shows the rate of number of nodes join into the network successfully in each maximum of child case. As our analysis in the log of the node cannot join into the network, there are two reason: First, the node does not receive any INIT message from other node because of collision, and second, the parent node they choose have maximum of child, so they cannot accept more node as its child.
Obviously, increasing contention window size, the rate of number of nodes successfully joining is better because the probability the nodes choose same contention random delay is decreased and collision might degrade. Besides, when the maximum number of child node increases, number of nodes successfully joining is increases. In both
scenarios, using capture effect by adapting CT-Offset delay the results significantly improve and obtain almost 100% in case maximum of children greater or equal 3.
a. Node Deployment Scenario 1
b. Node Deployment Scenario 2
Figure 4-15. Rate of number of nodes successfully joining in TCP
Fig.4-16 shows the average number of slots is assigned for data transmission in two node deployment scenarios. Comparing with linear network using 15 slots, this protocol allows to halve. That means the delay time to forward the data message to the sink nodes can be decreased significantly.
(a) (b)
Figure 4-16. Average number of slots used in data transmission period: (a) Node Deployment Scenario 1; (b) Node Deployment Scenario 2
After the tree successfully constructing, every node performs exchange data in 200 cycles in which one downward data transmission cycle after 50 upward data transmission cycles. A sensor node will generate 10 bytes in each cycle to send. The results show that packet from all nodes were delivered with a reliability of 97.6 % in node deployment scenario 2 and almost 100% in scenario 1.
Comparing with LoRa Blink multi-hop protocol is not fair but we can see that our protocol transmit message with high reliability and low power consumption by using the channel and timeslot assigned in tree construction period.
5 Conclusion
This thesis totally showed capture effect in LoRa under concurrent transmission clearly based on experiment results in real environment. And then we propose a new protocol to construct a tree topology that included assigning channel and time slot for upward data transmission in one-time flooding. By the channel and time slot assignment in upward data transmission, we show a method to allow downward data and perform aligning cycle timing in data transmission period. With analysis power consumption in tree construction period and evaluation performance of protocol from experiment in real environment, this protocol is feasible to apply in some specific IoT applications with large coverage and high reliability. In the future work, we can improve this protocol by obtaining balance tree and considering link quality to allow more reliable in data transmission.
References
[1] LoRa. https://www.semtech.com/lora/what-is-lora. Accessed: 17-10-2018
[2] J. Petajajarvi, K. Mikhaylov, A. Roivainen, T. Hanninen, and M. Pettissalo, “On the coverage of LPWANs: Range evaluation and channel attenuation model for LoRa technology” in Proc. ITST, Dec. 2015, pp. 55-59.
[3] K. Leentvaar and J. Flint, ``The capture effect in FM receivers,'' IEEE Trans. Commun., vol. 24, no. 5, pp. 531539, May 1976.
[4] Chun-Hao Liao, Guibing Zhu, Daiki Kuwabara, Makoto Suzuki, and Hiroyuki Morikawa, “Multi-Hop LoRa Networks Enabled by Concurrent Transmission”
[5] Martin Bor, John Vidler, Utz Roedig, “LoRa for the Internet of Things”
[6] Martin Bor, Utz Roedig, Thiemo Voigt, Juan M.Aloso, “Do LoRa Low-Power Wide- Area Networks Scale?”
[7] Semtech Transceiver SX1272 datasheet:
https://www.semtech.com/uploads/documents/sx1272.pdf. Accessed: 17-10-2018
[8] MultiTech mDot Module: http://www.multitech.com/documents/publications/data- sheets/86002171.pdf. Accessed: 17-10-2018
[9] SimPy, https://simpy.readthedocs.io/en/latest/index.html. Accessed: 17-10-2018
[10] Syncword in LoRa, https://revspace.nl/DecodingLora#sync_word. Accessed: 17-10- 2018
[11] LoRa Flooding Simulator, https://github.com/duongtan/LoRa_Flooding_Simulation.
Accessed: 17-10-2018
[12] [Online]. https://en.wikipedia.org/wiki/Wireless_sensor_network
[13] M.A Matin and M.M.Islam, “Overview of Wireless Sensor Network,” in Wireless Sensor Networks-Technology and Protocols.: Intech, June 2012. cha. 1.
[14] Cong-Tan Duong and Myung-Kyun Kim, "Reliable Multi-Hop Linear Network Based on LoRa". International Journal of Control and Automation 11(4):143-154
[15] Wei Ye, Fabio Silva, and John Heidemann: “Ultra-Low Duty Cycle MAC with Scheduled Channel Polling”
[16] LoRa Device Developer Guide:
https://lora.multitech.com/documents/publications/marketing- guides/lora_device_dev_guide_orange.pdf. Accessed: 04-12-2018
[17] LoRaWan: https://lora-alliance.org/resource-hub/lorawantm-specification-v11.
Accessed: 04-12-2018
![Figure 1-1. Typical multi-hop wireless sensor network architecture [12]](https://thumb-ap.123doks.com/thumbv2/123dokinfo/11367018.0/11.892.240.720.633.865/figure-typical-multi-hop-wireless-sensor-network-architecture.webp)