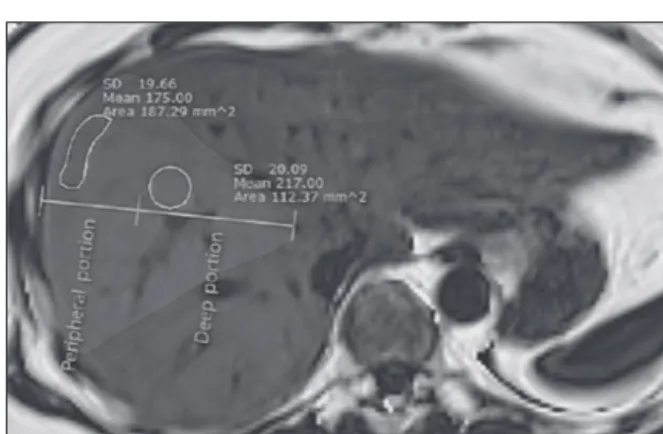
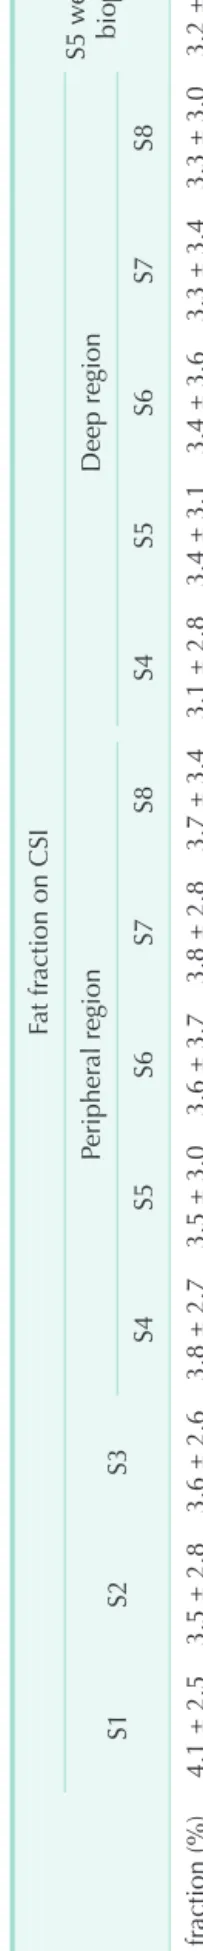
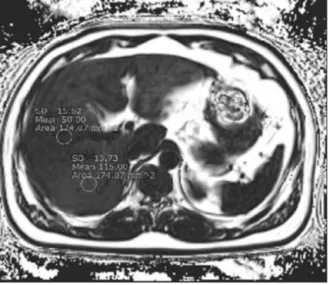
Heterogeneous living donor hepatic fat distribution on MRI chemical shift imaging
6
0
0
전체 글
(2)
(3)
(4)
(5)
(6)
수치

관련 문서
• • The efficiency of energy transfer (fraction of transfers per donor lifetime ~ k ET /k D ) by the dipole mechanism depends mainly on the oscillator strength of the A
출처 : IAEA 발표 자료(Comprehensive inspection exercise at bulk handling facilities, “U-235 Enrichment measurements by gamma-ray spectroscopy”) 13. Uranium
* in large objects with small surface area A to volume V ratio (A/V) the physical and chemical properties are primarily defined by the bulk (inside). * in small objects with
• By connecting a TV to the unit with an HDMI cable, you can control your iPod or USB storage device, or configure the settings of the unit with the menu displayed on the
• Today, we reveal why we believe EHang (NASDAQ: EH) is an elaborate stock promotion, built on largely fabricated revenues based on sham sales contracts with a customer who
The term “major accident” means a sudden occurrence such as a major emission, fire or explosion in the course of an activity within a major hazard
(c) the same mask pattern can result in a substantial degree of undercutting using substantial degree of undercutting using an etchant with a fast convex undercut rate such
As a result, exhibition booth development was carried out the basis of the study results. On that account, the result of the exhibition booth
