Veterinary Science
DOI: 10.4142/jvs.2011.12.2.127
Received: 16 Feb. 2010, Accepted: 04 Jun. 2010
Original Article
*Corresponding author
Tel: +55-83-3322-2242; Fax: +55-83-33153320 E-mail: mathiasweller@hotmail.com
Genetic variability of six indigenous goat breeds using major histocompatibility complex-associated microsatellite markers
Patricy de Andrade Salles
1, Silvana C. Santos
2, Davide Rondina
1, Mathias Weller
2,*
1
Rede Nordeste de Biotecnologia, Departamento da Medicina Veterinária, Universidade Estadual do Ceará, 60740-000 Fortaleza, Brazil
2
Departamento da Biologia, Universidade Estadual da Paraíba, Campus Universitário do Bodocongô, 58400-000 Campina Grande, Brazil
The present study aimed at analyzing the genetic variability of indigenous goat breeds (Capra hircus) using the MHC- associated microsatellite markers BF1, BM1818, BM1258,
DYMS1, and SMHCC1. The following breeds wereincluded: Chinese Xuhuai, Indian Changthangi and Pashmina, Kenyan Small East African (SEA) and Galla, and Albanian Vendi. To examine genetic variability, the levels of heterozigosity, degrees of inbreeding, and genetic differences among the breeds were analyzed. The mean number of alleles ranged from nine in the Galla to 14.5 in the Vendi breed. The mean observed heterozygosity and mean expected heterozygosity varied from 0.483 in the Vendi to 0.577 in the Galla breed, and from 0.767 in the SEA to 0.879 in the Vendi breed, respectively. Significant loss of heterozygosity (p < 0.01) indicated that these loci were not in Hardy-Weinberg equilibrium. The mean F
ISvalues ranged from 0.3299 in the SEA to 0.4605 in the Vendi breed with a mean value of 0.3623 in all breeds (p
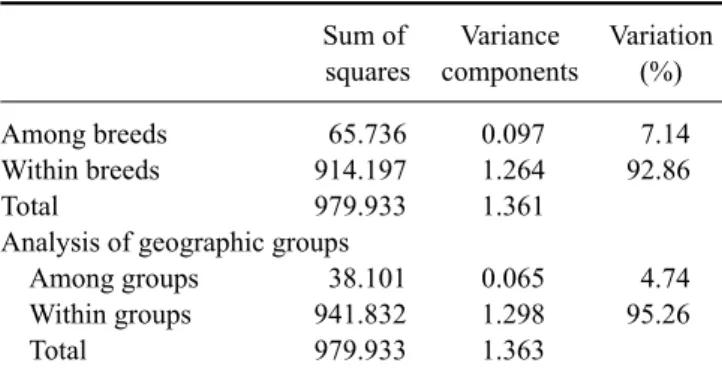
< 0.001). Analysis of molecular variance indicated that 7.14% and 4.74% genetic variation existed among the different breeds and geographic groups, whereas 92.86%
and 95.26% existed in the breeds and the geographic groups, respectively (p < 0.001). The microsatellite marker analysis disclosed a high degree of genetic polymorphism.
Loss of heterozygosity could be due to genetic drift and endogamy. The genetic variation among populations and geographic groups does not indicate a correlation of genetic differences with geographic distance.
Keywords: genetic variability, indigenous goat breeds, major histocompatibility complex, microsatellites
Introduction
Native goat breeds (Capra hircus) are often well-adapted to harsh local environmental conditions and therefore represent important genetic resources for conservation and breeding programs [6,18]. In many countries, indigenous goats are among the most important species of livestock [6,37]. These native breeds did not undergo extensive artificial selection by humans and are generally well- adapted to semi-arid or even arid conditions, especially in developing countries throughout the world [18]. Therefore, goats are a reasonable alternative to breeding of cattle in many regions of the world. These adaptive characteristics for harsh environmental conditions contribute to a growing interest in indigenous species for conservation and breeding programs. It is a declared aim of the Food and Agriculture Organization of the United Nations (Rome, Italy) to preserve the genetic diversity of domestic animals [18].
Previous works have shown that microsatellites are useful for assessing genetic diversity. There are several studies using these markers to analyze the genetic diversity of indigenous goat breeds, but only a few studies explored major histocompatibility complex (MHC)-associated microsatellites [2,7,13,16,24,39]. A recent study of MHC gene-associated microsatellite loci including those of bovine, ovine, and goat breeds revealed convergent evolution, which was interpreted to be the result of similar selective pressures, acting in these different ruminant species [9]. Microsatellite loci associated with genes of the MHC complex can provide highly polymorphic molecular markers potentially associated with resistance against disease and can therefore be useful for conservation and breeding programs [19,28,31].
The genetic characterization of indigenous goat breeds
using informative molecular markers is the primary step in
developing conservation and breeding programs. In the
present study, the genetic variability of six indigenous goat
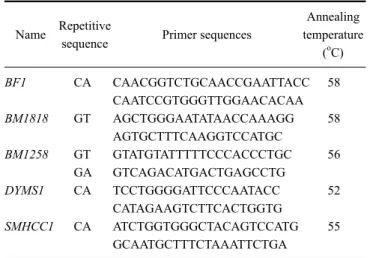
Table 1. Names and structures of the five microsatellites localized on chromosome 23 along with the sequences of corresponding primers and their annealing temperatures
Name Repetitive
sequence Primer sequences
Annealing temperature
(oC) BF1 CA CAACGGTCTGCAACCGAATTACC 58
CAATCCGTGGGTTGGAACACAA
BM1818 GT AGCTGGGAATATAACCAAAGG 58
AGTGCTTTCAAGGTCCATGC
BM1258 GT GTATGTATTTTTCCCACCCTGC 56
GA GTCAGACATGACTGAGCCTG
DYMS1 CA TCCTGGGGATTCCCAATACC 52
CATAGAAGTCTTCACTGGTG
SMHCC1 CA ATCTGGTGGGCTACAGTCCATG 55
GCAATGCTTTCTAAATTCTGA
breeds from Albania (Vendi goat), China (Xuhuai goat), India (Changthangi and Pashmina goat), and East Africa (Small East African and Galla goat) was analyzed. These breeds were chosen because they are subjected to conservation programs due to their special socio-economic value in local human communities and their population structures are poorly understood [18]. The question of inbreeding within the populations and degree of genetic variation among these breeds from different continents was also addressed. The five markers used in this study, BF1, BM1818, BM1258, DYMS1 and SMHCC1, are all well-characterized in bovine and ovine breeds, but with the exception of BM1818 have been rarely used in previous studies of goat breeds [9,11,14,24,34,39]. Due to their close association with MHC genes, these markers might be of interest for breeding and conservation programs to improve the animal’s immune response and other important traits. Therefore, this study aimed to analyze the degree of polymorphisms in markers from these indigenous goat breeds.
Material and Methods
Animal samples and DNA extraction
DNA probes extracted from blood samples of 404 goats (Capra hircus) were a kind gift from the lab of Dr. Hermann Geldermann (University of Hohenheim, Germany). Among these probes, 60 were from the Xuhuai, 87 from the Changthangi, 62 from the Pashmina, 60 from the SEA, 61 from the Galla and 74 from the Vendi goat breed. For the animals used in our study, we knew neither the pedigree structure of single herds nor the degree of interbreeding between herds within a single breed. Because of this, only one female and one non-castrated male were sampled in each heard to limit the collection of samples from related animals. Samples were taken from individuals more than 2 years old. It is important to point out that the samples were derived from animals in small herds raised extensively for use by local human populations without being exposed to intense artificial selection pressures.
Location of markers and genotyping
The present study included five microsatellite markers all located on chromosome 23 in the region of the MHC gene loci (Table 1). Corresponding flanking regions of microsatellites were sequenced in goats and compared with cattle (Bos taurus) and sheep (Ovis aries) to determine their correct identities within or close to the MHC gene regions. The microsatellites were amplified with the GeneAmp PCR system 9600 (Perkin Elmer, USA), applying different specific annealing temperatures (Table 1). Analysis of amplified markers was performed using an ABI3100 sequencer combined with GeneMapper 3.0 software (Applied Biosystems, USA).
Statistical analysis
The numbers of alleles per locus and their frequencies were computed with the PHYLIP (version 3.6) package of software [17]. Exact tests for deviations from Hardy- Weinberg equilibrium (HWE), including expected heterozygosity (H
E) and observed heterozygosity (H
O), have been carried out with the ARLEQUIN (version 3.0) [15] and GENEPOP (version 1.2) program [15,32]. The program performs a probability test using a Markov chain (1,000 batches, 5,000 iterations, 10,000 de-memorization, 10,000, batches 1,000, iteration per batch 1,000). Analysis of molecular variance (AMOVA) was computed with the ARLEQUIN program [15]. Standard genetic distances were computed using the TFGPA program (version 1.3) [25]. The F-statistics, including F
ISand F
ST, were calculated using the method of Weir and Cockerham [38]
with the GENEPOP program (version 1.2) [32].
Significance of the F
ISand F
STvalues was estimated from 10,000 bootstrap replicates; as usual, the F parameters were considered significantly different from zero when their corresponding 95% confidence intervals did not include zero.
Results
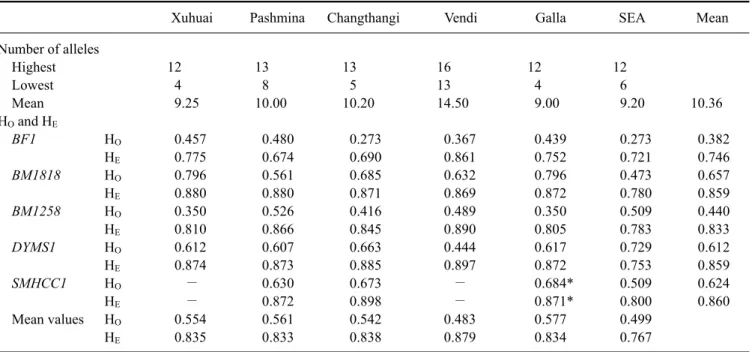
The mean number of alleles ranged from nine in the Galla to 14.5 in the Vendi breed with an average of 10.36 alleles for all five loci in the six breeds (Table 2). The lowest number of four alelles (BF1) was found in the Galla and Xuhuai breeds whereas the highest number of 16 alelles (BM1258; DYMS1) was found in the Vendi breed (Table 2).
The alelle sizes ranged from 90 bp (BM1258) in the SEA
breed to 276 bp (BM1818) in the Vendi breed. The lowest
(0.0027) and highest (0.4886) alelle frequencies were
Table 2. Numbers of alleles and significant differences of expected (H
E) and observed (H
O) heterozygosity for the microsatellite loci in the different breeds
Xuhuai Pashmina Changthangi Vendi Galla SEA Mean
Number of alleles
Highest 12 13 13 16 12 12
Lowest 4 8 5 13 4 6
Mean 9.25 10.00 10.20 14.50 9.00 9.20 10.36
H
Oand H
EBF1
H
O0.457 0.480 0.273 0.367 0.439 0.273 0.382
H
E0.775 0.674 0.690 0.861 0.752 0.721 0.746
BM1818
H
O0.796 0.561 0.685 0.632 0.796 0.473 0.657
H
E0.880 0.880 0.871 0.869 0.872 0.780 0.859
BM1258
H
O0.350 0.526 0.416 0.489 0.350 0.509 0.440
H
E0.810 0.866 0.845 0.890 0.805 0.783 0.833
DYMS1
H
O0.612 0.607 0.663 0.444 0.617 0.729 0.612
H
E0.874 0.873 0.885 0.897 0.872 0.753 0.859
SMHCC1
H
O− 0.630 0.673 − 0.684* 0.509 0.624
H
E− 0.872 0.898 − 0.871* 0.800 0.860
Mean values H
O0.554 0.561 0.542 0.483 0.577 0.499
H
E0.835 0.833 0.838 0.879 0.834 0.767
The asterisk (*) indicates pairs of values of HE and HO, which did not show a significant difference (p < 0.01). Alleles undetected in a specific population are indicated by a dash (−). The last two rows show the mean values of heterozygosity for the single breeds over all markers analyzed. SEA: Small East African.
Table 3. Mean deficit of heterozygotes within the breeds
Xuhuai Pashmina Changthangi Vendi Galla SEA Mean
FIS
0.4605 0.3302 0.3639 0.3482 0.3408 0.3299 0.3623
Xuhuai 0.0547 0.0371 0.0176 0.0555 0.1261
Pashmina 0.2420 0.0118 0.0692 0.0508 0.1560
Changthangi 0.2053 0.1387 0.0509 0.0359 0.1548
Vendi 0.1592 0.2665 0.2281 0.0314 0.1288
Galla 0.2461 0.2325 0.1980 0.1881 0.1468
SEA 0.3506 0.4002 0.3949 0.3567 0.3842
The lower half of the data (shadowed) and the upper one represent standard genetic distance and FST (p < 0.001) between breeds, respectively.
detected at the loci BM1258 and BF1 in the Vendi and SEA breed, respectively. Despite the existence of only six exclusive alleles over all loci, the allelic composition showed considerable differences between individual breeds with many alleles shared by only two breeds mainly at the BF1, DYMS1, and SMHCC1 loci.
The values of H
Eand H
Ofor all five loci are summarized in Table 2. The mean H
Evalues over all five markers ranged from 0.767 in the SEA to 0.879 in the Vendi breed (Table 2). The mean H
Ovalues varied from 0.483 in the Vendi to 0.577 in the Galla breed. A rather uniform loss of heterozygotes, with a corresponding increase of homozygotes, was observed for all genotypes within each
locus analyzed, demonstrating that significant differences detected between H
Oand H
E(p < 0.01) clearly indicate deviations from HWE with the exception of those found at the SMHCC1 locus in the Galla breed (Table 2). Loss of heterozygosity was confirmed by elevated F
ISvalues ranging from 0.3299 in the SEA to 0.4605 in the Xuhuai breed (p < 0.001), and a mean value of 0.3623 for all six breeds (Table 3).
Standard genetic distances varied from 0.4002 between
Pashmina and SEA, and 0.1387 between Pashmina and
Changthangi (Table 3). The pair-wise comparison between
breeds revealed F
STvalues ranging from 0.0118 between
the Pashmina and Changthangi to 0.1560 between the
Table 4. Analysis of molecular variance analysis of goat breeds based on microsatellite DNA variation
Sum of Variance Variation squares components (%)
Among breeds 65.736 0.097 7.14
Within breeds 914.197 1.264 92.86
Total 979.933 1.361
Analysis of geographic groups
Among groups 38.101 0.065 4.74
Within groups 941.832 1.298 95.26
Total 979.933 1.363
Analysis was performed unstructured for all six breeds (FST = 0.071) and the breeds were divided into four groups based on geographical location: Small East African and Galla, Changthangi and Pashmina, Xuhuai, and Vendi (FST = 0.047). The variations among breeds and among groups were significant (p < 0.001).