An evaluation of the gingival biotype and the width of keratinized gingiva in the mandibular anterior region of individuals with different dental malocclusion groups and levels of crowding
Objective: To evaluate the relationship of gingival thickness (GT) and the width of keratinized gingiva (WKG) with different malocclusion groups and the level of crowding. Methods: A total of 187 periodontally healthy subjects (121 females and 66 males) who presented at the Faculty of Dentistry in Yüzüncü Yıl University for orthodontic treatment were enrolled in the study. The individuals involved in the study were divided into three groups; Angle Class I malocclusion, Angle Class II malocclusion, and Angle Class III malocclusion. Each group was classified as mild, moderate, or severe according to the level of crowding. WKG was determined as the distance between the mucogingival junction and the free gingival margin. GT was determined by the transgingival probing technique.
Factorial variance analysis and the Duncan multiple comparison test were employed to identify the extent to which a difference was apparent between the groups according to these parameters. Results: It was determined that teeth in the mandibular anterior region display the thin gingival biotype. WKG and GT were observed as being higher at the mandibular incisor teeth in the severe crowding group and at the mandibular canine teeth in the mild crowding group. The GT of the mandibular right central and lateral incisors was found to be thinner in the Angle Class III group. Conclusions: Within the limits of this study, the results demonstrate that, there is no significant relationship of WKG and the mean GT in the mandibular anterior region according to the Angle classification.
[Korean J Orthod 2017;47(3):176-185]
Key words: Crowding, Gingival thickness Yeşim Kaya
aÖzer Alkan
aSıddık Keskin
ba
Department of Orthodontics, Faculty of Dentistry, Yüzüncü Yıl University, Van, Turkey
b
Department of Biostatistics, Faculty of Medicine, Yüzüncü Yıl University, Van, Turkey
Received March 21, 2016; Revised November 4, 2016; Accepted December 2, 2016.
Corresponding author: Özer Alkan.
Assistant Professor, Department of Orthodontics, Faculty of Dentistry, Yüzüncü Yıl University, Van 65080, Turkey.
Tel +90-432-225-17-44 e-mail [email protected]
© 2017 The Korean Association of Orthodontists.
The authors report no commercial, proprietary, or financial interest in the products or companies described in this article.
This is an Open Access article distributed under the terms of the Creative Commons Attribution Non-Commercial License (http://creativecommons.org/licenses/by-nc/4.0) which permits unrestricted non-commercial use, distribution, and reproduction in any medium, provided the original work is properly cited.
pISSN 2234-7518 • eISSN 2005-372X
https://doi.org/10.4041/kjod.2017.47.3.176
INTRODUCTION
Gingival biotype is a term used to define the bucco- lingual thickness of the gingiva. Gingival thickness (GT) is determined by the shape and size of the dental root, and contour of the alveolar bone. It can be classified into two types: thick and thin.
1,2A GT of ≤ 1 mm is cla- ssified as belonging to the thin biotype, while a GT of >
1 mm is classified as belonging to the thick biotype.
1GT is considered as an important factor in the success of periodontal and orthodontic treatment.
3,4Careful evaluation of GT is important during the treatment planning stage in order to prevent pathological peri- odontal problems, such as gingival recession due to orthodontic treatment.
2,5It has been reported that movements of teeth made within the anatomical limits of the alveolar bone by applying controlled orthodontic force do not cause any pathological problems. Dehi- scence and fenestrations have been observed as a result of tooth movements exceeding the anatomical limits of the alveolar bone, and it has been noted that this causes gingival recession, especially in individuals who display the thin gingival biotype; nevertheless, this is largely dependent on the extent to which the alveolar bone supports the loss of the gingiva.
6,7Long-term studies evaluating the association between gingival recession and orthodontic treatment have led to the conclusion that gingival recession is more prevalent in individuals who have been treated orthodontically, as opposed to those who have not received such tre- atment.
6,8In addition, the body of scholarly research demonstrates that mandibular incisors are more prone to gingival recession than other teeth.
6In studies evaluating the association between lower incisor protrusion and orthodontic treatment, it has been stated that there is no statistically significant relationship between these two factors.
9,10However, Yared et al.
11investigated the relationship between gingival recession and the health status of periodontal tissue, the type and amount of tooth movement, the width of keratinized gingiva (WKG), and GT, and concluded that gingival recession is characterized by a greater prevalence in certain contexts.
Specifically, the condition is more frequent when GT is
< 0.5 mm, WKG is < 2 mm, and lower incisors protrude at an angle that is greater than 95
o. The researchers also noted that GT is a factor with greater importance than protrusion movement.
Although a number of studies have been published that relate to an evaluation of the correlation between GT and malocclusions, no studies in the extant literature have evaluated the association between keratinized gingival width and malocclusions. Therefore, the aim of the present study was to investigate the relationship of GT and WKG with different malocclusion groups and
levels of crowding. The null hypothesis is that the GT and WKG of lower anterior teeth will change on the basis of the different malocclusion groups and levels of crowding.
MATERIALS AND METHODS
A total of 187 subjects (121 females and 66 males) were enrolled in the present study, all of whom pre- sented at the Department of Orthodontics, Faculty of Dentistry, Yüzüncü Yıl University between June 2014 and June 2015 for orthodontic treatment. Following the provision of a description of the study, written and informed consent was obtained from all participants.
The study was commenced after obtaining the approval of the Research Ethics Committee of Faculty of Medicine in Yüzüncü Yıl University (B.30.2.YYU.0.01.00.00/141).
The exclusion criteria were as follows: history of previous orthodontic treatment; the presence of atta- chment loss or a pocket deeper than 4 mm; congenital anomaly; dental structural disorder; crowns or extensive restoration; pregnancy or lactation; any systemic problems and related medications that could have an impact on the thickness of gingival tissues; the administration of antibiotic premedication due to any disturbance within the recent six months; and smoking.
Correspondingly, periodontally healthy subjects with complete permanent dentition (with the exception of third molars) were included in the study.
The participants were divided into three groups; Angle Class I malocclusion, Angle Class II malocclusion, and Angle Class III malocclusion. For the Angle Class I relationship, the mesio-buccal cusp of the maxillary first permanent molar occluded with the mesio-buccal groove of the mandibular first permanent molar. Additionally, further attention was directed towards the distal surface of the disto-buccal cusp of the upper first permanent molar and the way in which it contacted with the mesial surface of the mesio-buccal cusp of the lower second molar; furthermore, the mesio-palatal cusp of the upper first permanent molar occluded with the central fossa of the lower first permanent molar. The mesio-buccal grove of the mandibular first permanent molar was positioned distally to the mesio-buccal cusp of the maxillary first permanent molar in the Angle Class II relationship and mesially in the Angle Class III relationship.
12Each Angle classification group was divided into sub-
groups according to the level of dental crowding in the
mandibular anterior region. The mesio-distal width of
each tooth, including the canine teeth, was measured
from plaster models with a Boley gauge. Where the
contact points were broken, the required space for each
tooth was calculated by subtracting the mesio-distal
width of the tooth from the available space. This study
determined the level of crowding by the sum of the lack of all space, and it was classified in three ways; mild (0–3 mm), moderate (4–6 mm), and severe (> 6 mm).
13Measurements of the plaque index (PI),
14gingival index (GI),
15and probing depth (PD) of the periodontal pocket were conducted from the mesial and distal surfaces; furthermore, this took place from the vestibular midpoint and palatinal midpoint of the subjects’ man- dibular anterior teeth using a periodontal probe (PQW7, Williams; Hu-Friedy Mfg. Co., LLC, Chicago, IL, USA).
The WKG was measured from the mucogingival junction to the free gingival margin at the buccal area of the mandibular anterior teeth.
A digital caliper with a sensitivity of 0.01 mm was used to determine GT. The GT of each patient was assessed by a single researcher (YK) prior to the orthodontic treatment. Measurements were carried out from two points on the buccal aspect of the mandibular anterior teeth (canine–canine): apical to the free gingival margin and coronal to the mucogingival junction (Figure 1).
After marking the measurement points with a marking pen, xylocaine spray (Vemcaine 10% lidocaine; Vem, Istanbul, Turkey) was admi nistered to the patient or alternatively, a local anesthetic (Maxicaine, lidocaine hydrochloride; Vem) was used to reduce pain when necessary. For the patients for whom a local anesthetic was necessary, the anesthetic solution was injected slowly at a dose of 0.1 mL to prevent an anesthesia- related increase of the mucosal volume. The required measurements were performed 10–20 minutes after the injection was administered, and took place from the marked points by perpendicularly inserting a 10- mm endodontic spreader (Golden Star Medical Co., Ltd., Guangdong, China). This involved the placement of a silicone stopper to the gingiva until the alveolar bone was reached. Since the application of excessive force
would cause the spreader to cross the soft tissue and go through the alveolar bone, careful attention was paid to apply a light force that was limited only to the soft tissue.
All measurements were repeated two times at 10-minute intervals by the same researcher and the average result was recorded as the final measurement for thickness at each location. It is notable that intra-examiner agreement was high (Pearson correlation coefficient = 0.901, p < 0.001). In addition, the random measurement error was calculated with Dahlberg’s formula, and it was observed that these error values ranged from 0.034 to 0.022. The GT of each tooth was determined by the arithmetic mean of the GT values obtained from the apical part of the gingival sulcus and the coronal aspect of the mucogingival junction. The gingival biotype of the mandibular anterior teeth was determined by the ratio of the sum of GT of the mandibular anterior teeth to the number of teeth. If the obtained measurement values were less than 1 mm, the gingiva was classified as a thin biotype; where the obtained values were greater than 1 mm, it was classified as a thick biotype.
Statistical analysis
Statistical analysis was carried out using the program IBM SPSS Statistics for Windows, version 22.0 (IBM Co., Armonk, NY, USA). The sample size was determined by considering the minimum 80% power value and the 5% type I error. Descriptive statistics for the considered parameters were presented as mean, standard deviation, and maximum and minimum values. Additionally, the Kolmogorov-Smirnov test was performed to determine the normality of the variables, and Levene’s test was also used to determine the homogeneity of variances.
After these tests, Factorial Variance Analysis was performed to determine whether any differences existed with regard to the Angle classification and the level of crowding. Following the factorial variance analysis, Duncan’s multiple-range test was performed to assess the nature of the crowding groups and the different classes of Angle classification. In turn, the chi-square test was implemented in order to identify the nature of the relationship between the gingival biotype, Angle classification, the level of crowding, and gender. The level of statistical significance was 5%.
RESULTS
There was no statistically significant difference bet-
ween the genders in terms of number and the mean
age of patients. The study group consisted of a total of
187 patients aged between 10 and 28.2 years, of whom
121 were female (mean age, 17.5 ± 4.25 years) and 66
were male (mean age, 15.8 ± 3.17 years). No statistically
significant difference was found between the genders in
Figure 1. Gingival thickness measurement.
terms of number and mean age of patients.
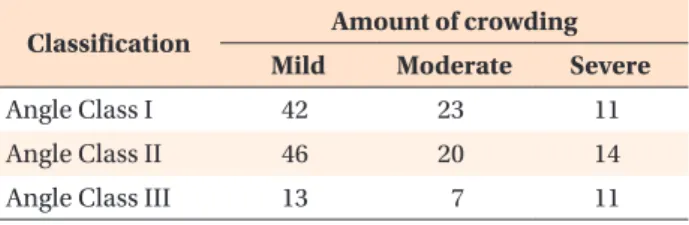
The number of patients in the Angle Class I, II, and III malocclusion groups was 76 (40.6%), 80 (42.8%), and 31 (16.6%), respectively. In addition, the number of patients in the mild, moderate, and severe crowding groups was 101 (54.0%), 50 (26.7%), and 36 (19.3%), respectively (Table 1). There was no statistically signi- ficant difference between the groups in terms of the number of patients.
In Tables 2, 3, and 4, the vertical columns describe the crowding levels and the horizontal columns describe the Angle classification groups. Interpretations were conducted in accordance with general means. The distribution of PI, GI, and PD measurements, used in determining the periodontal status of patients, are
displayed in Table 2, according to Angle classification and the level of crowding. The PI values were signi- ficantly higher in the severe crowding group than in the mild crowding group; this was also the case in the Angle Class III malocclusion group, compared to the Angle Class II malocclusion group (p = 0.042). There was no statistically significant difference between groups in terms of GI values. In addition, PD values were higher in terms of statistical significance in the Angle Class III malocclusion group than they were in the Angle Class I malocclusion group (p = 0.101).
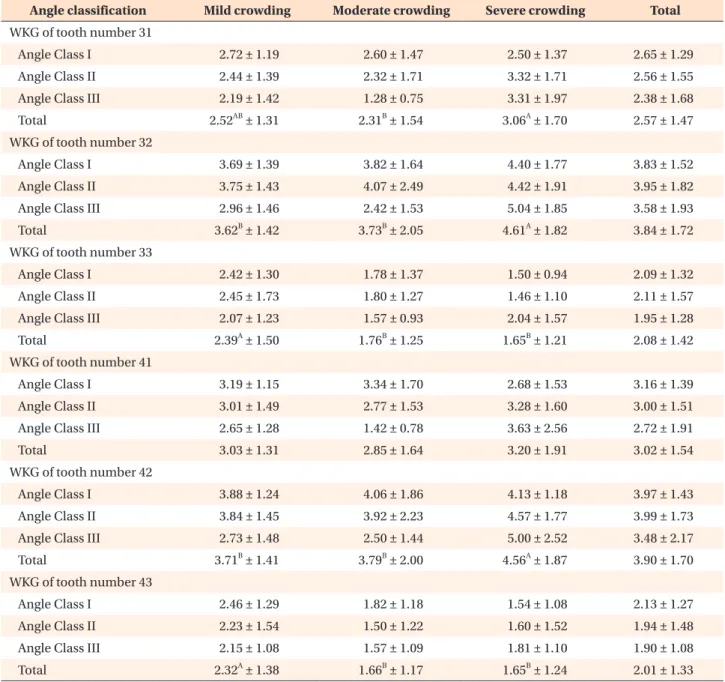
The WKG of the lower anterior teeth according to Angle classification and the level of crowding is displayed in Table 3. No statistically significant difference was observed between the WKG of the lower anterior teeth according to Angle classification. The WKG values for the mandibular left central and lateral incisors and the mandibular right lateral incisor were higher in the severe crowding group (p < 0.05). In addition, it should also be noted that, while the WKG of the mandibular right central incisor was higher in the severe crowding group, the difference was not statistically significant. The WKG values of mandibular canines were higher in the mild crowding group (p < 0.05).
Table 4 summarizes and displays the GT of the lower anterior teeth on the basis of Angle classification and the level of crowding. It was observed that teeth in Table 1. Distribution of patients according to Angle cla-
ssification and crowding amount
Classification Amount of crowding Mild Moderate Severe
Angle Class I 42 23 11
Angle Class II 46 20 14
Angle Class III 13 7 11
Chi-square = 6.955; p = 0.138.
Table 2. Distribution of plaque index, gingival index and probing depth measurements according to Angle classification and crowding amount
Variable Mild crowding Moderate crowding Severe crowding Total p-value*
Plaque index
Angle Class I 1.16 ± 0.28 1.06 ± 0.08 1.22 ± 0.22 1.14
ab± 0.23
Angle Class II 1.12 ± 0.17 1.06 ± 0.12 1.12 ± 0.14 1.11
b± 0.15
Angle Class III 1.19 ± 0.23 1.13 ± 0.23 1.30 ± 0.27 1.22
a± 0.25
Total 1.07
B± 0.12 1.15
AB± 0.23 1.21
A± 0.22 1.14 ± 0.21 0.042
Gingival index
Angle Class I 0.35 ± 0.45 0.47 ± 0.53 0.30 ± 0.42 0.38 ± 0.47
Angle Class II 0.37 ± 0.50 0.29 ± 0.45 0.44 ± 0.54 0.36 ± 0.49
Angle Class III 0.21 ± 0.35 0.19 ± 0.21 0.30 ± 0.41 0.24 ± 0.34
Total 0.34 ± 0.46 0.36 ± 0.47 0.36 ± 0.46 0.35 ± 0.46 0.334
Probing depth
Angle Class I 1.77 ± 0.54 1.64 ± 0.42 1.64 ± 0.78 1.71
b± 0.55
Angle Class II 1.82 ± 0.39 1.81 ± 0.37 1.78 ± 0.66 1.81
ab± 0.44
Angle Class III 1.93 ± 0.33 1.99 ± 0.30 1.87 ± 0.30 1.92
a± 0.31
Total 1.81 ± 0.45 1.75 ± 0.40 1.76 ± 0.61 1.79 ± 0.47 0.101
Values are presented as mean ± standard deviation.
A, B
Statistically significant difference between amount of crowding (p < 0.05).
a, b
Statistically significant difference between Angle classification (p < 0.05).
*Two-way (factorial) ANOVAs were performed and interaction was not statistically significant.
the lower anterior jaw displayed thin gingival biotype, and yet there was no statistically significant difference observed between Angle classification and the GTs of the mandibular left central and lateral incisors, and the mandibular canines. However, the GTs of the mandibular right central and lateral incisors was observed to be significantly lower in the Angle Class III malocclusion group (p < 0.05). The GTs of the mandibular left central
and lateral incisors, and the mandibular right lateral incisor were significantly higher in the severe crowding group (p < 0.05). Notably, although the GT of the mandibular right central incisor was higher in the severe crowding group, the difference was not statistically significant. The GTs of the mandibular canines were higher in terms of statistical significance in the mild crowding group (p < 0.05).
Table 3. Width of keratinized gingiva (WKG) of mandibular anterior teeth according to Angle classification and amount of crowding
Angle classification Mild crowding Moderate crowding Severe crowding Total WKG of tooth number 31
Angle Class I 2.72 ± 1.19 2.60 ± 1.47 2.50 ± 1.37 2.65 ± 1.29
Angle Class II 2.44 ± 1.39 2.32 ± 1.71 3.32 ± 1.71 2.56 ± 1.55
Angle Class III 2.19 ± 1.42 1.28 ± 0.75 3.31 ± 1.97 2.38 ± 1.68
Total 2.52
AB± 1.31 2.31
B± 1.54 3.06
A± 1.70 2.57 ± 1.47
WKG of tooth number 32
Angle Class I 3.69 ± 1.39 3.82 ± 1.64 4.40 ± 1.77 3.83 ± 1.52
Angle Class II 3.75 ± 1.43 4.07 ± 2.49 4.42 ± 1.91 3.95 ± 1.82
Angle Class III 2.96 ± 1.46 2.42 ± 1.53 5.04 ± 1.85 3.58 ± 1.93
Total 3.62
B± 1.42 3.73
B± 2.05 4.61
A± 1.82 3.84 ± 1.72
WKG of tooth number 33
Angle Class I 2.42 ± 1.30 1.78 ± 1.37 1.50 ± 0.94 2.09 ± 1.32
Angle Class II 2.45 ± 1.73 1.80 ± 1.27 1.46 ± 1.10 2.11 ± 1.57
Angle Class III 2.07 ± 1.23 1.57 ± 0.93 2.04 ± 1.57 1.95 ± 1.28
Total 2.39
A± 1.50 1.76
B± 1.25 1.65
B± 1.21 2.08 ± 1.42
WKG of tooth number 41
Angle Class I 3.19 ± 1.15 3.34 ± 1.70 2.68 ± 1.53 3.16 ± 1.39
Angle Class II 3.01 ± 1.49 2.77 ± 1.53 3.28 ± 1.60 3.00 ± 1.51
Angle Class III 2.65 ± 1.28 1.42 ± 0.78 3.63 ± 2.56 2.72 ± 1.91
Total 3.03 ± 1.31 2.85 ± 1.64 3.20 ± 1.91 3.02 ± 1.54
WKG of tooth number 42
Angle Class I 3.88 ± 1.24 4.06 ± 1.86 4.13 ± 1.18 3.97 ± 1.43
Angle Class II 3.84 ± 1.45 3.92 ± 2.23 4.57 ± 1.77 3.99 ± 1.73
Angle Class III 2.73 ± 1.48 2.50 ± 1.44 5.00 ± 2.52 3.48 ± 2.17
Total 3.71
B± 1.41 3.79
B± 2.00 4.56
A± 1.87 3.90 ± 1.70
WKG of tooth number 43
Angle Class I 2.46 ± 1.29 1.82 ± 1.18 1.54 ± 1.08 2.13 ± 1.27
Angle Class II 2.23 ± 1.54 1.50 ± 1.22 1.60 ± 1.52 1.94 ± 1.48
Angle Class III 2.15 ± 1.08 1.57 ± 1.09 1.81 ± 1.10 1.90 ± 1.08
Total 2.32
A± 1.38 1.66
B± 1.17 1.65
B± 1.24 2.01 ± 1.33
Values are presented as mean ± standard deviation.
Two-way (factorial) ANOVAs were performed and interaction was not statistically significant.
A, B
Statistically significant difference between amount of crowding (p < 0.05).
There were no statistically significant differences among Angle classifications (p > 0.05).
Table 5 presents an overview of the mean GT of the mandibular anterior region on the basis of Angle classification and the level of crowding. It was determined that the mean GT of the mandibular anterior region is 0.71 ± 0.17 mm and, moreover, displays the thin gingival biotype. It did not exhibit any significant association with Angle classification or the level of crowding (p = 0.140 and 0.321, respectively).
DISCUSSION
There is a range of risk factors associated with gingival recession, especially in the area of the mandibular incisors during orthodontic treatment. These include the following: the age of the patient, the health status of the periodontal tissues, the duration of the treatment, the amount and type of tooth movement, the WKG, and GT.
9,16Nevertheless, owing to the lack of research Table 4. Gingival thickness (GT) of mandibular anterior teeth according to Angle classification and amount of crowding
Angle classification Mild crowding Moderate crowding Severe crowding Total GT of tooth number 31
Angle Class I 0.70 ± 0.19 0.71 ± 0.27 0.70 ± 0.23 0.70 ± 0.22
Angle Class II 0.69 ± 0.16 0.59 ± 0.20 0.74 ± 0.14 0.68 ± 0.17
Angle Class III 0.61 ± 0.23 0.47 ± 0.16 0.77 ± 0.19 0.64 ± 0.23
Total 0.69
AB± 0.18 0.63
B± 0.24 0.74
A± 0.18 0.68 ± 0.20
GT of tooth number 32
Angle Class I 0.73 ± 0.20 0.84 ± 0.28 0.94 ± 0.26 0.80 ± 0.24
Angle Class II 0.76 ± 0.16 0.76 ± 0.30 0.92 ± 0.31 0.79 ± 0.24
Angle Class III 0.65 ± 0.22 0.84 ± 0.47 0.89 ± 0.16 0.78 ± 0.29
Total 0.74
B± 0.19 0.81
B± 0.31 0.91
A± 0.25 0.79 ± 0.25
GT of tooth number 33
Angle Class I 0.70 ± 0.21 0.67 ± 0.20 0.49 ± 0.15 0.66 ± 0.21
Angle Class II 0.72 ± 0.19 0.62 ± 0.23 0.59 ± 0.19 0.67 ± 0.21
Angle Class III 0.61 ± 0.21 0.64 ± 0.27 0.64 ± 0.13 0.63 ± 0.19
Total 0.70
A± 0.20 0.64
AB± 0.22 0.57
B± 0.17 0.66 ± 0.21
GT of tooth number 41
Angle Class I 0.75 ± 0,19 0.74 ± 0.18 0.72 ± 0.27 0.75
a± 0.20
Angle Class II 0.72 ± 0.17 0.67 ± 0.22 0.79 ± 0.19 0.72
a± 0.19
Angle Class III 0.63 ± 0.23 0.48 ± 0.13 0.74 ± 0.21 0.63
b± 0.22
Total 0.72 ± 0.19 0.68 ± 0.21 0.75 ± 0.22 0.72 ± 0.20
GT of tooth number 42
Angle Class I 0.79 ± 0.18 0.84 ± 0.29 0.97 ± 0.38 0.83
ab± 0.26
Angle Class II 0.80 ± 0.18 0.82 ± 0.27 1.09 ± 0.42 0.85
a± 0.28
Angle Class III 0.67 ± 0.20 0.63 ± 0.22 0.86 ± 0.27 0.73
b± 0.24
Total 0.78
B± 0.18 0.81
B± 0.28 0.98
A± 0.37 0.82 ± 0.26
GT of tooth number 43
Angle Class I 0.71 ± 0,21 0.61 ± 0.23 0.56 ± 0.18 0.66 ± 0.22
Angle Class II 0.68 ± 0.22 0.61 ± 0.31 0.59 ± 0.19 0.65 ± 0.24
Angle Class III 0.63 ± 0.21 0.52 ± 0.25 0.59 ± 0.17 0.59 ± 0.20
Total 0.69
A± 0.22 0.60
B± 0.26 0.58
B± 0.17 0.64 ± 0.23
Values are presented as mean ± standard deviation.
Two-way (factorial) ANOVAs were performed and interaction was not statistically significant.
A, B
Statistically significant difference between amount of crowding (p < 0.05).
a, b