ABSTRACT
BACKGROUND/OBJECTIVES: Evidence-based customized nutritional interventions are required for effective treatment of moderate to severe obese children and adolescents.
SUBJECTS/METHODS: Sixty six (64.1% of 103) of the eligible participants who joined the usual care or physical activity group in the clinic were involved in 16-week intervention. Customized nutritional intervention was implemented for each participant based on a nutrition care process (NCP) model. Sociodemographic assessment, anthropometrics data, health- and dietary-related behaviors, and dietary intake of the study subjects were assessed at baseline and follow-up. All participants engaged in 30-minute nutritional sessions on a monthly basis.
RESULTS: After 16 weeks, there were significant improvements in body composition [BMI (−0.8 ± 0.9, P < 0.05), BMI z-score (−0.3 ± 0.2, P < 0.001), body fat (kg) (−1.3 ± 2.1, P < 0.05), and body fat (%)(−1.5 ± 1.9, P < 0.05)] as well as macronutrient intake [total energy intake (kcal) (−563.7 ± 656.8, P < 0.05), energy (%) (−26.5 ± 30.0, P < 0.05) and fat (g) (−28.3 ± 40.6, P < 0.05)] in the adherent group than the non-adherent group. The SOC was higher in both groups after the intervention (P < 0.001).
CONCLUSIONS: Our results highlight the positive effects of an evidence-based approach as a multidisciplinary intervention for people-centered nutritional care and weight management.
Keywords: Pediatric obesity; behavior; dietary modification; adolescent
INTRODUCTION
Childhood obesity is caused by complex interactions among individual, environmental, and behavioral factors, and can result in chronic medical and psychosocial health problems over the lifespan [1]. In Korea, the number of severely obese children and adolescents has doubled
Original Research
Received: Oct 7, 2019 Revised: Dec 27, 2019 Accepted: Dec 27, 2019
§
Corresponding Author:
Hyunjung Lim
Department of Medical Nutrition, Kyung Hee University, 1732 Deogyeong-daero, Giheung-gu, Yongin 17104, Korea.
Tel. +82-31-201-2343 Fax. +82-2-969-7717 E-mail. [email protected]
©2020 The Korean Nutrition Society and the Korean Society of Community Nutrition This is an Open Access article distributed under the terms of the Creative Commons Attribution Non-Commercial License (https://
creativecommons.org/licenses/by-nc/4.0/) which permits unrestricted non-commercial use, distribution, and reproduction in any medium, provided the original work is properly cited.
ORCID iDs Jieun Kim
https://orcid.org/0000-0001-7737-5925 YoonMyung Kim
https://orcid.org/0000-0002-6582-1446 Young-Gyun Seo
https://orcid.org/0000-0001-8294-1741 Kyung-Hee Park
https://orcid.org/0000-0001-9806-0076 Han Byul Jang
https://orcid.org/0000-0002-5826-1698 Hye-Ja Lee
https://orcid.org/0000-0002-7120-1809
Jieun Kim 1 , YoonMyung Kim 2 , Young-Gyun Seo 3 , Kyung-Hee Park 3 , Han Byul Jang 4 , Hye-Ja Lee 4 , Sang Ick Park 4 , and Hyunjung Lim 1§
1
Department of Medical Nutrition, Kyung Hee University, Yongin 17104, Korea
2
University College, Yonsei University International Campus, Incheon 21983, Korea
3
Department of Family Medicine, Hallym University Sacred Heart Hospital, Anyang 14068, Korea
4
Center for Biomedical Sciences, Korea National Institute of Health, Cheongju 28159, Korea
Evidence-based customized
nutritional intervention improves body composition and nutritional factors for highly-adherent children and
adolescents with moderate to severe
obesity
Sang Ick Park
https://orcid.org/0000-0003-4115-9117 Hyunjung Lim
https://orcid.org/0000-0001-7632-7315 Funding
This research was funded by the Korea Centers for Disease Control and Prevention, grant number 2015-ER6401-00.
Conflict of Interest
The authors declare no potential conflicts of interest.
Author Contributions
Conceptualization: Kim J, Lim H; Formal analysis: Seo Y, Kim J, Jang H; Funding acquisition: Park K; Investigation: Lim H, Kim Y, Park K; Methodology: Kim J, Lim H;
Supervision: Lee H, Park S; Writing - original draft: Kim J; Writing - review & editing: Kim J, Kim Y, Seo Y, Park K, Jang H, Lee H, Park S, Lim H.
over the past decade [2]. This population may develop chronic comorbid conditions because of excess adiposity [3]. Metabolic syndrome (MS) prevalence in severely obese children has been estimated to be as high as 50% [4]. Current treatment options appear to have limited effectiveness and scalability in severely obese children and adolescents [5].
Adequate nutrition and a balanced diet are key [6] to healthy maturation and the physical growth and development of children and adolescents. Nutritional professionals (registered dietitians/nutritionists) can play an integral role in promoting weight control and a healthy diet in obese children. The nutrition care process (NCP) model [7] is a systematic tool designed for diverse individuals and populations to provide nutritional care and management using evidence-based guidelines [8,9]. This model can enhance the consistency and quality of people-centered nutritional care [10-12].
Integrated theoretical models of behavior change can lead to significant improvements in nutrition-related behaviors [13]. The transtheoretical model (TTM) has been used to promote healthy behavioral changes in several stage-based intervention studies [14-16]. The latest studies that have used the TTM to design interventions for obese children and adolescents have reported decreased energy and carbohydrate intake and BMI-z score [14], decreased fatty food consumption, increased fruit and vegetable consumption [15], and lower diastolic BP (DBP) [16]. Recently, a stage-based tailored nutrition information message for dietary behavior change designed for mobile devices was developed to manage childhood obesity [17].
Previous researchers reported that higher (≥ 75%) levels of intervention session attendance were related to a decrease in the proportion of overweight patients with type 2 diabetes [18]
and weight loss in severely obese children [19]. In another study, the adequacy of proposed energy, carbohydrate, protein, fat intake, and meal frequency were measured as proxies for dietary compliance with the intervention [20]. A systematic review paper found that improvement in weight status was related to reduced energy intake [21].
Few studies, however, have adopted an individual NCP model to treat childhood obesity.
There is a dearth of evidence-based nutritional intervention studies in moderate to severe obese children and adolescents. Evidence-based research is needed to identify complex, obesity-related nutritional problems in moderate to severe obese children and adolescents.
Therefore, in this study, we investigated the effects of a 16-week, evidence-based, customized nutritional intervention on body composition, macronutrient intake, and nutritional behavior in moderate to severe obese children and adolescents based on their adherence to the intervention program.
SUBJECTS AND METHODS
Subjects and settings
Children and adolescents who met the following inclusion criteria were invited to enroll in this study: 7-16 years of age with a BMI in the 95
thpercentile for age and sex or higher.
Recruitment was performed via newspapers, broadcasting, posters, websites, and other
social networking services in the Geonggi and Seoul (South Korea) areas from January to
August, 2016. Eligible subjects who agreed to participate in the intervention program signed
informed consent after explanation of the study goals and procedures to be followed. The
sample size on power in studies of group differences in BMI-z score between groups. We used for power 80% with a two-sided significance level set at 0.05 to detect differences of 0.1 between groups. In total, one hundred three participants enrolled in the study and sixty-six moderate to severe obese children and adolescents completed the study. This study was approved by the Hallym University Sacred Heart Hospital's Institutional Review Board (approval number: 2015-I134). Written informed consent was obtained from all of the participants and their parents or caregivers. This study was registered at cris.nih.go.kr (identifier: KCT0002111).
Customized nutrition care process
A customized NCP was implemented by a nutrition professional. NCP was implemented using the following four steps: 1. nutrition assessment, 2. nutrition diagnosis, 3. nutrition intervention, and 4. monitoring/evaluation [7].
Nutrition assessment/reassessment
Anthropometric data, biochemical data, dietary intake data, and nutritional diagnosis at baseline and 4 months post-baseline were collected. Prior to data collection, a guideline booklet and previously validated questionnaires were developed by the clinical, physical, and nutrition professional team.
Sociodemographic assessment
Demographic data such as school level (elementary, middle, high school), age, parents' education, metabolic syndrome-related medical history and household income were collected.
Anthropometric data
The 2017 Korean Children and Adolescents Growth Standard [22] was used for
anthropometric assessment and BMI reference data specific for age and sex of the subject.
BMI z-scores were calculated and adjusted for age and sex using the lambda-musigma (LMS) method and Korean national growth charts. Body mass index (BMI) was calculated using the formula weight (kg)/height (m)
2. For weight and height measurements, subjects were dressed lightly for indoors and were told to remove their shoes before the measurement. Waist circumference (WC) was measured midway between the lowest rib and the iliac crest with the subject in an upright position. Blood pressure was measured twice with an appropriately sized cuff after the subjects had been seated for 5 min. The mean value was used for analysis.
Whole body dual energy x-ray absorptiometry (DXA) scan to determine body composition was performed at baseline and 16 weeks after the intervention.
Dietary intake assessment
Dietary intake was assessed using a 3-day food diary (including one weekend day) specifically designed for the intervention participants. Subjects were asked to record everything that they ate and drank over a 3-day period. All completed records were evaluated for average daily nutrient intake using the Computer Aided Nutritional Analysis Program (CAN Pro, Version 5.0, The Korean Nutrition Society, 2015). The intake of macronutrients, as well as total energy, was compared with Dietary Reference Intakes for Koreans (KDRIs) (The Korean Nutrition Society, 2015) [23].
Nutrition diagnosis
Nutrition diagnosis was performed based on three main domains by writing a Problem,
Etiology and Signs/symptoms (PES) statement after communication and collaboration with
other providers of the multidisciplinary team. All data (sociodemographics, health- and diet-related behaviors, NQ, anthropometric data, biochemical data, and dietary intake) was obtained and recorded through nutrition assessment by nutrition professional.
Three domains (categories)
The Nutrition Diagnosis Terminology (IDNT) [24] was used to describe the problem.
Following the nutrition assessment, the nutritional diagnosis was made based on three domains (categories).
- Intake: Too much or too little of a food or nutrient compared to actual or estimated needs - Clinical: Nutrition problems related to medical or physical conditions
- Behavioral-Environmental: Knowledge, attitudes, beliefs, physical environment, access to food, or food safety
PES statement
A specific nutrition problem or nutrition diagnosis was identified and described using a PES statement: Problem related to Etiology as evidenced by Signs and Symptoms. This was done to document the problem, its root cause, and provide evidence for the nutrition diagnosis.
Nutritional intervention
A 16-week nutritional intervention was designed for each subject by a nutrition professional based on that subject's specific nutrition diagnosis. The constructs of social cognitive theory and TTM of change were applied to the intervention to modify participant obesity-related dietary behaviors.
Intervention
Families accompanied the participants on all visits. Each family received a multicomponent obesity intervention program consisting of clinical, nutritional, and physical activity (PA) sessions. PA sessions were randomly assigned for the 16-weekperiod. At the first visit, written informed consent, self-reported surveys, a 3-day food diary, anthropometric measurements, and blood samples were obtained from all participants. On the second to fourth visits, clinical interview and nutritional counseling were provided to participants and their families.
Four month stepped wedge engagements with 4 themes-targeting a balanced diet, portion- control, healthy cooking and maintain healthy weight- were individually delivered based on the NCP protocol to the families and participants. At each nutritional session, the participant and his/her caregiver set their own goals to change unhealthy eating behaviors through assessment of nutrition intake problems. Individual phone contact and counseling appointments were scheduled by the nutrition team.
Components
Components of the nutritional intervention are described in detail in our study protocol.
Each participant problem was identified as an intake (NI) problem, clinical (NC) problem,
or behavioral (NB) problem. Obesity-related dietary problems were treated by nutrition
education (NE-1.1, NE-2.4), nutrition intervention (ND-1.2), priority modification (E-1.2), and
social cognitive theory (C-1.3, C-2.1, C-2.3, C-2.4, C-2.5). Motivation for appropriate nutrient
intake, goal-setting, self-monitoring, problem solving, and social support were delivered to
the participants. Additionally, nutritional prescriptions, nutritional assessments, project
books, practical posters, and 3-day food diaries were provided to the participants. Individual
follow-up and phone contact times were scheduled by the nutrition team.
Monitoring
Monitoring was performed to identify outcomes relevant to the individual diet-related goals of the participants. Following the monthly individual counseling sessions and phone contact, dietary intake, eating behavior changes, and anthropometric status of the participants were evaluated by nutrition professional. Based on the evaluated data, customized nutrition counseling and education were performed for 30 minutes by nutrition professional.
Evaluation and nutritional adherence
All participants had their stage of change (SOC) evaluated according to their TTM
compliance with the intervention program (completed all nutrition and counseling sessions), if they attained diet-related individual goals, achieved a practical mission, and provided nutritional assessment sheet data. Nutritional reassessment was performed for comparison with baseline nutritional status and metabolic profile. The same procedures and equipment were used at baseline and follow-up.
Nutritional adherence was assessed by a nutrition professional using four nutritional diagnosis categories: NI, NB, NC, and TTM based on attending the nutrition and counseling sessions with their parents.
A. NI: Compliance with individual DRIs [23] based on the participant's BMI-z score B. NB: Compliance to attain individual obesity-related dietary behavior goals C. NC: Compliance with anthropometric changes
D. TTM: Compliance with hand-out practical posters from nutrition sessions and 3-day food diaries
E: 100% attendance at nutrition, counseling, and phone sessions.
Statistical analysis
Statistical analyses were performed using the Statistical Package for the Social Sciences (SPSS) version 23(SPSS Inc., Chicago, IL, USA). χ
2tests were performed to compare sociodemographic variables with discontinuous frequencies between participants. To evaluate the significance of group differences in study populations, the Student's t-test and paired t-test were used. Mixed effects linear regression models for repeated measures were used to analyze between-group differences in anthropometrics, data and dietary intake and over time. The intercept was used for mixed model random effects at the individual level. A general linear regression model was used to assess the significance of changes in macronutrient intake and anthropometric variables between groups and the effects of NI, NB, and SOC on TTM interactions. A multiple linear regression model was conducted to test the effects of NI, NB, and SOC as mediators of the effects of the intervention on changes in body composition and macronutrient intake. Analyses were adjusted for age, gender, PA, and mother's and father's education years. A P < 0.05 was considered statistically significant (two-tailed test).
RESULTS
Following recruitment, a total of 103 children and adolescents [mean age: 12.4 years, boys
= 63 (61.2%)] were assessed for eligibility according to the previously described inclusion criteria. Of these 103 children, 69 (67%) were moderate obese (95
thpercentile ≤ BMI < 120%
of the 95
thpercentile) and 34 (33%) were severe obese (120% of the 95
thpercentile ≤ BMI)
(data not shown). There were no significant differences in sociodemographic characteristics
(school and age of the participants, metabolic syndrome-related medical history of the parents, and house income) except for parents' education years between adherent and non- adherent groups (Table 1).
Changes in anthropometric data
Anthropometric data for the participants are described in Table 2. After a 16-week intervention, the adherent group had a lower weight (−0.2 kg vs. 3.3 kg, P = 0.000), BMI (−0.7 kg/m
2vs.
0.0 kg/m
2, P = 0.000), BMI-z score (−0.3 vs. 0.1, P = 0.000), WC (−2.4 vs. 1.6, P = 0.008), fat mass (−1.4 vs. 1.4, P = 0.000), and percentage body fat (−1.5 vs. 0.5, P = 0.001) than the non- adherent after adjusting for age, sex, and PA. Statistically significant (P < 0.05) reductions in Table 1. Sociodemographic characteristics of the participating moderate to severe obese children and adolescents at baseline
Variable All
(n = 103) Adherent
1)(n = 34) Non-adherent
2)(n = 69)
Age 12.4 ± 2.0 12.3 ± 2.1 12.5 ± 2.0
School
Elementary school 54 (52.4) 21 (61.8) 34 (49.3)
Middle school 44 (42.7) 12 (35.3) 31 (44.9)
High school 5 (4.9) 1 (2.9) 4 (5.8)
Household income (KRW)
< 2,000,000 7 (6.8) 2 (7.4) 5 (8.9)
2,000,000–4,000,000 17 (17.5) 6 (22.2) 11 (19.6)
4,000,000–6,000,000 33 (32.0) 12 (44.4) 21 (37.5)
< 6,000,000 26 (25.2) 7 (25.9) 19 (33.9)
Missing 20 (19.4) 7 (20.6) 13 (18.8)
Parents characteristics
Father's education (yrs) 14.8 ± 2.5 16.0 ± 2.0 ** 14.2 ± 2.6
Mother's education (yrs) 13.8 ± 2.5 14.7 ± 2.1 * 13.4 ± 2.6
Metabolic syndrome-related
3)medical
history (mother/father) 30 (29.1)/45 (41.7) 8 (23.5)/15 (44.1) 22 (31.9)/30 (43.5) Values are number (%) or mean ± SDs.
Significantly different between the groups by Student's t-test at * P < 0.05 and ** P < 0.01.
1)
Adherent: participants with good adherence to the intervention program including attendance of clinical and nutrition sessions.
2)
Non-adherent: participants with poor adherence to the intervention program including clinical and nutrition sessions.
3)
Metabolic syndrome-related: hypertension, diabetes, cardiac, stroke, dyslipidemia.
Table 2. Changes in anthropometrics measurements of the participating moderate to severe obese children and adolescents
Variable Adherent
1)(n = 34) Non-adherent
2)(n = 32) P
3)Baseline Follow-up Δ Change (%) Baseline Follow-up Δ Change (%)
Height (cm) 156.9 ± 9.2
1)158.8 ± 9.2 *** 1.9 (1.2) 157.2 ± 10.6 158.8 ± 10.1 *** 1.6 (1.0) 0.087
Weight (kg) 72.0 ± 14.1 71.8 ± 13.6 −0.2 (−0.3) 76.2 ± 19.9 79.4 ± 19.9 *** 3.3 (4.3) 0.000
BMI (kg/m
2) 29.0 ± 3.7 28.3 ± 3.6 *** −0.7 (−2.4) 30.2 ± 4.8 30.2 ± 7.0 0.0 (0.0) 0.000
BMI-z 2.8 ± 0.9 2.6 ± 0.8 *** −0.3 (−8.7) 3.1 ± 0.9 3.3 ± 0.9 *** 0.1 (4.2) 0.000
WC (cm) 94.4 ± 10.0 92.0 ± 11.1 ** −2.4 (−2.5) 95.5 ± 11.7 97.1 ± 13.4 1.6 (1.6) 0.008
WHR 0.9 ± 0.1 0.9 ± 0.1 0.0 (0.0) 0.9 ± 0.1 0.9 ± 0.1 0.0 (0.0) 0.584
LBM (kg) 42.4 ± 8.4 43.2 ± 8.6 * 0.8 (1.9) 44.0 ± 11.2 45.5 ± 11.1 * 1.4 (3.2) 0.946
Body fat (kg) 29.7 ± 6.9 28.4 ± 6.8 *** −1.4 (−4.7) 31.9 ± 9.6 33.2 ± 9.9 1.4 (4.4) 0.000
Body fat (%) 42.3 ± 4.3 40.9 ± 4.8 *** −1.5 (−3.5) 42.9 ± 4.2 43.4 ± 5.4 0.5 (1.2) 0.001
Systolic BP (mm Hg) 125.0 ± 15.1 121.4 ± 12.6 ** −3.6 (−2.9) 124.0 ± 15.8 125.7 ± 15.5 1.7 (1.4) 0.101
Diastolic BP (mm Hg) 65.9 ± 6.1 62.2 ± 8.5 ** −3.6 (−5.4) 67.2 ± 8.3 65.8 ± 7.0 −1.5 (2.3) 0.310
Values are means ± SDs.
Significantly different between groups by paired t-test at * P < 0.05, ** P < 0.01, *** P < 0.001.
1)
Adherent: participants with good adherence to the intervention program including attending clinical and nutrition sessions.
2)
Non-adherent: participants with poor adherence to the intervention program including attending clinical and nutrition sessions.
BMI, body mass index; WC, waist circumference; WHR, waist-to-hip ratio; LBM, lean body mass; BP, blood pressure.
3)
Group × time interaction effects adjusted for age, sex, mother's and father's education years, and physical activity group in the mixed effects linear regression
models (random intercept: individual).
all anthropometric variables except weight and waist-to-hip ratio (WHR) were observed in the adherent group compared to baseline measurements over the 16-week intervention period.
Changes in macronutrients intake of the participants
Nutrient intake changes for the participants and a comparison of nutrient intake and KDRIs between the two groups are shown in Table 3. Sixty-six of the 70 children and adolescents reported their energy intake at baseline and follow-up. At the end of the intervention, lower daily energy intake (27.1%, P < 0.001 in the adherent group, 18.4%, P < 0.01 in the non-adherent group) was reported in both groups. In the adherent group, there was a caloric reduction of 20.4% for boys (−533.2 kcal/d, P < 0.01) and 24.5% for girls (−621.9 kcal/d, P < 0.01), while in the non-adherent group, there was a caloric reduction of 5.6% in boys (−129.8 kcal/d, P < 0.01) and 25.5% in girls (−591.1 kcal/d, P < 0.01). No significant change was found in macronutrient intake ratios in either group, but there was a significant reduction in carbohydrate (17.1%; −54.3 g/d, P
< 0.001), protein (14.3%; −13.5 g/d, P < 0.01) and fat (21.2%; −18.1 g/d, P < 0.001) intake in the adherent group relative to baseline. However, differences between groups were not statistically significant after adjusting for age, sex, and PA using mixed effects regression analysis.
Changes in NI and NB problems of the participants
Changes in NI were assessed during the nutrition diagnosis step by employing IDNT (Fig. 1).
At baseline, most participants (88.2% of adherent and 66.7% of non-adherent participants) were diagnosed with excessive energy intake (NI-2.2). In detail, 97% of adherent and 87%
of non-adherent group participants were diagnosed with excessive fat intake (NI-5.6.2), and 67% of the adherent group and 52% of the non-adherent group were diagnosed with excessive carbohydrate intake (NI-5.8.2). There were no significant differences between groups after the intervention.
The following NB problems were identified: food and nutrition-related knowledge deficits (NB-1.1) (64.7% of adherent and 56.3% of non-adherent participants) and not ready for diet/
lifestyle changes (NB-1.3) (35.3% of adherent and 43.7% of non-adherent group participants) at baseline. After the intervention, 73% of adherent and 18% of non-adherent group
participants had no NB problems. There were no significant differences between groups after the intervention (Fig. 2).
Table 3. Changes in nutrition intake (macronutrient) of the participating moderate to severe obese children and adolescents
Variable Adherent
1)(n = 34) Non-adherent
2)(n = 32) P
4)Baseline Follow-up Δ Change (%) Baseline Follow-up Δ Change (%)
Energy
3)(kcal)
Boys 2,608.3 ± 533.9
1)2,075.1 ± 366.6 ** −533.2 (20.4) 2,299.9 ± 340.4 2,170.2 ± 507.4 ** −129.8 (5.6) 0.165 Girls 2,536.1 ± 436.7 1,914.2 ± 375.4 ** −621.9 (24.5) 2,318.8 ± 340.4 1,727.7 ± 355.9 ** −591.1 (25.5) 168 C:P:F (%) 53.1:15.5:30.9 53.3:16.1:29.7 0.2:0.5:−1.2 54.9:15.2:29.6 53.8:15.7:29.4 −1.1:−0.5:−0.2 0.364 Energy (%) 123.7 ± 26.5
1)96.6 ± 20.1 *** −27.1 (30.4) 108.1 ± 27.7 89.7 ± 21.3 ** −18.4 (27.7) 0.249 Carbohydrate (g) 318.4 ± 64.0 264.1 ± 67.5 *** −54.3 (17.1) 313.9 ± 67.0 265.7 ± 68.9 ** −48.1 (15.3) 0.734
Protein (g) 94.5 ± 24.1 81.0 ± 23.3 ** −13.5 (14.3) 87.6 ± 25.0 79.4 ± 29.5 −8.3 (9.5) 0.280
Fat (g) 85.2 ± 30.6 67.1 ± 27.5 *** −18.1 (21.2) 77.0 ± 27.6 67.6 ± 35.9 −9.3 (12.1) 0.081
Values are means ± SDs.
C:P:F (Carbohydrate: Protein: Fat, Macronutrient intake ratios).
Significantly different between groups by paired t-test at * P < 0.05, ** P < 0.01, *** P < 0.001.
1)
Adherent: participants with good adherence to the intervention program including attending clinical and nutrition sessions.
2)
Non-adherent: participants with poor adherence to the intervention program including attending clinical and nutrition sessions.
3)
Korean Dietary Recommended Intake for children aged 9-11 years: energy intake boys, 2,100 kcal; girls, 1,800 kcal. Protein recommended intake for boys and girls: 40 g/day. KDRI intake for children aged 12–14 years: energy intake boys, 2,500 kcal; girls, 2,000 kcal. Protein recommended intake: 55 g/day for boys and 50 g/day for girls) (Korean Nutrition Society, KDRI, 2015).
4)
Group × time interaction effects adjusted for age, sex, mother's and father's education years, and physical activity group in the mixed effects linear regression
models (random intercept: individual).
SOC of the participants according to the TTM
At baseline, 65% of the participants were at the pre-contemplation (PC) and 34% at the contemplation (C) (Fig. 3). There was a significant difference in the SOC in TTM of the participants (P = 0.000) after 16 weeks of intervention. At 16 weeks, 31% of participants were in the C, 32% were in the ready (R), and the rest of the participants were in the action (A).
After the intervention, 52% of the ready and 41% of the action participants moved from the PC and C stages in the adherent group (P = 0.000). In contrast, only 22% of the low (pre- contemplation and contemplation) SOC participants in the non-adherent group moved to the high (ready and action) SOC group (Fig. 3).
0 0 weeks 16 weeks Adherent
0 weeks 16 weeks Non-adherent
%
60 100
20 40 80
None
NI-2.2 Excessive energy intake
0 0 weeks 16 weeks Adherent
0 weeks 16 weeks Non-adherent
% 60
100
20 40 80
None
NI-2.2 Excessive carbohydrate intake + NI-5.6.2 Excessive fat intake
0 0 weeks 16 weeks Adherent
0 weeks 16 weeks Non-adherent
%
60 100
20 40 80
None
NI-5.8.2 Excessive carbohydrate intake
Fig. 1. Changes in nutritional behavioral status of participants assessed using IDNT.
NI, nutritional intake; IDNT, International Dietetics and Nutrition Terminology.
No significant differences by χ
2test at P < 0.05.
0 0 weeks 16 weeks Adherent
0 weeks 16 weeks Non-adherent
% 60
100
20 40 80
None
NB-1.1 Food- and nutrition-related knowledge deficits NB-1.3 Not ready for diet/lifestyle changes
NB-1.6 Limited adherence to nutrition-related recommendations NB-2.3 Inability or lack of desire to manage self-care
Fig. 2. Changes in nutritional behavioral status of participants assessed using IDNT.
IDNT, International Dietetics and Nutrition Terminology.
No significant differences by χ
2test at P < 0.05.
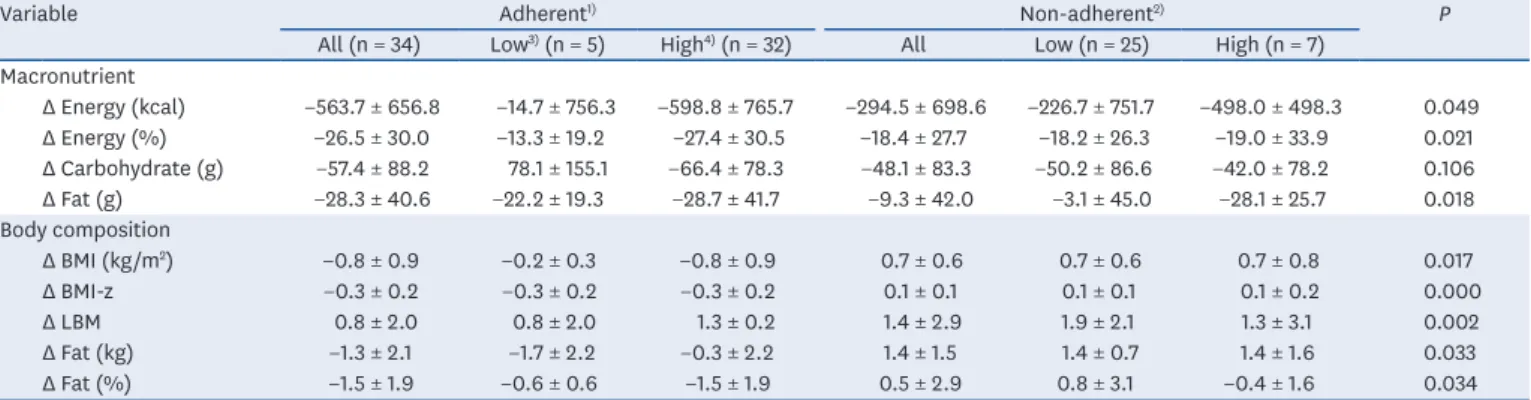
Changes in macronutrient and body composition between groups according to NI, NB diagnosis and SOC in TTM
Macronutrient intake and body composition was diagnosed as being due to NI (NI- 2.2 excessive energy intake) or NB (NB-1.6 limited adherence to nutrition-related
recommendations or NB-2.3 inability or lack of desire to manage self-care) (Supplementary Table 1–2). Consumption of energy, carbohydrates, and fat [energy (%) (−26.5 ± 29.9 vs. −18.4
± 27.7, P < 0.01), carbohydrate (g) (−57.4 ± 88.2 vs. −48.1 ± 83.3, P < 0.01) and fat (g) (−28.3 ± 40.6 vs. −9.3 ± 42.0, P < 0.05)] was significantly lower in the adherent group than the non- adherent group, respectively.
With regard to body composition variables, BMI (kg/m
2) (−0.8 ± 0.9 vs. 0.8 ± 0.6, P < 0.01), BMI-z (−0.3 ± 0.2 vs. 0.1 ± 0.1, P < 0.01), fat (kg) (−1.3 ± 2.1 vs. 1.4 ± 1.5, P < 0.01), and fat (%) (−1.5 ± 1.9 vs. 0.5 ± 2.9, P < 0.01) were lower in the adherent group than the non-adherent group. The exception was LBM (0.8 ± 2.0 vs. 1.4 ± 3.1) (Supplementary Table 1–2).
Participants in both groups were categorized as being at low or high SOC according to the TTM (Table 4). Changes in macronutrient intake and body composition between the groups
Cont
emplation Re ady Action
Maint enance Precont
emplation 0
Precont emplation (A)
Cont
emplation Re ady Action
*** P = 0.000 *** P = 0.000
*** P = 0.000
Maint enance
%
100
40 20 60 80
0
(B)
%
100
40 20 60 80
0
Precont emplation (C)
Cont
emplation Re ady Action
Maint enance
%
100
40 20 60 Baseline 80
Follow-up
Baseline Follow-up
Baseline Follow-up
Fig. 3. Stages of change in the TTM of the participants. (A) All (n = 70) (B) Adherent (n = 34) (C) Non-adherent (n = 32).
TTM, transtheoretical model.
Significantly different between groups by χ
2test at *** P < 0.001.
Table 4. Group differences of changes in macronutrient and body composition according to stage of change in TTM
Variable Adherent
1)Non-adherent
2)P
All (n = 34) Low
3)(n = 5) High
4)(n = 32) All Low (n = 25) High (n = 7) Macronutrient
Δ Energy (kcal) −563.7 ± 656.8 −14.7 ± 756.3 −598.8 ± 765.7 −294.5 ± 698.6 −226.7 ± 751.7 −498.0 ± 498.3 0.049
Δ Energy (%) −26.5 ± 30.0 −13.3 ± 19.2 −27.4 ± 30.5 −18.4 ± 27.7 −18.2 ± 26.3 −19.0 ± 33.9 0.021
Δ Carbohydrate (g) −57.4 ± 88.2 78.1 ± 155.1 −66.4 ± 78.3 −48.1 ± 83.3 −50.2 ± 86.6 −42.0 ± 78.2 0.106
Δ Fat (g) −28.3 ± 40.6 −22.2 ± 19.3 −28.7 ± 41.7 −9.3 ± 42.0 −3.1 ± 45.0 −28.1 ± 25.7 0.018
Body composition
Δ BMI (kg/m
2) −0.8 ± 0.9 −0.2 ± 0.3 −0.8 ± 0.9 0.7 ± 0.6 0.7 ± 0.6 0.7 ± 0.8 0.017
Δ BMI-z −0.3 ± 0.2 −0.3 ± 0.2 −0.3 ± 0.2 0.1 ± 0.1 0.1 ± 0.1 0.1 ± 0.2 0.000
Δ LBM 0.8 ± 2.0 0.8 ± 2.0 1.3 ± 0.2 1.4 ± 2.9 1.9 ± 2.1 1.3 ± 3.1 0.002
Δ Fat (kg) −1.3 ± 2.1 −1.7 ± 2.2 −0.3 ± 2.2 1.4 ± 1.5 1.4 ± 0.7 1.4 ± 1.6 0.033
Δ Fat (%) −1.5 ± 1.9 −0.6 ± 0.6 −1.5 ± 1.9 0.5 ± 2.9 0.8 ± 3.1 −0.4 ± 1.6 0.034
TTM, transtheoretical model; BMI, body mass index; LBM, lean body mass.
Significantly different between groups using group x stage of change interaction effects in the general linear regression model after adjusting for age, sex, mother's and father's education years, and physical activity group covariate at * P < 0.05.
1)
Adherent: participants with good adherence in the intervention program including attending clinical and nutrition sessions.
2)
Non-adherent: participants with poor adherence to the intervention program including attending clinical and nutrition sessions.
3)
Low: in pre-contemplation to contemplation stages of change in the TTM.
4)