ABSTRACT
BACKGROUND/OBJECTIVES: Hypertension is the major risk factor for cardiovascular disease, a leading cause of deaths in Korea. The objective of this study was to evaluate the effect of a nutrition education in reducing sodium intake and increasing potassium intake in hypertensive adults.
SUBJECTS/METHODS: Subjects who participated in this study were 88 adults (28 males and 60 females) who were pre-hypertension or untreated hypertensive patients aged ≥ 30 yrs in Gyeonggi Province, Korea. These subjects were divided into 2 groups: a low- sodium education (LS) group and a low-sodium high-potassium education (LSHP) group.
Nutrition education of 3 sessions for 12 weeks was conducted. Blood pressure, blood and urine components, nutrient intake, and dietary behavior were compared between the two education groups.
RESULT: Blood pressure was decreased in both groups after the nutrition education (P < 0.05).
In the LSHP group, levels of blood glucose (P < 0.05), total cholesterol (P < 0.01), and low- density lipoprotein-cholesterol (P < 0.05) were decreased after the program completion. Sodium intake was decreased in both groups after the nutrition education (P < 0.05). However, Na/K ratio was only decreased in the LS group (P < 0.05). Intake frequency of fish & shellfish was only significantly reduced in the LS group (P < 0.05), while intake frequencies of cooked rice, noodles & dumplings, breads & snacks, stew, kimchi, and fish & shellfish were reduced in the LSHP group (P < 0.05). Total score of dietary behavior appeared to be effectively decreased in both groups after the education program (P < 0.001).
CONCLUSIONS: This education for reducing sodium intake was effective in reducing blood pressure and sodium intake. The education for enhancing potassium intake resulted in positive changes in blood glucose and serum cholesterol levels.
Keywords: Hypertension; sodium; potassium; nutrition education
Original Research
Received: Nov 11, 2019 Revised: Jan 11, 2020 Accepted: Apr 2, 2020
§
Corresponding Author:
Sim-Yeol Lee
Department of Home Economics Education, Dongguk University, 30 Pildong-ro 1-gil, Jung-gu, Seoul 04620, Korea.
Tel. +82-2-2260-3413 Fax. +82-2-2265-1170 E-mail. slee@dongguk.edu
©2020 The Korean Nutrition Society and the Korean Society of Community Nutrition This is an Open Access article distributed under the terms of the Creative Commons Attribution Non-Commercial License (https://
creativecommons.org/licenses/by-nc/4.0/) which permits unrestricted non-commercial use, distribution, and reproduction in any medium, provided the original work is properly cited.
ORCID iDs You-Sin Lee
https://orcid.org/0000-0003-2617-2188 Moo-Yong Rhee
https://orcid.org/0000-0002-1595-3627 Sim-Yeol Lee
https://orcid.org/0000-0003-0375-6412 Funding
This research was supported by grants (13162MFDS106) from the Korea Ministry of Food and Drug Safety in 2013.
You-Sin Lee 1 , Moo-Yong Rhee 2 , and Sim-Yeol Lee 1§
1
Department of Home Economics Education, Dongguk University, Seoul 04620, Korea
2
Cardiovascular Center, Dongguk University Ilsan Hospital, Goyang 10326, Korea
Effect of nutrition education in
reducing sodium intake and increasing potassium intake in hypertensive
adults
Conflict of Interest
The authors declare no potential conflicts of interests.
Author Contributions
Conceptualization: Lee SY, Rhee MY; Formal analysis: Lee SY, Lee YS; Funding acquisition:
Lee SY, Rhee MY; Investigation: Lee SY, Lee YS;
Methodology: Lee SY, Rhee MY; Supervision:
Lee SY; Writing - original draft: Lee YS; Writing - review & editing: Lee SY, Rhee MY.
INTRODUCTION
Hypertension is known as a major risk factor for cardiovascular disease (CVD), the leading cause of deaths among Korean adults [1]. According to the Joint National Committee 7th report, the risk of CVD doubles with each increment of 20/10 mmHg beginning at 115/75 mmHg [2]. The prevalence of hypertension among adults aged 30 yrs or older in Korea is continuously increasing (25.1% in 2007, 30.4% in 2013, and 31.2% in 2017) [3].
Although drug therapy is important in the management of hypertension, changes in life style such as diet improvement, weight control, and exercise are also important. Dietary improvement is known to be effective in the treatment of hypertension. Several studies have reported that excess intake of sodium among dietary factors is the main cause of hypertension [4,5]. Excessive intake of salt, the major source of sodium, increases the volume of blood, leading to an increase in blood pressure [6,7]. For this reason, the World Health Organization (WHO) recommends an average daily intake of sodium intake of less than 2,000 mg per day. However, sodium intake of Korean adults is 182.6% of the reference value [3]. As a policy to reduce sodium intake and reduce the prevalence of hypertension, the government is promoting and educating the reduction of sodium. However, the speed of reducing sodium intake is slow because it can only be effective by changing the taste for salt.
Another way to reduce the incidence of hypertension is by increasing potassium intake to reduce sodium absorption. Potassium is known to prevent blood pressure increase caused by excessive intake of sodium. It is known to have a positive effect on blood pressure control in hypertensive patients [8,9].
The WHO states that it is desirable to reduce the blood pressure by increasing the intake of potassium from vegetables and fruits. Dietary Approaches to Stop Hypertension (DASH) diet emphasizes an integrated intake of nutrients related to blood pressure control, including potassium, to prevent hypertension. However, Korean adults have high sodium intake, while their potassium intake is only 85.1% of adequate intake, which is undesirable for lowering blood pressure [3]. Systematic nutrition education is required to improve such an undesirable diet and practice proper eating habits for the prevention and management of hypertension.
Recently, nutrition education to prevent chronic diseases including hypertension has been implemented in public facilities such as health centers and welfare centers for adults and the elderly in Korea [10-13]. It has been reported that low sodium nutrition education in Korea can induce positive changes in sodium-related nutritional knowledge, dietary behavior, and eating habits, leading to reduced sodium intake and thus a decrease in blood pressure [14,15].
However, hypertension related nutrition education has mostly focused on reduction of sodium intake. Despite increasing potassium intake is expected to have a positive effect on hypertension, studies on the effectiveness of education in increasing potassium intake have not been reported. Therefore, it is necessary to examine effects of nutrition education that emphasizes potassium intake in parallel with low sodium education in improving health index and diet for hypertensive patients.
The purpose of this study was to compare and evaluate effects of a low-sodium education (LS)
and a low-sodium high-potassium education (LSHP) in improving health index and diet for
patients with pre-hypertension and stage 1 hypertension. Results of this study can be used to develop an effective nutrition education program for hypertension management.
SUBJECTS AND METHODS
Subjects
In this study, nutrition education was provided to 195 patients (92 in the LS group; 103 in the LSHP group) with pre-hypertension and stage 1 hypertension among adults aged 30 yrs or older who lived in Gyeonggi province from April 2013 to October 2014. They were not currently taking drugs due to chronic diseases including hypertension. Except for those who were eliminated due to other personal situations, effects of nutrition education were analyzed for final subjects of 88 people (37 in the LS group; 51 in the LSHP group) who participated in the final survey after completing a total of three nutrition education sessions over 12 weeks (Fig. 1). The present study was conducted after obtaining approval (IRB No. 2013-10) from the Institutional Review Board (IRB) of Dongguk University Ilsan Hospital.
Development and implementation of low-sodium nutrition education Nutrition education materials were developed for the 2 groups (LS and LSHP) to compare effects on sodium reduction and potassium increase for high blood pressure adults. These two education programs were provided 3 times each. They were produced in the form of leaflets for subjects, providing basic information on hypertension, correct eating habits, and specific methods to improve eating habits. Contents of these 2 educational materials were the same for sodium reduction. However, low-sodium high-potassium educational materials had additional content for increasing potassium intake (Table 1).
The first session of the low-sodium nutrition education explained the outline and the process of nutrition education in the future. Under the theme of ‘Hypertension and Health’, basic contents of hypertension, including definition of hypertension, types of hypertension and risk factors, symptoms and complications of hypertension, life tips of hypertension, hypertension, and sodium were taught. The first session of low-sodium high-potassium nutrition education described the relationship between hypertension and potassium.
Appropriate food for high blood pressure were also provided in addition to the LS.
The second session of low-sodium nutrition education under the theme ‘Proper eating habits of hypertension’ explained the problem of salty eating habits, how to eat without salt, how to check the nutrition label, and dietary principles for managing hypertension. In the
Time Education
Test Subject
0 weeks 1st Pre-test
n = 195
4 weeks 2nd
Exclude (n = 107)
8 weeks 3rd
12 weeks
Post-test
n = 88
Fig. 1. Study design.
second session of low-sodium high-potassium nutrition education, eating habits of fruits and vegetables containing high potassium were further taught in addition to the LS.
In the third session of low-sodium nutrition education, the theme of ‘Reducing sodium intake’
introduced the cooking method along with effects of low sodium diet, low sodium dietary guidelines, and definition of low sodium diet. It was designed to be used in real life. The third session of LSHP along with LS explained DASH diet, its effect, and utilization method.
The nutrition education in this study was conducted face-to-face three times, once every 4 weeks for the 12-week study period. The education time was about 30 min each time. At that time, subjects did not know about their assigned education group. In addition, after 2 weeks of face-to-face education, subjects were reminded of contents of previous education through telephone education. They were encouraged to practice in real life until the next visit.
Nutrition counseling was provided for practical problems and questions.
Evaluation of the effect of nutrition education
Effects of nutrition education was evaluated by comparing results including anthropometric measurements and blood pressure, biochemical tests (blood, urine component), dietary intake, and dietary behavior related to salt intake between before and after 12 weeks as well as between the 2 groups.
Anthropometric measurement and blood pressure
Height and weight were measured using an automatic anthropometer (GL-150; G-TECH, Uijeongbu, Korea) in lightweight gown, from which the body mass index (BMI) was calculated. Waist circumference was measured using a tape measure up to 0.1 cm between the iliac crest and the lower limit of the rib. Systolic and diastolic blood pressure was measured three times using an automatic blood pressure system (WatchBP office Twin 200;
Microlife Corp., Taipei, Taiwan) and the average value was used for analysis.
Biochemical test
Blood and urine samples were collected for biochemical test. Blood collection was performed in a stable state after fasting for at least 8 h. Blood was separated using a centrifuge (MF-300;
Hanil Science, Incheon, Korea). Serum levels of triglyceride, low-density lipoprotein (LDL)- Table 1. Nutrition education program for subjects with hypertension
Section Themes Topics
Sodium decreasing nutrition program Sodium decreasing & potassium increasing nutrition program
1 Hypertension
and health 1. Definition of hypertension 1. Definition of hypertension, types of hypertension and risk factors 2. Types of hypertension and risk factors 2. Symptoms and complications of hypertension, life tips of
hypertension
3. Symptoms and complications of hypertension 3. Hypertension and sodium
4. Life tips of hypertension 4. Relationship between hypertension and potassium 5. Hypertension and sodium 5. Present appropriate food for high blood pressure
2 Proper eating
habits of hypertension
1. Problem of salty eating habit 1. Problem of salty eating habit, how to eat without salty 2. How to eat without salty 2. How to check the nutrition label, dietary principles for
managing hypertension
3. How to check the nutrition label 3. Fruits and vegetables containing high potassium 4. Dietary principles for managing hypertension 4. Eating habits of fruits and vegetables
3 Reducing
sodium intake 1. Definition of low sodium diet 1. Definition of low sodium diet, Low sodium dietary guidelines 2. Low sodium dietary guidelines 2. Effects of low sodium diet, cooking method of low sodium diet
3. Effects of low sodium diet 3. DASH diet
4. Cooking method of low sodium diet 4. Effect and utilization method of DASH diet
cholesterol, and high-density lipoprotein (HDL)-cholesterol were measured with enzyme colorimetric method (Modular Analytics; Roche, Mannheim, Germany). Fasting glucose level was measured by ultra violet spectrophotometer assay.
Subjects urinated and discarded the urine at 9 am and began urine collection. They were asked to collect urine 24 h until 9 am the next morning. Urine was well mixed with preservatives in the collection container during collection. The container was kept in a cool dark place during the collection period. Creatinine in urine was analyzed using Jaffe Kinetic method. Sodium and potassium were measured with Cobas 8000 (Roche), an automatic biochemical analyzer using ion selective electrode method.
Dietary intake assessment
The dietary intake survey was done for two consecutive days for all subjects using a 24-h recall method. The survey was conducted in person by a trained researcher. Information included the name of each meal, names of ingredients by food, and the amount of intake, including snacks taken the day before the survey. Measurement of the amount of food consumed was done using pre-prepared foods, a model of food, and actual size of a container to help subjects remember accurately. After the survey, food and nutrient intakes were analyzed using CAN-Pro 4.0 (The Korean Nutrition Society, Seoul, Korea, 2011). They were then converted into daily dietary intake [16].
The food intake frequency survey was conducted using the dietary records and dish
frequency questionnaire (DFQ 55) for sodium intake developed by Son et al. [17]. The dietary behavior questionnaire related to salt intake was reorganized into 15 questions related to sodium intake to suit the purpose of this study by referring to previous studies [18-20]. The questions were answered with ‘yes’ and ‘no’ and scored (Yes = 10 points, No = 0 points) based on a total of 150 points. The more the high sodium dietary behavior, the closer the score is to 150 points.
Statistical analysis
All analyses were performed using SAS (Statistical Analysis System) version 9.2 (SAS Institute, Cary, NC, USA). Differences in general characteristics, socioeconomic factors, clinical data, and dietary intake data between the LS group and the LSHP group were examined using Student's t-test for continuous variables and χ
2test for categorical variables.
Statistical significance was defined at P < 0.05.
RESULTS
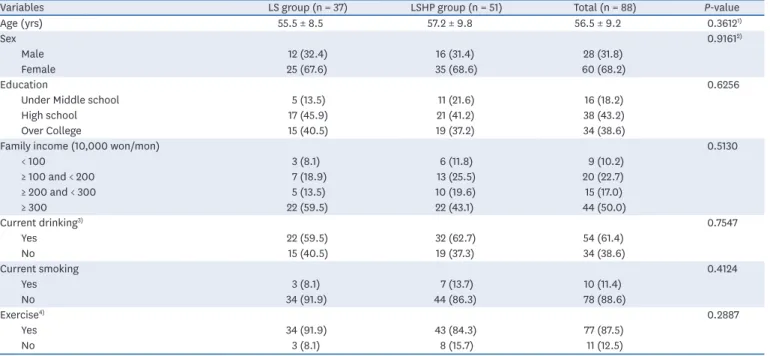
General characteristics of study subjects
The mean age of 88 final subjects (37 in the LS group, 51 in the LSHP group) was 56.5 yrs old.
Regarding gender distribution, it was similar between the 2 groups (32.4% males and 67.6%
females in the LS group vs. 31.4% males and 68.6% females in the LSHP group). Regarding education level, 40.5% of subjects in the LS group and 37.2% in the LSHP group were college graduates or higher. Regarding household income, 59.5% in the LS group and 43.1% in the LSHP group earned more than 3 million won per mon.
Percentage of current drinkers was 59.5% in the LS group and 62.7% in the LSHP group.
Percentage of smokers was 8.1% in the LS group and 13.7% in the LSHP group. Percentage
of those who performed regular exercises was 91.9% in the LS group and 84.3% in the LSHP group, showing no significant difference between the 2 groups (Table 2).
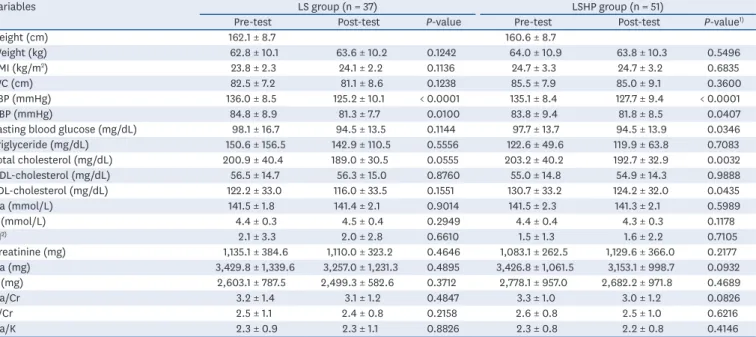
Anthropometric measurements, blood pressure, and biochemical changes Anthropometric measurements, blood pressure, and biochemical changes in blood and urine components of subjects are summarized in Table 3. Systolic blood pressure was significantly decreased from 136.0 mmHg before education to 125.2 mmHg after education in the LS group (P < 0.001) and from 135.1 mmHg before education to 127.7 mmHg after education in the LSHP group (P < 0.001). Diastolic blood pressure decreased significantly from 84.8 mmHg before education to 81.3 mmHg after education in the LS group (P < 0.05) and from 83.8 mmHg before education to 81.8 mmHg after education in the LSHP group (P < 0.05).
Fasting blood glucose did not show any significant change in the LS group. However, it was significantly decreased from 97.7 mg/dL before education to 94.5 mg/dL after education in the LSHP group (P < 0.05). Total cholesterol and LDL-cholesterol levels did not show significant differences between before and after education in the LS group. However, total cholesterol level was significantly (P < 0.05) decreased from 203.2 mg/dL before education to 192.7 mg/dL after education in the LSHP group. LDL-cholesterol was also significantly (P < 0.05) decreased from 130.7 mg/dL before education to 124.2 mg/dL after education in the LSHP group.
Levels of sodium and potassium in urine compounds decreased slightly following education in both groups, although these decreases were not statistically significant. Urinary Na/K ratio was 2.3 in the LS group, showing little difference between before and after education. It decreased slightly from 2.3 to 2.2 in the LSHP group. The decrease was not significant.
Table 2. General characteristics of subjects in LS group and LSHP group
Variables LS group (n = 37) LSHP group (n = 51) Total (n = 88) P-value
Age (yrs) 55.5 ± 8.5 57.2 ± 9.8 56.5 ± 9.2 0.3612
1)Sex 0.9161
2)Male 12 (32.4) 16 (31.4) 28 (31.8)
Female 25 (67.6) 35 (68.6) 60 (68.2)
Education 0.6256
Under Middle school 5 (13.5) 11 (21.6) 16 (18.2)
High school 17 (45.9) 21 (41.2) 38 (43.2)
Over College 15 (40.5) 19 (37.2) 34 (38.6)
Family income (10,000 won/mon) 0.5130
< 100 3 (8.1) 6 (11.8) 9 (10.2)
≥ 100 and < 200 7 (18.9) 13 (25.5) 20 (22.7)
≥ 200 and < 300 5 (13.5) 10 (19.6) 15 (17.0)
≥ 300 22 (59.5) 22 (43.1) 44 (50.0)
Current drinking
3)0.7547
Yes 22 (59.5) 32 (62.7) 54 (61.4)
No 15 (40.5) 19 (37.3) 34 (38.6)
Current smoking 0.4124
Yes 3 (8.1) 7 (13.7) 10 (11.4)
No 34 (91.9) 44 (86.3) 78 (88.6)
Exercise
4)0.2887
Yes 34 (91.9) 43 (84.3) 77 (87.5)
No 3 (8.1) 8 (15.7) 11 (12.5)
Values are presented as mean ± SD or number (%).
LS, low-sodium education; LSHP, low-sodium high-potassium education.
1)
P from t-test.
2)
P from χ
2test.
3)
Current drinking was assigned as ‘yes’ if subjects drank a glass of alcohol or more per month over the previous year.
4)
Exercise was assigned as ‘yes’ if subjects engaged in physical activity at least one day or more per week over the previous week.
Changes in nutrient intake
Results of changes in nutrient intake are shown in Table 4. Energy intake changed from 1,604.2 kcal before education to 1,528.9 kcal after education in the LS group. It significantly decreased from 1,560.1 kcal before education to 1,406.8 kcal after education in the LSHP group (P < 0.05). Intakes of carbohydrates, fats, dietary fiber, and vitamins were not Table 3. Comparison of anthropometric measurements and biochemical indicators between before education and after education in LS group and LSHP group
Variables LS group (n = 37) LSHP group (n = 51)
Pre-test Post-test P-value Pre-test Post-test P-value
1)Height (cm) 162.1 ± 8.7 160.6 ± 8.7
Weight (kg) 62.8 ± 10.1 63.6 ± 10.2 0.1242 64.0 ± 10.9 63.8 ± 10.3 0.5496
BMI (kg/m
2) 23.8 ± 2.3 24.1 ± 2.2 0.1136 24.7 ± 3.3 24.7 ± 3.2 0.6835
WC (cm) 82.5 ± 7.2 81.1 ± 8.6 0.1238 85.5 ± 7.9 85.0 ± 9.1 0.3600
SBP (mmHg) 136.0 ± 8.5 125.2 ± 10.1 < 0.0001 135.1 ± 8.4 127.7 ± 9.4 < 0.0001
DBP (mmHg) 84.8 ± 8.9 81.3 ± 7.7 0.0100 83.8 ± 9.4 81.8 ± 8.5 0.0407
Fasting blood glucose (mg/dL) 98.1 ± 16.7 94.5 ± 13.5 0.1144 97.7 ± 13.7 94.5 ± 13.9 0.0346
Triglyceride (mg/dL) 150.6 ± 156.5 142.9 ± 110.5 0.5556 122.6 ± 49.6 119.9 ± 63.8 0.7083
Total cholesterol (mg/dL) 200.9 ± 40.4 189.0 ± 30.5 0.0555 203.2 ± 40.2 192.7 ± 32.9 0.0032
HDL-cholesterol (mg/dL) 56.5 ± 14.7 56.3 ± 15.0 0.8760 55.0 ± 14.8 54.9 ± 14.3 0.9888
LDL-cholesterol (mg/dL) 122.2 ± 33.0 116.0 ± 33.5 0.1551 130.7 ± 33.2 124.2 ± 32.0 0.0435
Na (mmol/L) 141.5 ± 1.8 141.4 ± 2.1 0.9014 141.5 ± 2.3 141.3 ± 2.1 0.5989
K (mmol/L) 4.4 ± 0.3 4.5 ± 0.4 0.2949 4.4 ± 0.4 4.3 ± 0.3 0.1178
AI
2)2.1 ± 3.3 2.0 ± 2.8 0.6610 1.5 ± 1.3 1.6 ± 2.2 0.7105
Creatinine (mg) 1,135.1 ± 384.6 1,110.0 ± 323.2 0.4646 1,083.1 ± 262.5 1,129.6 ± 366.0 0.2177
Na (mg) 3,429.8 ± 1,339.6 3,257.0 ± 1,231.3 0.4895 3,426.8 ± 1,061.5 3,153.1 ± 998.7 0.0932
K (mg) 2,603.1 ± 787.5 2,499.3 ± 582.6 0.3712 2,778.1 ± 957.0 2,682.2 ± 971.8 0.4689
Na/Cr 3.2 ± 1.4 3.1 ± 1.2 0.4847 3.3 ± 1.0 3.0 ± 1.2 0.0826
K/Cr 2.5 ± 1.1 2.4 ± 0.8 0.2158 2.6 ± 0.8 2.5 ± 1.0 0.6216
Na/K 2.3 ± 0.9 2.3 ± 1.1 0.8826 2.3 ± 0.8 2.2 ± 0.8 0.4146
Values are presented as mean ± SD.
LS, low-sodium education; LSHP, low-sodium high-potassium education; BMI, body mass index; WC, waist circumference; SBP, systolic blood pressure; DBP, diastolic blood pressure; HDL, high-density lipoprotein; LDL, low-density lipoprotein; AI, atherogenic index; Cr, creatinine.
1)
P-value from paired t-test between pre- and post-test within group.
2)
AI: (Total Cholesterol − HDL-cholesterol)/HDL-cholesterol.
Table 4. Comparison of nutrients intakes between before education and after education in LS group and LSHP group
Nutrients LS group (n = 37) LSHP group (n = 51)
Pre-test Post-test P-value Pre-test Post-test P-value
1)Energy (kcal) 1,604.2 ± 524.1 1,528.9 ± 349.4 0.3945 1,560.1 ± 413.7 1,406.8 ± 335.4 0.0137
Carbohydrates (g) 239.6 ± 71.1 250.6 ± 65.8 0.3781 240.0 ± 59.3 229.5 ± 60.0 0.3350
Fat (g) 38.3 ± 17.2 35.4 ± 12.8 0.3625 37.2 ± 17.8 33.8 ± 16.6 0.1480
Protein (g) 61.9 ± 20.8 55.1 ± 17.9 0.0727 61.3 ± 23.6 51.9 ± 17.1 0.0034
Fiber (g) 22.3 ± 8.2 23.2 ± 8.4 0.5959 23.4 ± 7.8 23.6 ± 9.7 0.9187
Vitamin A (ug, RE) 841.0 ± 487.9 783.5 ± 533.5 0.6466 921.2 ± 642.3 842.2 ± 482.9 0.4668
Vitamin C (mg) 117.4 ± 69.7 124.8 ± 79.9 0.6432 129.3 ± 94.6 125.5 ± 80.9 0.8308
Vitamin B
1(mg) 1.2 ± 0.4 1.1 ± 0.4 0.2751 1.2 ± 0.5 1.1 ± 0.4 0.0506
Vitamin B
2(mg) 1.1 ± 0.4 1.0 ± 0.3 0.2290 1.0 ± 0.4 1.0 ± 0.4 0.2402
Niacin (mg) 14.3 ± 5.6 13.1 ± 5.3 0.2976 13.4 ± 4.0 12.3 ± 3.9 0.0988
Folic acid (ug) 497.0 ± 199.1 439.0 ± 125.1 0.1274 502.9 ± 188.5 458.7 ± 199.6 0.1340
Phosphorus (mg) 980.5 ± 316.0 893.4 ± 236.0 0.1251 999.7 ± 289.0 866.3 ± 287.2 0.0028
Iron (mg) 14.1 ± 4.8 14.2 ± 5.3 0.9356 14.7 ± 4.8 13.5 ± 5.0 0.1084
Calcium (mg) 448.1 ± 180.3 408.5 ± 144.1 0.2692 457.8 ± 181.1 412.4 ± 191.7 0.1599
Sodium (mg) 3,122.3 ± 951.5 2,600.8 ± 1,034.0 0.0121 3,194.8 ± 1,202.2 2,766.6 ± 1,057.1 0.0086
Potassium (mg) 2,903.4 ± 1,003.9 2,722.0 ± 760.5 0.3125 3,071.6 ± 929.4 2,836.3 ± 1,037.2 0.1347
Na/K 2.0 ± 0.8 1.7 ± 0.7 0.0429 1.9 ± 0.8 1.7 ± 0.6 0.1434
Values are presented as mean ± SD.
LS, low-sodium education; LSHP, low-sodium high-potassium education.
1)
P-value from paired t-test between pre- and post-test within group.
significantly different between before and after education in either group. Protein intake only decreased in the LSHP group from 61.3 to 51.9 g (P < 0.01). Intake of phosphorus also showed a significant decrease from 999.7 to 866.3 mg in the LSHP group (P < 0.01). Sodium intake significantly decreased from 3,122.3 to 2,600.8 mg (P < 0.05) in the LS group and from 3,194.8 to 2,766.6 mg (P < 0.01) in the LSHP group. The intake of potassium decreased from 2,903.4 to 2,722.0 mg in the LS group and from 3,071.6 to 2,836.3 mg in the LSHP group.
However, these decreases were not statistically significant. Na/K ratio significantly (P < 0.05) decreased from 2.0 before education to 1.7 after education in the LS group. However, it failed to show significant change after education in the LSHP group.
Changes in dish intake
Dish intake frequency was examined by classifying the dish into 10 groups using DFQ 55 (Table 5). In the LS group, only the frequency of fish and shellfish intake decreased significantly from 5.56 times before education to 3.16 times after education (P < 0.05). In the LSHP group, frequencies of the following intakes decreased significantly: cooked rice, from 0.47 to 0.25 times (P < 0.05); noodle and dumplings, from 1.66 to 1.02 times (P < 0.01); bread and snacks, from 0.61 to 0.37 times (P < 0.05); stew, from 2.15 to 1.30 times (P < 0.01); fish and shellfish, from 4.21 to 2.73 times (P < 0.05); and kimchi, from 8.84 to 5.87 times (P < 0.01).
Changes in dietary behavior related to salt intake
Changes in salt intake-related dietary behavior before and after education are shown in Table 6. Comparing before and after nutrition education, scores in total and overall categories of eating behavior decreased in both education groups, indicating positive changes. In both groups, the following dietary behaviors significantly decreased after education: ‘I frequently eat dried fish, salted fish, and salted dry fish’ (P < 0.05), ‘I like salty fermented fishes or salty pickles’ (P < 0.01), ‘When the food or soup is bland, I add more salt or soy sauce’ (P < 0.01),‘I eat a soup or stew (Jigae, Jeon-gol, Tang) at a very high frequency’
(P < 0.05), ‘I eat all of soup and stew broth’ (P < 0.05), ‘I eat deep-fried, pan-fried foods, or raw fish dipped in soy sauce(hot pepper soy paste)’ (P < 0.01), and ‘I don't leave broth of ramen’ (P < 0.01). In the LS group, the following dietary behaviors were significantly reduced after the education: ‘I prefer kimchi to raw vegetables’ (P < 0.05) and ‘I often eat processed or instant food such as ramen, canned foods, and ham’ (P < 0.05). In the LSHP group, the following dietary behaviors were significantly reduced after the education: ‘I eat a lot of salted vegetables like kimchi’ (P < 0.001), ‘I like seasoned rice, or/and bowl of rice Table 5. Comparison of intake frequency of dish group between before education and after education in LS group and LSHP group
Dish group LS group (n = 37) LSHP group (n = 51)
Pre-test Post-test P-value Pre-test Post-test P-value
1)1. Cooked Rice 0.53 ± 0.82 0.42 ± 0.74 0.4380 0.47 ± 0.65 0.25 ± 0.43 0.0146
2. Noodles, dumplings 2.15 ± 2.91 1.55 ± 1.88 0.2078 1.66 ± 1.54 1.02 ± 1.16 0.0014
3. Breads, snacks 0.78 ± 1.54 1.01 ± 1.58 0.4967 0.61 ± 1.17 0.37 ± 0.78 0.0202
4. Soup 1.80 ± 2.13 1.57 ± 2.29 0.4217 1.60 ± 1.67 1.17 ± 1.20 0.0820
5. Stew 2.55 ± 3.38 2.00 ± 2.19 0.3165 2.15 ± 1.82 1.30 ± 1.12 0.0032
6. Fish, shellfish 5.56 ± 6.28 3.16 ± 2.98 0.0128 4.21 ± 4.70 2.73 ± 2.47 0.0247
7. Meats, eggs, soybeans 1.40 ± 1.90 1.35 ± 2.17 0.8929 2.00 ± 3.21 1.37 ± 2.41 0.1509
8. Steamed vegetables, raw vegetables 3.79 ± 3.27 3.86 ± 4.43 0.9051 4.76 ± 4.37 4.38 ± 6.40 0.6785
9. Kimchi 9.47 ± 10.72 7.67 ± 7.35 0.2864 8.84 ± 7.98 5.87 ± 5.84 0.0061
10. Salted spicy pickled vegetables 0.56 ± 1.94 0.01 ± 0.08 0.0947 0.29 ± 0.62 0.16 ± 0.46 0.2535
Values are presented as mean ± SD. Dish intake frequency: 1 time/week= 1.0 (standard score), 3 times/day = 21.0, 2 times/day = 14.0, 1 time/day = 7.0, 5–6 times/
week = 5.5, 3–4 times/week = 3.5, 1–2 times/week = 1.5, 2–3 times/month = 0.63, 1 time/mon = 0.25.
LS, low-sodium education; LSHP, low-sodium high-potassium education.
1)
P-value from paired t-test between pre- and post-test within group.
served with toppings (Dup-bap)’ (P < 0.01), and ‘I prefer Chinese foods to Japanese food’
(P < 0.01). In addition, total scores of salt intake-related eating behaviors were significantly decreased in both groups, changing to desirable eating behaviors (P < 0.001).
DISCUSSION
The average blood pressure of subjects before nutrition education was at a level of pre- hypertension in both LS and LSHP groups. After the education, blood pressures in both groups decreased to nearly normal levels. In general, it takes at least two weeks to reduce the blood pressure through changes in diet. If eating habits are maintained, the blood pressure lowering effect can be sustained. It takes 8 to 12 weeks to change the taste for salt [21,22]. A study of Moon and Kim [11], Son and Kim [13] on hypertension patients in Korea has shown a tendency of decrease in systolic and diastolic blood pressures after nutrition education for 4 weeks and 7 weeks, respectively. Jung et al. [23] have investigated patients with pre- hypertension and found that systolic and diastolic blood pressures are decreased significantly after 16 weeks of nutrition education. The present study also showed that both systolic and diastolic blood pressures were decreased after 12 weeks of nutrition education, indicating that changes in blood pressure might be associated with the duration of education.
Dyslipidemia is a major factor in cardiovascular disease. Hypertension patients require blood pressure and blood lipid management. In the LSHP group, fasting blood glucose, total cholesterol, and LDL-cholesterol levels were significantly decreased after education, resulting in positive effect of nutritional education. The change in blood lipids according to Table 6. Comparison of dietary behaviors related to sodium intake between before education and after education in LS group and LSHP group
Dietary behavior LS group (n = 37) LSHP group (n = 51)
Pre-test Post-test P-value Pre-test Post-test P-value
1)1. I prefer seasoned roast or boiled-down food,
rather than plain roast. 4.6 ± 5.1 2.7 ± 4.5 0.0508 5.9 ± 5.0 4.7 ± 5.0 0.1593
2. I prefer kimchi to raw vegetables. 4.9 ± 5.1 2.4 ± 4.3 0.0105 3.7 ± 4.9 2.9 ± 4.6 0.2521
3. I eat a lot of salted vegetables like kimchi. 4.6 ± 5.1 2.7 ± 4.5 0.0508 4.5 ± 5.0 1.6 ± 3.7 0.0001 4. I like seasoned rice, or/and bowl of rice served
with toppings (Dup-bap). 3.8 ± 4.9 2.4 ± 4.3 0.0960 3.7 ± 4.9 1.6 ± 3.7 0.0064
5. I prefer Chinese foods to Japanese food. 3.0 ± 4.6 1.6 ± 3.7 0.0960 2.7 ± 4.5 1.0 ± 3.0 0.0019
6. I frequently eat dried fish, salted fish and salted
dry fish. 3.0 ± 4.6 0.5 ± 2.3 0.0017 2.2 ± 4.2 0.8 ± 2.7 0.0334
7. I like salty fermented fishes or salty pickles. 3.2 ± 4.7 0.8 ± 2.8 0.0017 3.7 ± 4.9 0.8 ± 2.7 0.0001 8. I often eat potato chips, snacks and crackers as
snacks. 1.1 ± 3.1 0.8 ± 2.8 0.5708 1.0 ± 3.0 0.4 ± 2.0 0.1823
9. When the food or soup is bland, I add more salt
or soy sauce. 4.1 ± 5.0 1.6 ± 3.7 0.0050 3.3 ± 4.8 0.6 ± 2.4 < 0.0001
10. I eat a soup or stew (Jigae, Jeon-gol, Tang) at a
very high frequency. 4.9 ± 5.1 2.4 ± 4.3 0.0179 7.1 ± 4.6 3.7 ± 4.9 < 0.0001
11. I eat all of soup, stew broth. 4.1 ± 5.0 1.6 ± 3.7 0.0105 4.5 ± 5.0 2.0 ± 4.0 0.0004
12. I eat deep-fried, pan-fried foods, or raw fish
dipped in soy sauce (hot pepper soy paste). 3.0 ± 4.6 0.8 ± 2.8 0.0033 1.8 ± 3.9 0.2 ± 1.4 0.0037
13. I eat out (including delivery) or company dinner
2–3 times a week. 3.8 ± 4.9 3.5 ± 4.8 0.7858 2.9 ± 4.6 2.5 ± 4.4 0.4849
14. I don't leave broth of ramen. 3.0 ± 4.6 0.8 ± 2.8 0.0033 2.0 ± 4.0 0.6 ± 2.4 0.0069
15. I often eat processed or instant food such as
ramen, canned foods, and ham. 1.1 ± 3.1 0.0 ± 0.0 0.0438 1.2 ± 3.3 0.4 ± 2.0 0.1030
Total score 49.2 ± 36.8 24.9 ± 21.7 0.0002 47.2 ± 28.6 23.7 ± 16.0 < 0.0001
Values are presented as mean ± SD.
LS, low-sodium education; LSHP, low-sodium high-potassium education.
1)