ABSTRACT
Objective: Previous studies have separately reported the contributions of dietary factors to the risk
of cardiovascular disease (CVD) and its markers, including blood pressure (BP) and lipid profile.
This study systematically reviewed the current evidence on this issue in the Korean population.
Methods: Sixty-two studies from PubMed and Embase were included in this meta-analysis.
We performed a random-effects model to analyze pooled odds ratios (ORs) and hazard ratios (HRs) and their 95% confidence intervals (CIs) for the consumption of 14 food items, three macro- and eight micro-nutrients, two dietary patterns, and three dietary indices.
Results: An analysis of pooled effect sizes from at least four individual study populations
showed significant associations between coffee consumption and CVD (OR/HR, 0.71; 95%
CI, 0.52–0.97) and elevated/high triglycerides (TG) (OR, 0.84; 95% CI, 0.78–0.90), sugar- sweetened beverage intake and elevated BP (OR/HR, 1.20; 95% CI, 1.09–1.33), and milk and dairy intake and elevated/high TG and low high-density lipoprotein cholesterol (HDL-C) (OR/HR, 0.82; 95% CI, 0.76–0.89 for both). Carbohydrate consumption and the low- carbohydrate-diet score were consistently related to an approximately 25% risk reduction for elevated TG and low HDL-C. A lower risk of elevated total cholesterol, but not low-density lipoprotein, was additionally observed for those with a higher low-carbohydrate-diet score.
A healthy dietary pattern was only associated with a reduced risk of elevated TG in the Korea National Cancer Screenee Cohort (OR, 0.81; 95% CI, 0.67–0.98).
Conclusion: This study showed that milk and dairy and coffee had protective effects for CVD
and its risk factors, such as BP and lipid profile, while sugar-sweetened beverages exerted harmful effects.
Keywords:
Dietary; Cardiovascular diseases; Hypertension; Dyslipidemias; Koreans
Original Article
Jeongseon Kim ,
1,*Tung Hoang ,
1,*So Young Bu ,
2Ji-Myung Kim ,
3Jeong-Hwa Choi ,
4Eunju Park ,
5Seung-Min Lee ,
6Eunmi Park ,
7Ji Yeon Min ,
8In Seok Lee ,
9So Young Youn
101 Department of Cancer Biomedical Science, National Cancer Center Graduate School of Cancer Science and Policy, Goyang, Korea
2Department of Food and Nutrition, Daegu University, Gyeongsan, Korea
3Food and Nutrition Major, Division of Food Science and Culinary Arts, Shinhan University, Uijeongbu, Korea
4Department of Food and Nutrition, Keimyung University, Daegu, Korea
5Department of Food and Nutrition, Kyungnam University, Changwon, Korea
6Department of Food and Nutrition, Yonsei University, Seoul, Korea
7Department of Food and Nutrition, Hannam University, Daejeon, Korea
8Dietetics and Nutrition Services Team, Asan Medical Center, Seoul, Korea
9Nutrition Support Team, Kyung Hee University Medical Center, Seoul, Korea
10Clinical Nutrition Part, Samsung Medical Center, Seoul, Korea
Associations of Dietary Intake with Cardiovascular Disease, Blood
Pressure, and Lipid Profile in the Korean Population: a Systematic Review and Meta-Analysis
Received: Jan 3, 2020 Revised: Jan 9, 2020 Accepted: Jan 10, 2020 Correspondence to Jeongseon Kim
Department of Cancer Biomedical Science, National Cancer Center Graduate School of Cancer Science and Policy, 323 Ilsan-ro, Ilsandong-gu, Goyang 10408, Korea.
E-mail: [email protected]
*Jeongseon Kim and Tung Hoang contributed equally as the first author.
Copyright © 2020 The Korean Society of Lipid and Atherosclerosis.
This is an Open Access article distributed under the terms of the Creative Commons Attribution Non-Commercial License (https://
creativecommons.org/licenses/by-nc/4.0/) which permits unrestricted non-commercial use, distribution, and reproduction in any medium, provided the original work is properly cited.
ORCID iDs Jeongseon Kim
https://orcid.org/0000-0002-0889-2686 Tung Hoang
https://orcid.org/0000-0001-6653-3406 So Young Bu
https://orcid.org/0000-0001-9801-5435 Ji-Myung Kim
https://orcid.org/0000-0002-5965-9681 Jeong-Hwa Choi
https://orcid.org/0000-0003-4730-6544 Eunju Park
https://orcid.org/0000-0002-3462-6090
Seung-Min Lee
https://orcid.org/0000-0002-3443-5286 Eunmi Park
https://orcid.org/0000-0002-1911-4652 Ji Yeon Min
https://orcid.org/0000-0002-9979-137X In Seok Lee
https://orcid.org/0000-0001-5218-8090 So Young Youn
https://orcid.org/0000-0003-0750-2727 Funding
This study was supported by Korean Society of Lipid and Atherosclerosis and National Cancer Center, Korea (1910330).
Conflict of Interest
The authors have no conflicts of interest to declare. The funders had no role in study design, data collection and analysis, decision to publish, or preparation of the manuscript.
Author Contributions
Conceptualization: Kim J, Hoang T, Bu SY, Kim JM, Choi JH, Park E, Lee SM, Park E, Min JY, Lee IS, Youn SY; Data curation: Kim J, Hoang T; Formal analysis: Hoang T; Funding acquisition: Kim J; Investigation: Kim J, Hoang T, Bu SY, Kim JM, Choi JH, Park E, Lee SM, Park E, Min JY, Lee IS, Youn SY; Methodology:
Kim J, Hoang T, Bu SY, Kim JM, Choi JH, Park E, Lee SM, Park E, Min JY, Lee IS, Youn SY;
Project administration: Kim J; Supervision:
Kim J; Validation: Kim J, Bu SY, Kim JM, Choi JH; Visualization: Hoang T; Writing - original draft: Hoang T; Writing - review & editing: Kim J, Hoang T, Bu SY, Kim JM, Choi JH, Park E, Lee SM, Park E, Min JY, Lee IS, Youn SY.
INTRODUCTION
Cardiovascular disease (CVD) has remained the leading cause of non-communicable disease mortality globally over the past decade,
1-3as it was estimated to cause 17.8 million deaths according to the Global Burden of Diseases 2017 study, reflecting an increase of approximately 21% compared to the burden in 2007.
1While age-standardized CVD prevalence was reported to decline between 1990 and 2005 in most high- and middle-income countries, no significant change was observed in most Asian countries.
4In South Korea, the age-adjusted mortality rate of all heart diseases showed a 79.9% decline in men and 77.6% decline in women during the 30-year period from 1983 to 2012, although the rate was consistently higher in men than in women.
5The decreasing trend in CVD mortality might be explained both by advances in disease treatments and by changes in lifestyle and nutritional factors affecting CVD risk.
3,6Hypertension and dyslipidemia have been consistently recognized as risk factors for CVD.
7-10Results from the Asia Pacific Cohort Studies Collaboration revealed that the population- attributable risks for high blood pressure (BP) and high total cholesterol (TC) were first (28.6%) and third (6.5%) highest in Asian men, and first (30.5%) and second (8.2%) highest in Asian women among single risk factors.
11Additionally, findings from the Korean Heart Study with a median follow-up of 11.6 years showed a significantly elevated risk of coronary heart disease (CHD) among those with elevated or high levels of BP, TC, triglyceride (TG), or low-density lipoprotein cholesterol (LDL-C), and those with low levels of high-density lipoprotein cholesterol (HDL-C).
12However, age-adjusted data from nationwide studies in 1980–1990 and the Korea National Health and Nutrition Examination Survey (KNHANES) in 1998–2012 showed a decreasing trend of hypertension, but an increasing trend of hypercholesterolemia.
7,13In contrast, recent updates have reported a significant increase in the prevalence of elevated BP and hypercholesterolemia. Among modifiable risk factors, appropriate nutritional behavior is the most fundamental step that individuals can take to prevent hypertension
14and dyslipidemia,
15which is expected to decrease the risk of CVD; therefore, poor-quality diets themselves also play a vital role in the development of CVD.
16Recent guidelines for the management of hypertension
17and dyslipidemia,
18with a particular focus on dietary recommendations, have been published. However, several of these recommendations were based on guidelines in Western countries and extrapolated for the Korean population. Therefore, we conducted this meta-analysis to systematically review the current evidence regarding the associations of dietary intake with CVD, hypertension, and dyslipidemia.
MATERIALS AND METHODS
1. Data source and literature search
We systematically searched the PubMed and Embase databases from their inception to
December 12, 2019, following the Preferred Reporting Items for Systematic Reviews
and Meta-Analyses (PRISMA) guidelines.
19The search terms, which were based on the
Population, Intervention, Comparison, and Outcome (PICO) guideline,
20contained dietary
intake and its synonyms as exposure (“diet,” “dietary,” “intake,” and “consumption”);
cardiovascular disease, hypertension, and dyslipidemia as outcomes (“cardiovascular disease,” “coronary heart disease,” “heart attack,” “myocardial infarction,” “cerebrovascular disease,” “stroke,” “peripheral vascular disease,” “heart failure,” “rheumatic heart
disease,” “congenital heart disease,” “cardiomyopathy,” “hypertension,” “blood pressure,”
“dyslipidemia,” “hyperlipidemia,” “cholesterol,” “high-density lipoprotein,” “low-density lipoprotein,” and “triglyceride”); and the Korean population (“Korea” and “Korean”). No limitation was placed on language of publication or the format (abstract or full-text), but a restriction was placed on conference abstracts with no published full-text version.
2. Inclusion and exclusion criteria
All studies evaluating the association between dietary intake and CVD, hypertension, or dyslipidemia risk in the Korean population were eligible for this meta-analysis. The inclusion criteria were as follows: i) the study was conducted on the Korean population; ii) the
exposure was dietary intake of any food items, dietary patterns, or dietary indices; iii) the outcome was any CVDs, elevated BP or hypertension, or abnormalities in any lipid markers including TC, TG, HDL-C, and LDL-C; and iv) odds ratios (ORs) or hazard ratios (HRs) and their corresponding 95% confidence intervals (CIs) were reported for the association between exposures and binary outcomes. When studies overlapped in both the exposure and outcome, the most comprehensive one was selected for the final analysis.
3. Data extraction
Two researchers (T.H. and J.K.) independently selected the studies based on the eligibility criteria and extracted the following information: first author's name, publication year, project name, study design, duration of participant recruitment, follow-up time (for prospective studies only), sample size, type of exposure, type of outcome, confounding variables, and ORs/HRs with their 95% CIs of the highest quantile in the comparison with the lowest quantile from the model that adjusted for the highest number of potential confounders. For studies that selected the highest level of consumption as the reference group, ORs/HRs and 95% CIs were recalculated to obtain the effect size using the lowest level of consumption as the reference.
4. Quality assessment
The methodological quality of individual studies was assessed according to the Newcastle Ottawa Scale (NOS) for cross-sectional, case-control, and cohort studies.
21,22Two investigators (T.H. and J.K.) independently scored each study according to the three
subscales of the NOS: study selection, comparability, and exposure (or outcome) assessment.
All discrepancies were addressed and judged by other co-authors. We considered studies with scores of 6 or higher to be high-quality studies. Additionally, we evaluated the level of evidence for nutritional findings according to the modified Joint World Health Organization- Food and Agriculture Expert Consultation criteria.
23Evidence was considered “possible”
when a finding was consistent with a previous meta-analysis of prospective studies with no significant heterogeneity.
23Evidence was considered “limited” when a finding was consistent with either a meta-analysis of prospective studies with significant heterogeneity or a meta- analysis of case-control or cross-sectional studies.
23Evidence was deemed “insufficient”
when a finding was consistent with a meta-analysis of 2 or fewer studies.
235. Statistical analysis
When a pooled effect size was generated from at least two individual studies, heterogeneity
across studies was assessed by computing the I
2statistic, for which an I
2value greater than
50% implies substantial heterogeneity.
24By assuming that all studies were conducted on study participants with different characteristics, we applied a random-effects model with the DerSimonian and Laird method to obtain the pooled effect size.
25We also performed subgroup analyses by study design and study population. Publication bias was tested using the Begg funnel plot and the Egger test
26,27when at least 5 studies were available.
RESULTS
1. Study selection
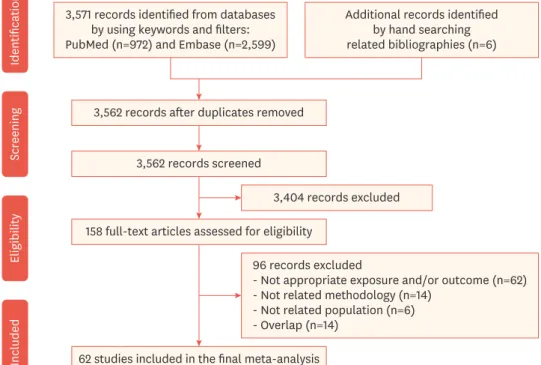
Of the 3,577 records identified through an electronic search from databases and hand searches of bibliographies, 3,562 articles were assessed based on their title and abstract after removing duplicates. Of those studies, 3,404 were not relevant and the full texts of the 158 remaining articles were assessed for the eligibility criteria. Ninety-six articles were additionally excluded because of the following reasons: inappropriate exposure and/or outcome (n=62), unrelated methodology (n=14), unrelated population (n=6), and overlapping study population (n=14). Therefore, 62 studies,
28-89including 42 cross-sectional, 3 case-control, and 17 cohort studies, were finally included in the systematic review and meta-analysis (Fig. 1).
2. Study characteristics and quality assessment
Supplementary Table 1 details the general characteristics of individual studies. Forty-
nine articles (including 34 cross-sectional and case-control studies, and 15 cohort studies) reported ORs/HRs for single food items, macronutrients, and micronutrients; three cross-sectional studies provided ORs for dietary indices; and 10 articles (including 8 cross- sectional and 2 cohort studies) reported ORs/HRs for dietary patterns. The studies were from
3,571 records identified from databases by using keywords and filters:
PubMed (n=972) and Embase (n=2,599)
IdentificationScreeningEligibilityIncluded
Additional records identified by hand searching related bibliographies (n=6)
3,562 records after duplicates removed
3,562 records screened
3,404 records excluded 158 full-text articles assessed for eligibility
62 studies included in the final meta-analysis 96 records excluded
- Not appropriate exposure and/or outcome (n=62) - Not related methodology (n=14)
- Not related population (n=6) - Overlap (n=14)
Fig. 1. Flowchart of study selection.
the Korea National Health and Nutrition Examination Survey (KNHANES) (n=31), the Ansan- Ansung or Urban cohort (n=19), the Health Examinee (HEXA) cohort (n=5), the National Sample cohort (n=1), the Korea National Cancer Screenee Cohort (KNCC) (n=2), and hospital and/or community-based studies (n=4).
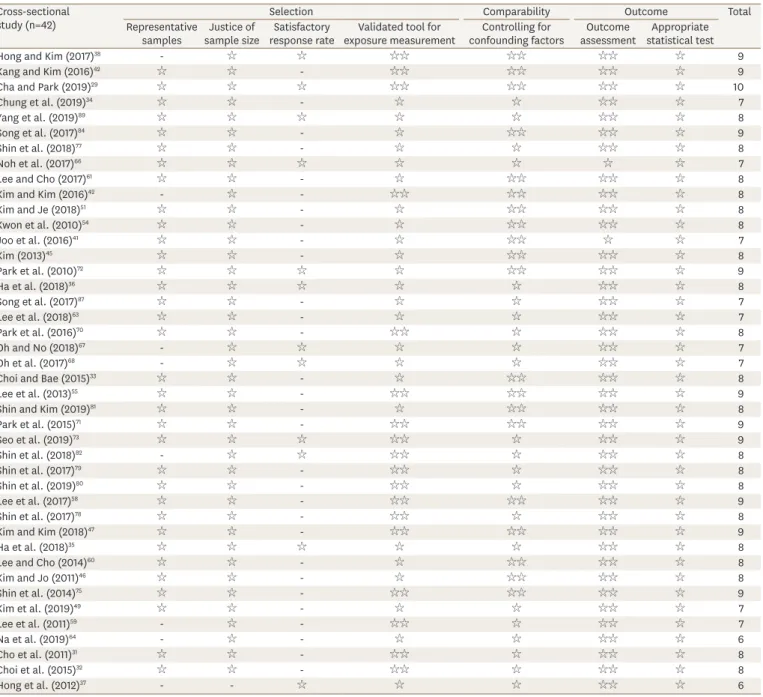
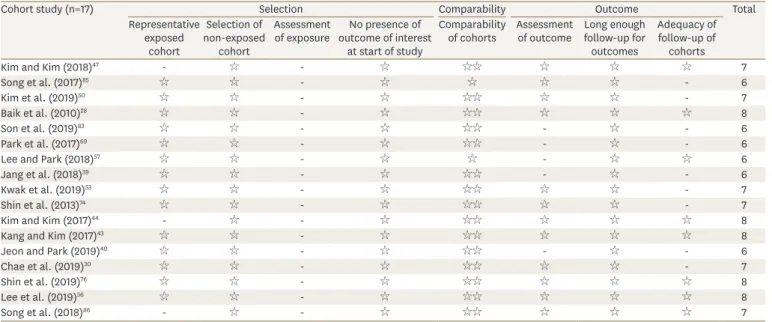
Tables 1-3 presents the quality assessment for individual studies based on the NOS. All the
studies were deemed to be high-quality, with NOS scores of at least 6. The median quality scores were 8 (out of a total of 10) for cross-sectional studies, 6 (out of a total of 9) for case- control studies, and 7 (out of a total of 9) for cohort studies. Most of the cross-sectional studies showed selection bias, with different characteristics between responders and non- responders. For case-control studies, selection bias was reported for controls and unblinded
Table 1. Quality assessment of cross-sectional studies based on the Newcastle-Ottawa Scale Cross-sectional
study (n=42) Selection Comparability Outcome Total
Representative
samples Justice of
sample size Satisfactory
response rate Validated tool for
exposure measurement Controlling for
confounding factors Outcome
assessment Appropriate statistical test
Hong and Kim (2017)38 - ☆ ☆ ☆☆ ☆☆ ☆☆ ☆ 9
Kang and Kim (2016)42 ☆ ☆ - ☆☆ ☆☆ ☆☆ ☆ 9
Cha and Park (2019)29 ☆ ☆ ☆ ☆☆ ☆☆ ☆☆ ☆ 10
Chung et al. (2019)34 ☆ ☆ - ☆ ☆ ☆☆ ☆ 7
Yang et al. (2019)89 ☆ ☆ ☆ ☆ ☆ ☆☆ ☆ 8
Song et al. (2017)84 ☆ ☆ - ☆ ☆☆ ☆☆ ☆ 9
Shin et al. (2018)77 ☆ ☆ - ☆ ☆ ☆☆ ☆ 8
Noh et al. (2017)66 ☆ ☆ ☆ ☆ ☆ ☆ ☆ 7
Lee and Cho (2017)61 ☆ ☆ - ☆ ☆☆ ☆☆ ☆ 8
Kim and Kim (2016)42 - ☆ - ☆☆ ☆☆ ☆☆ ☆ 8
Kim and Je (2018)51 ☆ ☆ - ☆ ☆☆ ☆☆ ☆ 8
Kwon et al. (2010)54 ☆ ☆ - ☆ ☆☆ ☆☆ ☆ 8
Joo et al. (2016)41 ☆ ☆ - ☆ ☆☆ ☆ ☆ 7
Kim (2013)45 ☆ ☆ - ☆ ☆☆ ☆☆ ☆ 8
Park et al. (2010)72 ☆ ☆ ☆ ☆ ☆☆ ☆☆ ☆ 9
Ha et al. (2018)36 ☆ ☆ ☆ ☆ ☆ ☆☆ ☆ 8
Song et al. (2017)87 ☆ ☆ - ☆ ☆ ☆☆ ☆ 7
Lee et al. (2018)63 ☆ ☆ - ☆ ☆ ☆☆ ☆ 7
Park et al. (2016)70 ☆ ☆ - ☆☆ ☆ ☆☆ ☆ 8
Oh and No (2018)67 - ☆ ☆ ☆ ☆ ☆☆ ☆ 7
Oh et al. (2017)68 - ☆ ☆ ☆ ☆ ☆☆ ☆ 7
Choi and Bae (2015)33 ☆ ☆ - ☆ ☆☆ ☆☆ ☆ 8
Lee et al. (2013)55 ☆ ☆ - ☆☆ ☆☆ ☆☆ ☆ 9
Shin and Kim (2019)81 ☆ ☆ - ☆ ☆☆ ☆☆ ☆ 8
Park et al. (2015)71 ☆ ☆ - ☆☆ ☆☆ ☆☆ ☆ 9
Seo et al. (2019)73 ☆ ☆ ☆ ☆☆ ☆ ☆☆ ☆ 9
Shin et al. (2018)82 - ☆ ☆ ☆☆ ☆ ☆☆ ☆ 8
Shin et al. (2017)79 ☆ ☆ - ☆☆ ☆ ☆☆ ☆ 8
Shin et al. (2019)80 ☆ ☆ - ☆☆ ☆ ☆☆ ☆ 8
Lee et al. (2017)58 ☆ ☆ - ☆☆ ☆☆ ☆☆ ☆ 9
Shin et al. (2017)78 ☆ ☆ - ☆☆ ☆ ☆☆ ☆ 8
Kim and Kim (2018)47 ☆ ☆ - ☆☆ ☆☆ ☆☆ ☆ 9
Ha et al. (2018)35 ☆ ☆ ☆ ☆ ☆ ☆☆ ☆ 8
Lee and Cho (2014)60 ☆ ☆ - ☆ ☆☆ ☆☆ ☆ 8
Kim and Jo (2011)46 ☆ ☆ - ☆ ☆☆ ☆☆ ☆ 8
Shin et al. (2014)75 ☆ ☆ - ☆☆ ☆☆ ☆☆ ☆ 9
Kim et al. (2019)49 ☆ ☆ - ☆ ☆ ☆☆ ☆ 7
Lee et al. (2011)59 - ☆ - ☆☆ ☆ ☆☆ ☆ 7
Na et al. (2019)64 - ☆ - ☆ ☆ ☆☆ ☆ 6
Cho et al. (2011)31 ☆ ☆ - ☆☆ ☆ ☆☆ ☆ 8
Choi et al. (2015)32 ☆ ☆ - ☆☆ ☆ ☆☆ ☆ 8
Hong et al. (2012)37 - - ☆ ☆ ☆ ☆☆ ☆ 6
interviews about dietary intake, as well as exposure bias for not reporting the non-response rate. For cohort studies, outcome bias regarding unblinded assessments was reported.
3. Main analysis
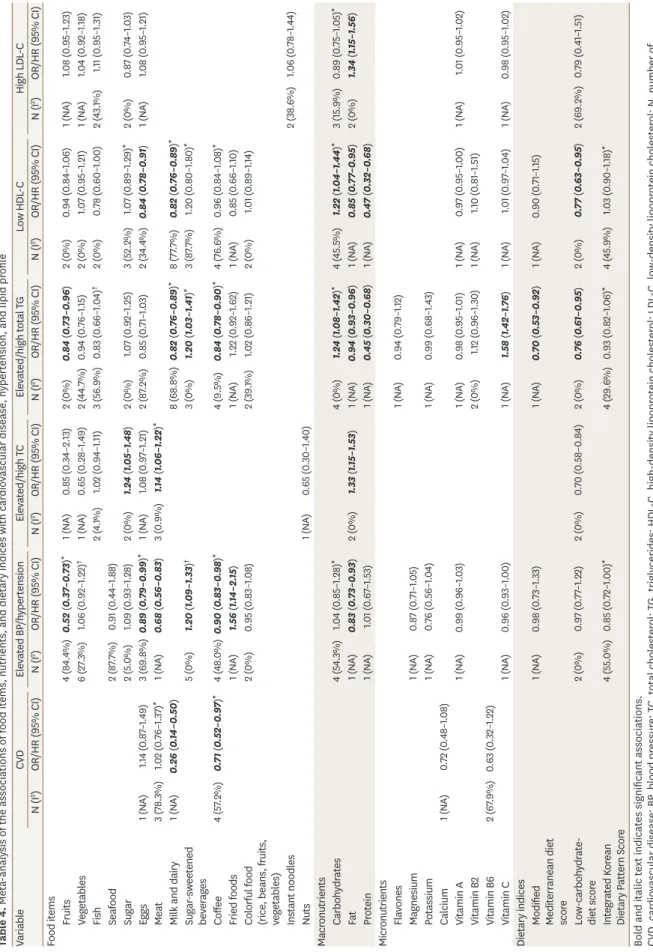
A comprehensive evaluation of single food items, micronutrients, macronutrients, and dietary indices and their associations with CVD, hypertension, and lipid profile is presented in Table 4. Overall, higher fruit intake was associated with a lower risk of elevated BP/
hypertension (OR/HR, 0.52; 95% CI, 0.37–0.73) and elevated/high TG (OR, 0.84; 95% CI, 0.73–0.96), whereas egg intake was found to be associated with a reduced risk of elevated BP/hypertension (OR/HR, 0.89; 95% CI, 0.79–0.99) and low HDL-C (OR, 0.84; 95% CI, 0.78–0.91). Negative associations were found between consumption of milk and dairy and the risks of CVD, elevated/high TG, and low HDL-C. “Limited” evidence was found for an inverse association between coffee consumption and CVD (OR, 0.71; 95% CI, 0.52–0.97) and elevated/high TG (OR, 0.84; 95% CI, 0.78–0.90). In addition, subjects with elevated BP/
hypertension were less likely to consume meat (HR, 0.68; 95% CI, 0.56–0.83) and coffee (OR, 0.90; 95% CI, 0.83–0.98). In contrast, significant associations were found between sugar and meat intake and the risk of elevated/high TC, with ORs (95% CIs) of 1.24 (1.05–1.48) and 1.14 (1.06–1.22), respectively. Sugar-sweetened beverage intake was also significantly related with a 20% increased risk of elevated BP/hypertension (OR/HR, 1.20; 95% CI, 1.09–1.33) and elevated/high TG (OR, 1.20; 95% CI, 1.03–1.41) based on possible evidence. Moreover, insufficient evidence showed a higher risk of elevated BP/hypertension among those with a higher intake of fried foods, with an OR (95% CI) of 1.56 (1.14–2.15).
Table 2. Quality assessment of case-control studies based on the Newcastle-Ottawa Scale
Case-control study (n=3) Selection Comparability Expose Total
Adequate definition of cases
Representative
cases Selection
of controls Definition
of controls Comparability of cases and
controls
Exposure
ascertainment Same ascertainment criteria for cases
and controls
Non-response rate
Lee et al. (2015)62 ☆ ☆ ☆ ☆ ☆ - ☆ ☆ 7
Suh et al. (2001)88 ☆ ☆ - ☆ ☆☆ - ☆ - 6
Nam et al. (2003)65 ☆ ☆ - ☆ ☆☆ - ☆ - 6
Table 3. Quality assessment of cohort studies based on the Newcastle-Ottawa Scale
Cohort study (n=17) Selection Comparability Outcome Total
Representative exposed
cohort
Selection of non-exposed
cohort
Assessment
of exposure No presence of outcome of interest
at start of study
Comparability
of cohorts Assessment
of outcome Long enough follow-up for outcomes
Adequacy of follow-up of
cohorts
Kim and Kim (2018)47 - ☆ - ☆ ☆☆ ☆ ☆ ☆ 7
Song et al. (2017)85 ☆ ☆ - ☆ ☆ ☆ ☆ - 6
Kim et al. (2019)50 ☆ ☆ - ☆ ☆☆ ☆ ☆ - 7
Baik et al. (2010)28 ☆ ☆ - ☆ ☆☆ ☆ ☆ ☆ 8
Son et al. (2019)83 ☆ ☆ - ☆ ☆☆ - ☆ - 6
Park et al. (2017)69 ☆ ☆ - ☆ ☆☆ - ☆ - 6
Lee and Park (2018)57 ☆ ☆ - ☆ ☆ - ☆ ☆ 6
Jang et al. (2018)39 ☆ ☆ - ☆ ☆☆ - ☆ - 6
Kwak et al. (2019)53 ☆ ☆ - ☆ ☆☆ ☆ ☆ - 7
Shin et al. (2013)74 ☆ ☆ - ☆ ☆☆ ☆ ☆ - 7
Kim and Kim (2017)44 - ☆ - ☆ ☆☆ ☆ ☆ ☆ 8
Kang and Kim (2017)43 ☆ ☆ - ☆ ☆☆ ☆ ☆ ☆ 8
Jeon and Park (2019)40 ☆ ☆ - ☆ ☆☆ - ☆ - 6
Chae et al. (2019)30 ☆ ☆ - ☆ ☆☆ ☆ ☆ - 7
Shin et al. (2019)76 ☆ ☆ - ☆ ☆☆ ☆ ☆ ☆ 8
Lee et al. (2019)56 ☆ ☆ - ☆ ☆☆ ☆ ☆ ☆ 8
Song et al. (2018)86 - ☆ - ☆ ☆☆ ☆ ☆ ☆ 7
Table 4. Meta-analysis of the associations of food items, nutrients, and dietary indices with cardiovascular disease, hypertension, and lipid profile VariableCVDElevated BP/hypertensionElevated/high TCElevated/high total TGLow HDL-CHigh LDL-C N (I2)OR/HR (95% CI)N (I2)OR/HR (95% CI)N (I2)OR/HR (95% CI)N (I2)OR/HR (95% CI)N (I2)OR/HR (95% CI)N (I2)OR/HR (95% CI) Food items Fruits4 (84.4%)0.52 (0.37–0.73)*1 (NA)0.85 (0.34–2.13)2 (0%)0.84 (0.73–0.96)2 (0%)0.94 (0.84–1.06)1 (NA)1.08 (0.95–1.23) Vegetables6 (27.3%)1.06 (0.92–1.22)†1 (NA)0.65 (0.28–1.49)2 (44.7%)0.94 (0.76–1.15)2 (0%)1.07 (0.95–1.21)1 (NA)1.04 (0.92–1.18) Fish2 (4.1%)1.02 (0.94–1.11)3 (56.9%)0.83 (0.66–1.04)†2 (0%)0.78 (0.60–1.00)2 (43.1%)1.11 (0.95–1.31) Seafood2 (87.7%)0.91 (0.44–1.88) Sugar2 (5.0%)1.09 (0.93–1.28)2 (0%)1.24 (1.05–1.48)2 (0%)1.07 (0.92–1.25)3 (52.2%)1.07 (0.89–1.29)*2 (0%)0.87 (0.74–1.03) Eggs1 (NA)1.14 (0.87–1.49)3 (69.8%)0.89 (0.79–0.99)*1 (NA)1.08 (0.97–1.21)2 (87.2%)0.85 (0.71–1.03)2 (34.4%)0.84 (0.78–0.91)1 (NA)1.08 (0.95–1.21) Meat3 (78.3%)1.02 (0.76–1.37)*1 (NA)0.68 (0.56–0.83)3 (0.9%)1.14 (1.06–1.22)* Milk and dairy1 (NA)0.26 (0.14–0.50)8 (68.8%)0.82 (0.76–0.89)*8 (77.7%)0.82 (0.76–0.89)* Sugar-sweetened beverages5 (0%)1.20 (1.09–1.33)†3 (0%)1.20 (1.03–1.41)*3 (87.7%)1.20 (0.80–1.80)* Coffee4 (57.2%)0.71 (0.52–0.97)*4 (48.0%)0.90 (0.83–0.98)*4 (9.5%)0.84 (0.78–0.90)*4 (76.6%)0.96 (0.84–1.08)* Fried foods1 (NA)1.56 (1.14–2.15)1 (NA)1.22 (0.92–1.62)1 (NA)0.85 (0.66–1.10) Colorful food (rice, beans, fruits, vegetables)
2 (0%)0.95 (0.83–1.08)2 (39.1%)1.02 (0.86–1.21)2 (0%)1.01 (0.89–1.14) Instant noodles2 (38.6%)1.06 (0.78–1.44) Nuts1 (NA)0.65 (0.30–1.40) Macronutrients Carbohydrates4 (54.3%)1.04 (0.85–1.28)*4 (0%)1.24 (1.08–1.42)*4 (45.5%)1.22 (1.04–1.44)*3 (15.9%)0.89 (0.75–1.05)* Fat1 (NA)0.83 (0.73–0.93)2 (0%)1.33 (1.15–1.53)1 (NA)0.94 (0.93–0.96)1 (NA)0.85 (0.77–0.95)2 (0%)1.34 (1.15–1.56) Protein1 (NA)1.01 (0.67–1.53)1 (NA)0.45 (0.30–0.68)1 (NA)0.47 (0.32–0.68) Micronutrients Flavones1 (NA)0.94 (0.79–1.12) Magnesium1 (NA)0.87 (0.71–1.05) Potassium1 (NA)0.76 (0.56–1.04)1 (NA)0.99 (0.68–1.43) Calcium1 (NA)0.72 (0.48–1.08) Vitamin A1 (NA)0.99 (0.96–1.03)1 (NA)0.98 (0.95–1.01)1 (NA)0.97 (0.95–1.00)1 (NA)1.01 (0.95–1.02) Vitamin B22 (0%)1.12 (0.96–1.30)1 (NA)1.10 (0.81–1.51) Vitamin B62 (67.9%)0.63 (0.32–1.22) Vitamin C1 (NA)0.96 (0.93–1.00)1 (NA)1.58 (1.42–1.76)1 (NA)1.01 (0.97–1.04)1 (NA)0.98 (0.95–1.02) Dietary indices Modified Mediterranean diet score
1 (NA)0.98 (0.73–1.33)1 (NA)0.70 (0.53–0.92)1 (NA)0.90 (0.71–1.15) Low-carbohydrate- diet score2 (0%)0.97 (0.77–1.22)2 (0%)0.70 (0.58–0.84)2 (0%)0.76 (0.61–0.95)2 (0%)0.77 (0.63–0.95)2 (69.2%)0.79 (0.41–1.51) Integrated Korean Dietary Pattern Score4 (55.0%)0.85 (0.72–1.00)*4 (29.6%)0.93 (0.82–1.06)*4 (45.9%)1.03 (0.90–1.18)* Bold and italic text indicates significant associations. CVD, cardiovascular disease; BP, blood pressure; TC, total cholesterol; TG, triglycerides; HDL-C, high-density lipoprotein cholesterol; LDL-C, low-density lipoprotein cholesterol; N, number of individual population; I2, heterogeneity I-square; OR, odds ratio; HR, hazard ratio; CI, confidence interval; NA, not applicable. The presented data have an “insufficient” level of evidence, except for *“limited” evidence and †“possible” evidence.
Regarding macronutrient consumption, individuals with elevated/high TG or low HDL-C were observed to have a higher intake of carbohydrates, but a lower intake of fat and protein, compared to those with normal TG and HDL-C levels. Additionally, fat intake was negatively associated with elevated BP/hypertension, but positively associated with high LDL-C. None of the associations between micronutrients and the outcomes were significant, except for vitamin C and elevated/high TG.
Among dietary indices, negative associations were found between high scores of the Mediterranean diet and elevated/high TG (OR, 0.70; 95% CI, 0.53–0.92), and between a low-carbohydrate-diet and elevated/high TG (OR, 0.76; 95% CI, 0.61–0.95) and low HDL-C (OR, 0.77; 95% CI, 0.63–0.95). Furthermore, the Integrated Korean Dietary Pattern Score showed a borderline association with elevated BP/hypertension (OR, 0.85; 95% CI, 0.72–
1.00), but a non-significant association with elevated/high TC and low HDL-C based on
“limited” evidence.
In the analyses of dietary patterns (Figs. 2-7), adherence to a healthy dietary pattern, which was defined as a rice-based or traditional pattern, showed borderline relationships with a decreased risk of elevated/high TC (OR, 0.87; 95% CI, 0.77–1.00, Fig. 4) and elevated/high TG (OR, 0.90; 95% CI, 0.78–1.04, Fig. 5). A meta-analysis of two studies showed a 17% lower risk of high LDL-C among those who adhered to healthy diets (OR, 0.83; 95% CI, 0.74–0.94, Fig. 7).
In contrast, adherence to an unhealthy dietary pattern, which was defined as a meat-based or Western pattern, was observed to be associated with a 6% lower risk of low HDL-C (OR, 0.94;
95% CI, 0.88–0.99, Fig. 6).
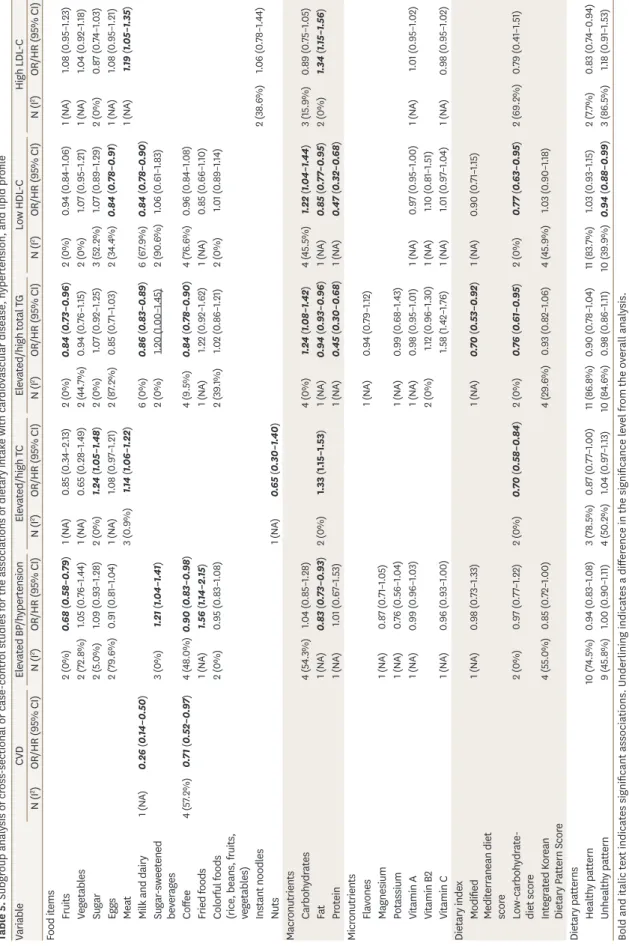
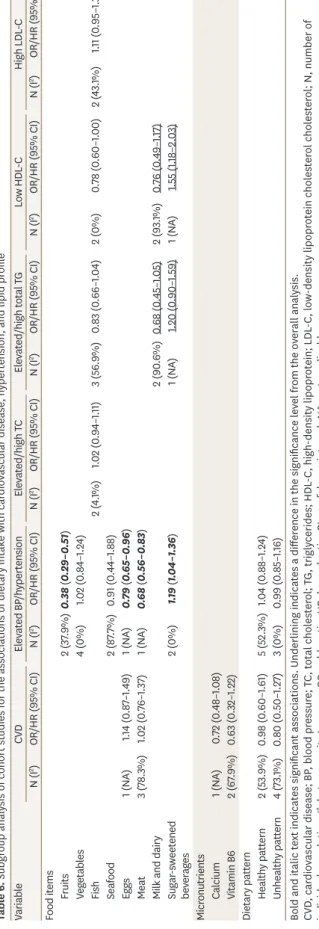
4. Subgroup analysis
The findings of the meta-analysis of all study types were mostly consistent with those of cross-sectional, case-control, or cohort studies (Tables 5 and 6). However, while there was a significant association between sugar-sweetened beverage intake and elevated/high TG in the overall analysis, the association was borderline in the subgroup analysis of cross-sectional and case-control studies (Table 5). Additionally, the significant associations between milk and dairy or sugar-sweetened beverage intake and the risks of elevated/high TG or low HDL-C in the subgroup analysis of cohort studies were different from those in the overall analysis (Table 6).
Furthermore, a subgroup analysis by study population showed a significant association between adherence to an unhealthy dietary pattern and the risk of elevated/high TC in Urban populations (OR, 1.14; 95% CI, 1.03–1.25, Fig. 4). Additionally, adherence to a healthy dietary pattern was found to associated with a 19% lower risk of elevated/high TG (OR, 0.81; 95% CI, 0.67–0.98, Fig. 5). A borderline association between a healthy dietary pattern and low HDL-C was observed in the KNHANES study (Fig. 6).
5. Publication bias
Fig. 8 shows Begg funnel plots and Egger tests for the evaluation of publication bias in meta-
analyses of at least 5 studies. All the results showed no evidence of publication bias (p>0.05).
Stata SE version 14.0 (StataCorp, College Station, TX, USA) was used for all statistical analyses.
AB NOTE: Weights are from random effects analysis
Overall (I-squared=53.9%, p=0.141)
Study Ansan-Ansung Lee 2019, rural (healthy) Lee 2019, industrial (healthy) Subtotal (I-squared=53.9%, p=0.141) 0.98 (0.60–1.61)
OR/HR (95% CI) 0.77 (0.49–1.20) 1.28 (0.77–2.12) 0.98 (0.60–1.61) 100.00
Weight (%) 52.82 47.18 100.00 0.512NOTE: Weights are from random effects analysis
Overall (I-squared=73.1%, p=0.011)
Lee 2019, industrial (Western)l
Study Lee 2019, rural (animal-based) Subtotal (I-squared=73.1%, p=0.011)
Lee 2019, rural (Western) Lee 2019, industrial (animal-based)
Ansan-Ansung 0.80 (0.50–1.27)
1.41 (0.85–2.34)
0.96 (0.62–1.47)
OR/HR (95% CI) 0.80 (0.50–1.27)
0.69 (0.44–1.08) 0.41 (0.23–0.72) 100.00
24.52
26.60
Weight (%) 100.00
26.12 22.76 0.20.512 Fig. 2. Meta-analysis of the associations of (A) healthy and (B) unhealthy dietary patterns with cardiovascular disease. OR, odds ratio; HR, hazard ratio; CI, confidence interval.
NOTE: Weights are from random effects analysis
Overall (I-squared=69.3%, p=0.000)
Choi 2015, w (traditional)
Shin 2014 (traditional) KNCC Seoul hospital-based
Cho 2011, w (healthy)
Kim 2011 (grains, vegetables, and fish) Song 2018, m (prudent) Song 2018, m (traditional) Cho 2011, w (traditional)
Ansan-Ansung Subtotal (I-squared=4.9%, p=0.305)
Subtotal (I-squared=57.8%, p=0.037)
Song 2018, m (whole grains and legumes) Song 2018, w (prudent) Hong 2012 (fruit and dairy)
Kim 2011 (white rice and kimchi)KNHANES Lee 2011, m (rice-vegetable) Choi 2015, w (prudent)
Subtotal (I-squared=75.5%, p=0.017) Song 2018, w (whole grains and legumes) Hong 2012 (Korean traditional)
Subtotal (I-squared=83.7%, p=0.000)
Study 0.97 (0.88–1.08)
1.19 (0.99–1.43)
OR/HR (95% CI) 0.73 (0.59–0.90) 0.75 (0.62–0.91)
0.99 (0.88–1.12) 1.26 (0.97–1.62) 1.10 (0.84–1.44) 0.99 (0.83–1.20) 0.94 (0.59–1.51)
1.09 (0.92–1.30)
1.18 (0.91–1.54) 0.98 (0.75–1.27) 0.72 (0.36–1.43)
1.04 (0.91–1.18) 1.47 (1.05–2.07) 0.72 (0.59–0.87)
0.93 (0.78–1.10) 0.77 (0.59–1.00) 1.17 (0.63–2.18)
0.89 (0.71–1.13) 100.00
8.14
Weight (%) 7.54 7.96
9.49 6.59 6.33 8.13 4.18
37.35
6.45 6.45 1.91
9.30 5.09 7.91
26.33 6.44 2.27
32.15 0.97 (0.88–1.08)
1.19 (0.99–1.43)
0.73 (0.59–0.90) 0.75 (0.62–0.91)
0.99 (0.88–1.12) 1.26 (0.97–1.62) 1.10 (0.84–1.44) 0.99 (0.83–1.20) 0.94 (0.59–1.51)
1.09 (0.92–1.30)
1.18 (0.91–1.54) 0.98 (0.75–1.27) 0.72 (0.36–1.43)
1.04 (0.91–1.18) 1.47 (1.05–2.07) 0.72 (0.59–0.87)
0.93 (0.78–1.10) 0.77 (0.59–1.00) 1.17 (0.63–2.18)
0.89 (0.71–1.13) 100.00
8.14
7.54 7.96
9.49 6.59 6.33 8.13 4.18
37.35
6.45 6.45 1.91
9.30 5.09 7.91
26.33 6.44 2.27
32.15 0.20.512
NOTE: Weights are from random effects analysis
Overall (I-squared=35.2%, p=0.108)
Ansan-Ansung
Kim 2011 (high fat, sweets, and coffee) Subtotal (I-squared=31.0%, p=0.215) Subtotal (I-squared=0.0%, p=0.950)
Subtotal (I-squared=63.8%, p=0.063) Cho 2011, w (Western) Subtotal (I-squared=28.5%, p=0.237)
Choi 2015, w (Western)
Song 2018, w (coffee, fat, and sweets) Hong 2012 (alcohol and meat)
Kim 2011 (meat and alcohol) Shin 2014 (meat and fast-food) Seoul hospital-based
KNCC
Study Lee 2011, m (noodle-bread) Song 2018, w (Western)
Lee 2011, m (animal-food)
KNHANES Hong 2012 (sweets and fast foods)
Song 2018, m (coffee, fat, and sweets) 1.00 (0.92–1.09)
1.03 (0.91–1.16) 0.91 (0.78–1.07) 0.97 (0.60–1.56)
1.05 (0.91–1.22) 0.96 (0.78–1.18) 1.05 (0.89–1.24)
1.14 (0.94–1.39)
0.87 (0.67–1.13) 0.95 (0.47–1.90)
1.19 (1.05–1.35) 0.88 (0.69–1.13) 0.82 (0.60–1.12) 1.15 (0.86–1.54)
OR/HR (95% CI) 0.69 (0.48–1.00) 0.98 (0.50–1.90)
1.01 (0.78–1.32) 100.00
17.50 32.37 2.99
42.92 10.50 21.72
11.23
7.70 1.43
17.07 8.36 5.91 6.57
Weight (%) 4.55 1.56
7.63 1.00 (0.92–1.09)
1.03 (0.91–1.16) 0.91 (0.78–1.07) 0.97 (0.60–1.56)
1.05 (0.91–1.22) 0.96 (0.78–1.18) 1.05 (0.89–1.24)
1.14 (0.94–1.39)
0.87 (0.67–1.13) 0.95 (0.47–1.90)
1.19 (1.05–1.35) 0.88 (0.69–1.13) 0.82 (0.60–1.12) 1.15 (0.86–1.54)
0.69 (0.48–1.00) 0.98 (0.50–1.90)
1.01 (0.78–1.32) 100.00
17.50 32.37 2.99
42.92 10.50 21.72
11.23
7.70 1.43
17.07 8.36 5.91 6.57
4.55 1.56
7.63 0.512
AB Fig. 3. Meta-analysis of the associations of (A) healthy and (B) unhealthy dietary patterns with elevated or high blood pressure. OR, odds ratio; HR, hazard ratio; CI, confidence interval; KNHANES, Korea National Health and Nutrition Examination Survey; KNCC, Korea National Cancer Screenee Cohort.
AB NOTE: Weights are from random effects analysis
Overall (I-squared=78.5%, p=0.010)
Kim 2019 (rice and kimchi) Subtotal (I-squared=89.2%, p=0.002)
KNHANES Kim 2019 (grain, bean, nuts, vegetables, and fruits) Subtotal (I-squared=0.0%, p=0.000)
Urban
Study Na 2019, m (rice based Korean food) 0.87 (0.77–1.00)
0.79 (0.72–0.87) 0.88 (0.72–1.07)
OR/HR (95% CI) 0.97 (0.89–1.07) 0.87 (0.76–0.99)
0.87 (0.76–0.99) 100.00
34.95 70.25
Weight (%) 35.30 29.75
29.75 0.51NOTE: Weights are from random effects analysis
Overall (I-squared=50.2%, p=0.110)
Na 2019, m (convenience food)
KNHANES UrbanKim 2019 (oil sweets, fish, and other vegetables) Subtotal (I-squared=0.0%, p=0.878) Na 2019, m (flour based Western food) Subtotal (I-squared=0.0%, p=0.926)
Kim 2019 (red meat and alcohol)
Study 1.04 (0.97–1.13)
1.13 (0.99–1.29)
0.99 (0.90–1.08) 0.99 (0.92–1.05) 1.14 (1.00–1.30) 1.14 (1.03–1.25)
0.98 (0.89–1.07) 100.00
20.37
29.65 59.05 20.58 40.95
Weight (%) 29.40
OR/HR (95% CI) 0.512 Fig. 4. Meta-analysis of the associations of (A) healthy and (B) unhealthy dietary patterns with elevated or high total cholesterol. OR, odds ratio; HR, hazard ratio; CI, confidence interval; KNHANES, Korea National Health and Nutrition Examination Survey.