Impact of ENPP1 K121Q on Change of Insulin Resistance after Web-Based Intervention in Korean Men with Diabetes and Impaired Fasting Glucose
Ectoenzyme nucleotide pyrophosphate phosphodiesterase 1 (ENPP1) gene has been studied in relation to type 2 diabetes mellitus (T2DM) and insulin resistance (IR). We hypothesized that the difference in genotype may be one of the factors that affect the outcome of intervention. We genotyped 448 men with fasting glucose ≥ 5.6 mM/L, including 371 in subjects with K allele (KK) (69 control group [CG]; and 302 intervention group [IG]) and 77 in subjects with Q allele (KQ+QQ) (13 CG and 64 IG). The web-based intervention based on a lifestyle modification was delivered by e-mail once a month for 10 months. In the KK, IG demonstrated significantly decreased levels of fasting serum insulin (FSI) as compared to CG and homeostasis model of assessment of insulin resistance (HOMA-IR). In the KQ+QQ IG group, hemoglobin A1c (HbA1c), FSI and HOMA-IR were significantly decreased, and showed further reduction in the HOMA-IR than KQ+QQ CG. After analysis of covariance, K121Q did significantly influence the change of HbA1c in CG after appropriate adjustment.
In a multivariate model, BMI change predicted HOMA-IR change (adjusted β = 0.801; P = 0.022) in KK IG subjects with T2DM. ENPP1 K121Q did not influence the change in IR.
However, individuals with T2DM carrying the K121 variant are very responsive to the effect of BMI reduction on HOMA-IR.
Keywords: Ectoenzyme Nucleotide Pyrophosphate Phosphodiesterase 1; Diabetes Mellitus;
Web-Based Lifestyle Intervention; Insulin Resistance Ji Yeon Kang,1 Sook Hee Sung,1
Yeon Ju Lee,1 Tae In Choi,2 and Seung Jin Choi1
1Radiation Health Research Institute, Korea Hydro &
Nuclear Power Co., Ltd., Seoul; 2Central Research Institute, Korea Hydro & Nuclear Power Co., Ltd., Daejeon, Korea
Received: 20 February 2014 Accepted: 5 July 2014 Address for Correspondence:
Seung Jin Choi, MD
Radiation Health Research Institute, Korea Hydro & Nuclear Power Co., Ltd., 308 Uicheon-ro, Dobong-gu, Seoul 132-703, Korea
Tel: +82.2-3499-6650, Fax: +82.2-3499-6359 E-mail: [email protected]
Funding: The study was supported by a grant from the Korea Hydro & Nuclear Power project (E08NJ22 & E11NS08).
http://dx.doi.org/10.3346/jkms.2014.29.10.1353 • J Korean Med Sci 2014; 29: 1353-1359
INTRODUCTION
Type 2 diabetes (T2DM) is a complex disorder due to the com- bination of genetic and environmental factors (diet, physical activity, etc.). Impaired pancreatic β-cell function and insulin resistance (IR) in muscle, fat and liver are pathogenic for T2DM (1). Recent genetic and genome-wide association studies have identified the DNA sequence differences (polymorphisms/mu- tations) in genes that encode proteins contributing to either in- sulin biosynthesis/secretion or insulin action. Among the genes related to T2DM, ectoenzyme nucleotide pyrophosphate phos- phodiesterase 1 (ENPP1), also known as plasma cell membrane glycoprotein 1 (PC-1), reduces insulin signaling by inhibiting the insulin receptor tyrosine kinase activity (2). Costanzo et al.
(3) showed that the human Q121 allele has more potent inhibi- tory effects on IR autophosphorylation than the K121 allele in vitro. Abate et al. (4) and Wang et al. (5) reported the association of the Q121 allele with diabetes in South-Asian and Han Chi- nese. However, no association was reported in the other Asians including Korean (6), Japanese (7) and Chinese (8). There are a few epidemiologic data associating ENPP1 K121Q polymorphism with the risk of T2DM among Koreans.
The discipline of nutrigenomics focuses on the effects of in- gested nutrients and other food components on gene expres- sion and gene regulation (9). The epidemic rise in the incidence of T2DM has fuelled research on the complex interplay between genes and environmental factors in the pathogenesis of the hy- perglycemic diabetic state (10). Nutrigenomics has emerged as a multidisciplinary field that focuses on studying the interac- tions.
Lifestyle intervention can prevent or delay T2DM (11). Stefan et al. (12) investigated the influence of different polymorphisms on the effects of lifestyle intervention. In another study, the Q allele in the ENPP1 gene was significantly associated with an impaired increase in OGTT-derived insulin sensitivity after life- style intervention (13). Also, Moore et al. (14) reported that the K121Q polymorphism modulated the efficacy of lifestyle inter- vention on the incidence of T2DM. Therefore, Weyrich et al. (15) suggested that general methodological approaches to study gene-lifestyle interactions are needed. However, recent studies addressing the role of ENPP1 K121Q on lifestyle intervention have not demonstrated gene-by-dietary change-by-weight loss interaction.
In this study, we aimed to demonstrate a potential interac- Human Genetics & Genomics
tion between K121Q and web-based lifestyle intervention, and to verify whether the improvement of glucose metabolism ob- served after weight loss was associated with ENPP1 K121Q poly- morphism.
MATERIALS AND METHODS Subjects and study design
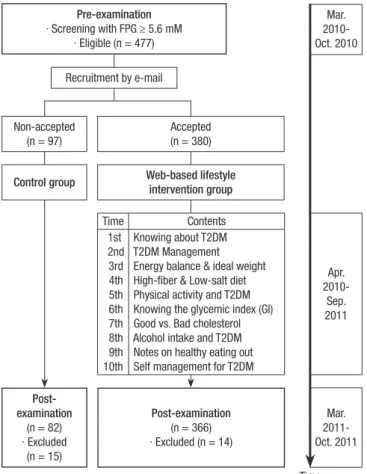
Flow chart of Participants during the study is shown in Fig. 1.
The subjects were recruited from industrial male workers by screening members of the T2DM risk group who participated in annual regular health check-ups in 2010. Exclusion criteria were previously diagnosed T2DM, dyslipidemia, hypertension, cardiovascular disease, and any therapy known to affect glu- cose and lipid metabolism at basal screening. A total of 477 eli- gible individuals with newly diabetes (diagnosis of T2DM [fast- ing plasma glucose (FPG) ≥ 7.0 mM/L] or impaired fasting glu- cose [IFG] [FPG 5.6-6.9 mM/L]) were called to participate in the web-based lifestyle intervention via e-mail, and 380 individuals accepted the intervention protocol (intervention group [IG]).
The control group (CG, n = 97) agreed to participate in post-ex- amination, but received no e-mail on healthy lifestyle to improve T2DM. 448 (CG: 82, IG: 366) of 477 individuals who participat-
ed in a health follow-up in 2011, were included in the final anal- yses.
The web-based lifestyle intervention was developed based on a previous study (16) and guidelines (17, 18). It is detailed in Fig. 1. Participants were encouraged to change unhealthy life- style behaviors and eating habits. Each e-mail included infor- mation regarding healthy eating habits and lifestyle. After send- ing each e-mail, the research staff checked within 3 days wheth- er the e-mail had been read. If not read, e-mail material was sent again and short messaging services (SMS) messages were sent to motivate participation.
Measurements
Body height and weight were measured with each subject stand- ing straight wearing light clothing using InBody 720 (Biospace, Seoul, Korea). Body mass index (BMI) was calculated using the body weight (kg)/height (m2). Waist circumference (WC) was measured at the midpoint between the iliac crest and the lower ribs. Blood pressures was measured in duplicate using an elec- tronic sphygmomanometer (FT-700R; Jawon Medical, Seoul, Korea) in a sitting position after a ≥ 10 min stabilization prior to blood sampling and results were averaged.
Prior to blood sampling, all subjects fasted overnight (more than 10 hr). Blood analysis was performed in a central labora- tory (Radiation Health Research Institute). FPG was analyzed by enzymatic methods using commercially available kits and an automatic analyzer (Cobas Integra 800; Roche Diagnostics, Mannheim, Germany). Fasting serum insulin (FSI) was ana- lyzed by radioimmunoassay methods using Irma kit (RALS sys- tem, DS8150; ITC Edison, NJ, USA). Hemoglobin A1c (HbA1c) was determined on whole blood samples by VARIANTTM II TU- RBO HbA1c kit 2.0 and VARIANTTM II TURBO Reagents analyz- er (BIO-RAD, CA, USA). The formula for calculating the homeo- stasis model of insulin resistance (HOMA-IR) was (FSI [μU/mL]
× FPG [mM/L]) ÷ 22.5 (19). Dietary intakes were analyzed using a computerized food frequency questionnaire (FFQ) originally developed by the Korea Centers for Disease Control and Pre- vention and modified by our institution for industrial workers.
The FFQ consisted of 7 food groups including 108 food items. It was designed to collect information regarding the usual food intake over the past one year.
ENPP1 genotyping
We separated the buffy coat from the blood sample of each sub- ject. Genomic DNA was extracted from the above samples us- ing the GENErALLTM Blood SV kit (General Biosystem, Seoul, Korea). Genotyping used to identify the K121Q polymorphism in ENPP1 exon 4 was by polymerase chain reaction-restriction fragment length polymorphism (PCR-RFLP). PCR was carried out in a final volume of 10 μL containing 50 mM KCl, 10 mM Tris (pH 8.3), 1.5 mM MgCl2, 75 ng of each primer, 100 μM de- Pre-examination
∙ Screening with FPG ≥ 5.6 mM
∙ Eligible (n = 477)
Mar.
2010- Oct. 2010
Mar.
2011- Oct. 2011 Time
Apr.
2010- Sep.
2011 Recruitment by e-mail
Post- examination
(n = 82)
∙ Excluded (n = 15)
Post-examination (n = 366)
∙ Excluded (n = 14) Control group Web-based lifestyle
intervention group
Time Contents
1st 2nd 3rd 4th 5th 6th 7th 8th 9th 10th
Knowing about T2DM T2DM Management Energy balance & ideal weight High-fiber & Low-salt diet Physical activity and T2DM Knowing the glycemic index (GI) Good vs. Bad cholesterol Alcohol intake and T2DM Notes on healthy eating out Self management for T2DM Non-accepted
(n = 97)
Accepted (n = 380)
Fig. 1. Flowchart of study participants. FPG, Fasting plasma glucose; T2DM, Type 2 diabetes mellitus.
oxy-NTP, and 1 U Taq polymerase. All genotyping was carried out in duplicate for each individual, and the investigator was unaware of the sample origin. In this study sample genotype distribution obeyed the Hardy-Weinberg equilibrium.
Statistical analyses
Power calculations were performed using the G*Power program version 3.0.10 (Franz Faul, Universität Kiel, Germany). A total of 400 subjects were calculated as a sample size for α = 0.05 and 95% power among two groups in a two-sided ANCOVA model.
Deviations from Hardy-Weinberg equilibrium at ENPP1 co- don 121 were tested by a chi-square goodness of fit test. All the statistical analyses were performed using SPSS version 18.0 (SPSS Inc., Chicago, IL, USA). Data were presented as the mean ± stan- dard deviation. Variables with a non-normal distribution were submitted to logarithmic transformation. To compare the dif- ferences between CG and IG by ENPP1 polymorphism and dif- ferences of changes between KK and KQ+QQ by type of group, independent t-test for continuous variables was applied. In ad- dition, pre-post comparisons were carried out using the paired t-test. ANCOVA was used to compare the clinical and laborato- ry characteristics of subjects according to genotypes and type of group. Adjustment of changes during intervention comprised the respective pre-values to correct for potential ceiling effects.
Multivariate analyses were performed using linear models for gene-by-BMI change interaction in modulating insulin resis- tance. All two-tailed P values of 0.05 were regard as indicating statistical significance.
Ethics statement
This study was approved by the institutional review board of the Asan Medical Center (IRB No. 2007-0119). Informed written con- sent was obtained from all study subjects.
RESULTS
Effects of web-based lifestyle intervention on KK genotype In KK genotype, analytical results in two groups at baseline and 12 months after intervention are shown in Table 1. There were no significant differences between CG and IG except for age, FPG and HbA1c at baseline (Table 1). No differences in anthro- pometrics, metabolic measurements and nutrient intake at base- line and after intervention were evident for KK CG. However, in the KK IG group, BMI (P = 0.022), HbA1c (P < 0.001), FSI (P <
0.001), HOMA-IR (P < 0.001) and intakes of total energy (P = 0.019) and protein (P = 0.007) were significantly decreased after intervention. Comparison of change of FSI levels between the two groups showed a greater improvement in the KK IG after appropriate adjustment (P = 0.033).
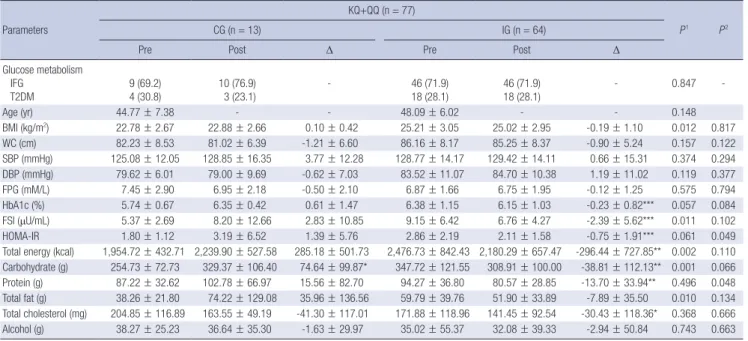
Effects of web-based lifestyle intervention on KQ+QQ genotype
The baseline characteristics and nutrient intakes of the two groups in the KQ+QQ genotype are shown in Table 2. BMI, FSI and in- takes of total energy, carbohydrate and total fat were greater in KQ+QQ IG than in KQ+QQ CG at baseline. Intake of carbohy- drate was significantly increased in KQ+QQ CG after interven- Table 1. Analysis of the effects of web-based intervention program in the KK genotype
Parameters
KK (n = 371)
P1 P2
CG (n = 69) IG (n = 302)
Pre Post Δ Pre Post Δ
Glucose metabolism IFG
T2DM 55 (79.7)
14 (20.3) 56 (81.2)
13 (18.8) - 205 (67.9)
97 (32.1) 206 (68.2)
96 (31.8) - 0.059 -
Age (yr) 50.35 ± 6.47 - - 48.49 ± 5.86 - - 0.031 -
BMI (kg/m2) 24.75 ± 2.53 24.63 ± 2.60 -0.13 ± 0.70 24.80 ± 2.75 24.68 ± 2.73 -0.12 ± 0.89* 0.927 0.872
WC (cm) 84.65 ± 6.24 84.32 ± 6.70 -0.32 ± 4.25 85.32 ± 6.73 84.99 ± 6.88 -0.33 ± 4.07 0.456 0.809
SBP (mmHg) 128.86 ± 13.87 130.67 ± 14.64 1.81 ± 14.70 127.09 ± 16.00 126.76 ± 13.55 -0.23 ± 14.12 0.272 0.087
DBP (mmHg) 84.20 ± 9.32 84.72 ± 10.33 0.52 ± 10.09 83.94 ± 10.95 83.25 ± 9.58 -0.65 ± 10.72 0.728 0.385
FPG (mM/L) 6.49 ± 1.16 6.46 ± 2.03 -0.03 ± 2.04 7.01 ± 2.24 6.97 ± 2.17 -0.04 ± 2.03 0.011 0.243
HbA1c (%) 5.93 ± 0.96 6.01 ± 0.81 0.08 ± 0.62 6.51 ± 1.43 6.18 ± 1.17 -0.33 ± 1.08*** < 0.001 0.225
FSI (μU/mL) 8.53 ± 6.07 8.17 ± 5.03 -0.36 ± 5.85 8.37 ± 6.33 6.74 ± 5.79 -1.63 ± 6.01*** 0.615 0.033
HOMA-IR 2.51 ± 2.01 2.39 ± 1.68 -0.12 ± 1.58 2.63 ± 2.22 2.14 ± 2.30 -0.48 ± 2.37*** 0.862 0.269
Total energy (kcal) 2,332.19 ± 904.26 2,391.99 ± 1,019.02 59.80 ± 864.61 2,406.06 ± 802.65 2,293.57 ± 761.00 -112.48 ± 828.60* 0.534 0.173 Carbohydrate (g) 328.62 ± 118.03 349.72 ± 151.16 21.10 ± 146.86 347.77 ± 114.37 336.25 ± 105.87 -11.52 ± 122.06 0.224 0.144 Protein (g) 96.48 ± 47.95 93.76 ± 48.31 -2.72 ± 47.63 94.31 ± 41.03 88.24 ± 35.81 -6.07 ± 39.12** 0.729 0.376 Total fat (g) 48.92 ± 41.49 56.10 ± 41.47 7.18 ± 44.30 58.41 ± 37.82 56.41 ± 36.18 -2.00 ± 44.56 0.085 0.658 Total cholesterol (mg) 189.03 ± 152.41 171.26 ± 157.67 -17.77 ± 164.33 170.46 ± 136.27 157.53 ± 116.84 -12.93 ± 142.32 0.354 0.784 Alcohol (g) 36.02 ± 51.97 30.62 ± 43.14 -5.40 ± 48.27 27.86 ± 34.73 24.59 ± 26.87 -3.27 ± 30.24 0.218 0.354 Data are expressed as no. (%) or mean ± SD. Significantly different within group between pre and post by paired t-test at *P < 0.05, **P < 0.01, and ***P < 0.001. P1 values measured by independent t-test between CG and IG at pre values. P2 values measured by ANCOVA with adjusted by pre values, age, and changes in BMI, total energy intake and caloric nutrients. Δ, Post-Pre. CG, control group; IG, intervention group; IFG, impaired fasting glucose; T2DM, type 2 diabetes mellitus; BMI, body mass index; WC, waist circumference; SBP, systolic blood pressure; DBP, diastolic blood pressure; FPG, fasting plasma glucose; FSI, fasting serum insulin, HOMA-IR: homeostasis model of insulin resistance.
tion (P = 0.020). In KQ+QQ IG, HbA1c (P < 0.001), FSI (P < 0.001), HOMA-IR (P < 0.001) and intakes of total energy (P = 0.002), carbohydrate (P = 0.007), protein (P = 0.002) and total choles- terol (P = 0.044) were significantly decreased after intervention.
The web-based lifestyle intervention resulted in significant de- crease in HOMA-IR in KQ+QQ IG as compared to KQ+QQ CG after appropriate adjustment (P = 0.049).
Magnitude of effect on genotype and web-based lifestyle intervention
When adjusting for confounders, HbA1c was significantly in- creased in KQ+QQ CG compared to the KK CG (P = 0.038) (Ta- ble 3). The reductions in FSI and HOMA-IR were significantly
greater in KQ+QQ IG subjects compared to the CG. Similarly, the reductions in KK IG subjects were significantly greater com- pared to the CG subjects (respectively, FSI: P = 0.026, HOMA- IR: P = 0.039), and HbA1c reduction were marginally signifi- cant (P = 0.050).
Relationship between HOMA-IR and BMI changes in IG subjects with T2DM
The relationship between HOMA-IR and BMI was analyzed in IG subjects with T2DM (Fig. 2). When assessed across the two ge- notypes, the positive correlation was highly significant among 97 KK subjects (adjusted β = 0.801; P = 0.022) and was not significant among the 18 KQ+QQ subjects (adjusted β = -0.521; P = 0.428).
Table 2. Analysis of the effects of web-based intervention program in KQ+QQ genotype Parameters
KQ+QQ (n = 77)
P1 P2
CG (n = 13) IG (n = 64)
Pre Post Δ Pre Post Δ
Glucose metabolism IFG
T2DM
9 (69.2) 4 (30.8)
10 (76.9) 3 (23.1)
- 46 (71.9)
18 (28.1)
46 (71.9) 18 (28.1)
- 0.847 -
Age (yr) 44.77 ± 7.38 - - 48.09 ± 6.02 - - 0.148
BMI (kg/m2) 22.78 ± 2.67 22.88 ± 2.66 0.10 ± 0.42 25.21 ± 3.05 25.02 ± 2.95 -0.19 ± 1.10 0.012 0.817
WC (cm) 82.23 ± 8.53 81.02 ± 6.39 -1.21 ± 6.60 86.16 ± 8.17 85.25 ± 8.37 -0.90 ± 5.24 0.157 0.122
SBP (mmHg) 125.08 ± 12.05 128.85 ± 16.35 3.77 ± 12.28 128.77 ± 14.17 129.42 ± 14.11 0.66 ± 15.31 0.374 0.294
DBP (mmHg) 79.62 ± 6.01 79.00 ± 9.69 -0.62 ± 7.03 83.52 ± 11.07 84.70 ± 10.38 1.19 ± 11.02 0.119 0.377
FPG (mM/L) 7.45 ± 2.90 6.95 ± 2.18 -0.50 ± 2.10 6.87 ± 1.66 6.75 ± 1.95 -0.12 ± 1.25 0.575 0.794
HbA1c (%) 5.74 ± 0.67 6.35 ± 0.42 0.61 ± 1.47 6.38 ± 1.15 6.15 ± 1.03 -0.23 ± 0.82*** 0.057 0.084
FSI (μU/mL) 5.37 ± 2.69 8.20 ± 12.66 2.83 ± 10.85 9.15 ± 6.42 6.76 ± 4.27 -2.39 ± 5.62*** 0.011 0.102
HOMA-IR 1.80 ± 1.12 3.19 ± 6.52 1.39 ± 5.76 2.86 ± 2.19 2.11 ± 1.58 -0.75 ± 1.91*** 0.061 0.049
Total energy (kcal) 1,954.72 ± 432.71 2,239.90 ± 527.58 285.18 ± 501.73 2,476.73 ± 842.43 2,180.29 ± 657.47 -296.44 ± 727.85** 0.002 0.110 Carbohydrate (g) 254.73 ± 72.73 329.37 ± 106.40 74.64 ± 99.87* 347.72 ± 121.55 308.91 ± 100.00 -38.81 ± 112.13** 0.001 0.066 Protein (g) 87.22 ± 32.62 102.78 ± 66.97 15.56 ± 82.70 94.27 ± 36.80 80.57 ± 28.85 -13.70 ± 33.94** 0.496 0.048 Total fat (g) 38.26 ± 21.80 74.22 ± 129.08 35.96 ± 136.56 59.79 ± 39.76 51.90 ± 33.89 -7.89 ± 35.50 0.010 0.134 Total cholesterol (mg) 204.85 ± 116.89 163.55 ± 49.19 -41.30 ± 117.01 171.88 ± 118.96 141.45 ± 92.54 -30.43 ± 118.36* 0.368 0.666 Alcohol (g) 38.27 ± 25.23 36.64 ± 35.30 -1.63 ± 29.97 35.02 ± 55.37 32.08 ± 39.33 -2.94 ± 50.84 0.743 0.663 Data are expressed as mean ± SD. Significantly different within group between pre and post by paired t-test at *P < 0.05, **P < 0.01, and ***P < 0.001. P1 values measured by independent t-test between CG and IG at pre values. P2 values measured by ANCOVA with adjusted by pre values, age, and changes in BMI, total energy intake and caloric nutrients. Δ, Post-Pre; CG, control group; IG, intervention group; IFG, impaired fasting glucose; T2DM, type 2 diabetes mellitus; BMI, body mass index; WC, waist circumference;
SBP, systolic blood pressure; DBP, diastolic blood pressure; FPG, fasting plasma glucose; FSI, fasting serum insulin, HOMA-IR: homeostasis model of insulin resistance.
Table 3. Comparisons of changes between pre and post web-based intervention program Parameters
Total subjects (n = 448)
P2
CG (n = 82) IG (n = 366)
KK (n = 69) KQ+QQ (n = 13) P1 KK (n = 302) KQ+QQ (n = 64) P1
Δ BMI -0.13 ± 0.70 0.10 ± 0.42 0.334 -0.12 ± 0.89 -0.19 ± 1.10 0.852 0.981
Δ WC -0.32 ± 4.25 -1.21 ± 6.60 0.589 -0.33 ± 4.07 -0.90 ± 5.24 0.384 0.770
Δ SBP 1.81 ± 14.70 3.77 ± 12.28 0.970 -0.23 ± 14.12 0.66 ± 15.31 0.593 0.680
Δ DBP 0.52 ± 10.09 -0.62 ± 7.03 0.340 -0.65 ± 10.72 1.19 ± 11.02 0.185 0.538
Δ FPG -0.03 ± 2.04 -0.50 ± 2.10 0.494 -0.04 ± 2.03 -0.12 ± 1.25 0.731 0.931
Δ HbA1c 0.08 ± 0.62a,b 0.61 ± 1.47a,c 0.038 -0.33 ± 1.08b -0.23 ± 0.82b 0.674 0.050
Δ FSI -0.36 ± 5.85a,b 2.83 ± 10.85b 0.116 -1.63 ± 6.01a,c -2.39 ± 5.62a,c 0.437 0.026
Δ HOMA-IR -0.12 ± 1.58a,b 1.39 ± 5.76b 0.161 -0.48 ± 2.3a,c -0.75 ± 1.91a,c 0.470 0.039
Data are expressed as mean ± SD. P1 values measured by ANCOVA with adjusted by pre values, age, and changes in total energy intake and caloric nutrients be tween KK and KQ+QQ genotypes. P2 values measured by ANCOVA with adjusted by pre values, age, and changes in total energy intake and caloric nutrients among four groups. a,b,cMeans with different superscript letter are significantly different among four groups. Δ, Post-Pre; CG, control group; IG, intervention group; BMI, body mass index; WC, waist circum- ference; SBP, systolic blood pressure; DBP, diastolic blood pressure; FPG, fasting plasma glucose; FSI, fasting serum insulin, HOMA-IR: homeostasis model of insulin resistance.
DISCUSSION
In the present study, we demonstrated that web-based lifestyle intervention is effective in improving IR without reference to ENPP1 K121Q polymorphism. Additionally, the K allele has a beneficial effect of weight loss on IR decrease in subjects with T2DM.
IR is one of the main mechanisms implicated in the patho- genesis of both T2DM and metabolic syndrome (20). The HOMA- IR is widely used to estimate IR in large epidemiological studies and in clinical practice (21). Also, the HOMA-IR index correlates fairly well with invasive test of insulin sensitivity and has an ac- ceptable degree of reproducibility (22). Therefore, it has been suggested that HOMA-IR must be assessed as an index of im- provement in insulin sensitivity after lifestyle changes (23).
Several studies have reported dichotomous findings concern- ing the ability of the ENPP1 K121Q polymorphism during life- style intervention (13, 14, 24). Recent studies reported that indi- viduals with Q allele benefited more with intervention efficacy (14, 24). However, while the levels of HbA1c and HOMA-IR were significantly reduced in IG, there was no significant difference according to polymorphism in this study. As several previous studies had suggested, different ethnicity may affect environ- mental and functional genetic factors on other genes (13, 25).
Moreover, the Q (risk) allele frequency varies greatly according with the ethnic group (26). Therefore, we suggest that it is im- portant to clarify gene effect in a homogenous racial population.
Energy over-consumption was key to the development of IR and T2DM (27). Macronutrients (calorie nutrients) including carbohydrate, protein and fat have varying effects on blood glu- cose level (28). Intakes of total energy and fat are closely related
with glycemic control (29, 30). Also, effects of dietary change on blood biomarker concentrations differ significantly between individuals. Genetic polymorphisms lead to alteration of the response to dietary components by influencing absorption and metabolism (31). For example, genetic background can interact with habitual dietary fat composition, affecting predisposition to IR syndrome and individual responsiveness to change in di- etary fat intake (32). Recently, nutrigenomics raises ethical, le- gal and social issues particularly with respect to how the public may access nutrigenetic tests and associated nutritional and lifestyle advice (9).
Obesity increases the concentration of insulin in plasma and is the major contributor to IR (33). Increased visceral fat mass may lead to IR in Chinese type 2 diabetic and normorglycemic subjects (34). Moreover, it was recently demonstrated that indi- viduals with elevated body fat percentage have an increased risk of developing cardiometabolic disease despite having a nor- mal BMI (35). In Korean non-obese men, high BMI and waist circumference (abdominal obesity) have been associated with IR (36). Gillies et al. (37) demonstrated that lifestyle modifica- tion with weight loss can reduce the incidence of T2DM by up to 58% in populations at risk for T2DM. However, Vogeser et al.
(23) showed no correlation between individual change in BMI and change in HOMA-IR during 1 yr of the MOBILIS lifestyle intervention program in obese persons (BMI ≥ 30.0 kg/m2). Mar- anghi et al. (24) showed that after 6 weeks lifestyle intervention, significant relationship between BMI and HOMA-IR changes according to ENPP1 genotype (β values were 0.34 in 145 KK in- dividuals and 0.85 in 47 KQ+QQ individuals) in Italian men and women. In this study, this correlation was strongly significant among the 97 KK IG with T2DM (adjusted β = 0.801). The rea- Fig. 2. Association of the change in HOMA-IR and BMI in intervention group with T2DM according to the (A) K allele subjects, (B) Q allele subjects. Δ, Post-Pre; BMI, body mass index; WC, waist circumference; HOMA-IR, homeostasis model of insulin resistance.
KK IG (n = 97)
β = 0.801, P = 0.022
∆ HOMA-IR
∆ BMI
-40.0 -2.0 0.0 2.0 4.0
20.0
10.0
0.0
-10.0
-20.0
KQ+QQ IG (n = 18)
β = -0.521, P = 0.428
∆ HOMA-IR
∆ BMI
-2.0 -1.0 0.0 1.0 2.0
2.5 0.0 -2.5 -5.0 -7.5 -10.0
A B
sons for this discrepancy may be due to the following differenc- es: 1) intervention type and period (6 weeks, man to man inter- vention, vs. 10 months, web-based intervention); 2) ethnicity; 3) characteristic of subjects (non-diabetic overweight-obese adults, vs. men with IFG and T2DM); 4) confounding factors (not in- clude dietary change, vs. include dietary change). Intervention type and contact frequency reportedly influence the response to a lifestyle intervention (38, 39). Although data are not shown, BMI were more decreased in the intervention group subjects with T2DM (-0.28 kg/m2) when compared to intervention group subjects with IFG (-0.06 kg/m2) (P = 0.039). It is expected that subjects with T2DM would benefit more from HOMA-IR reduc- tion than subjects with IFG.
There were some limitations that need to be addressed. The first is the lack of Q allele subjects. A low proportion of QQ ho- mozygous type is observed in most studies (approximately 2%- 3% of the general population) (40). The frequency of the QQ type was very low (1.1%) in our data, so, it prevented appropri- ately testing of different genetic models (dominant, additive or recessive). Secondly, we did not measure the energy expendi- ture according to physical activity and exercise, and so were un- able to distinguish the additive effects of change in energy ex- penditure on glycemic control and IR. Nevertheless, this study had the strength in that we tested the ability of ENPP1 to predict intervention efficacy on IR after adjustment for confounding factors such as weight loss and dietary intake. Also, our results provided an interesting concept that is amenable to further study, in terms of a clear effect of genotype.
In conclusion, the ENPP1 K121Q polymorphism is associat- ed with IR during web-based lifestyle intervention, and the K121 allele has a beneficial effect of weight loss on IR. More compre- hensive analyses in larger studies are needed to understand the full impact of ENPP1 in Koreans on lifestyle intervention to pre- vent and delay T2DM.
DISCLOSURE
The authors have no conflict of interest to disclose.
ORCID
Ji Yeon Kang http://orcid.org/0000-0002-1841-5357 Sook Hee Sung http://orcid.org/0000-0001-8308-2301 Yeon Ju Lee http://orcid.org/0000-0002-9725-6269 Tae In Choi http://orcid.org/0000-0002-7389-9921 Seung Jin Choi http://orcid.org/0000-0002-4488-187X
REFERENCES
1. Polonsky KS, Sturis J, Bell GI. Seminars in Medicine of the Beth Israel Hospital, Boston. Non-insulin-dependent diabetes mellitus: a genetically
programmed failure of the beta cell to compensate for insulin resistance.
N Engl J Med 1996; 334: 777-83.
2. Schäfer SA, Machicao F, Fritsche A, Häring HU, Kantartzis K. New type 2 diabetes risk genes provide new insights in insulin secretion mechanisms.
Diabetes Res Clin Pract 2011; 93: S9-24.
3. Costanzo BV, Trischitta V, Di Paola R, Spampinato D, Pizzuti A, Vigneri R, Frittitta L. The Q allele variant (GLN121) of membrane glycoprotein PC-1 interacts with the insulin receptor and inhibits insulin signaling more effectively than the common K allele variant (LYS121). Diabetes 2001; 50: 831-6.
4. Abate N, Chandalia M, Satija P, Adams-Huet B, Grundy SM, Sandeep S, Radha V, Deepa R, Mohan V. ENPP1/PC-1 K121Q polymorphism and genetic susceptibility to type 2 diabetes. Diabetes 2005; 54: 1207-13.
5. Wang M, Peng C, Qu YL, Huang QY. Association and meta-analysis of ENPP1 K121Q with type 2 diabetes in Han Chinese. Yi Chuan 2010; 32:
808-16.
6. Seo HJ, Kim SG, Kwon OJ. The K121Q polymorphism in ENPP1 (PC-1) is not associated with type 2 diabetes or obesity in Korean male workers.
J Korean Med Sci 2008; 23: 459-64.
7. Keshavarz P, Inoue H, Sakamoto Y, Kunika K, Tanahashi T, Nakamura N, Yoshikawa T, Yasui N, Shiota H, Itakura M. No evidence for association of the ENPP1 (PC-1) K121Q variant with risk of type 2 diabetes in a Jap- anese population. J Hum Genet 2006; 51: 559-66.
8. Zhao T, Liu Z, Zhang D, Liu Y, Yang Y, Zhou D, Chen Z, Yu L, Zhang Z, Feng G, et al. The ENPP1 K121Q polymorphism is not associated with type 2 diabetes or obesity in the Chinese Han population. J Hum Genet 2011; 56: 12-6.
9. German JB. Genetic dietetics: nutrigenomics and the future of dietetics practice. J Am Diet Assoc 2005; 105: 530-1.
10. McClenaghan NH. Determining the relationship between dietary carbo- hydrate intake and insulin resistance. Nutr Res Rev 2005; 18: 222-40.
11. Kosaka K, Noda M, Kuzuya T. Prevention of type 2 diabetes by lifestyle intervention: a Japanese trial in IGT males. Diabetes Res Clin Pract 2005;
67: 152-62.
12. Stefan N, Thamer C, Staiger H, Machicao F, Machann J, Schick F, Venter C, Niess A, Laakso M, Fritsche A, et al. Genetic variations in PPARD and PPARGC1A determine mitochondrial function and change in aerobic physical fitness and insulin sensitivity during lifestyle intervention. J Clin Endocrinol Metab 2007; 92: 1827-33.
13. Müssig K, Heni M, Thamer C, Kantartzis K, Machicao F, Stefan N, Frit- sche A, Häring HU, Staiger H. The ENPP1 K121Q polymorphism deter- mines individual susceptibility to the insulin-sensitising effect of lifestyle intervention. Diabetologia 2010; 53: 504-9.
14. Moore AF, Jablonski KA, Mason CC, McAteer JB, Arakaki RF, Goldstein BJ, Kahn SE, Kitabchi AE, Hanson RL, Knowler WC, et al. The association of ENPP1 K121Q with diabetes incidence is abolished by lifestyle modifi- cation in the diabetes prevention program. J Clin Endocrinol Metab 2009;
94: 449-55.
15. Weyrich P, Stefan N, Häring HU, Laakso M, Fritsche A. Effect of geno- type on success of lifestyle intervention in subjects at risk for type 2 diabe- tes. J Mol Med (Berl) 2007; 85: 107-17.
16. Kang JY, Cho SW, Sung SH, Park YK, Paek YM, Choi TI. Effect of a con- tinuous diabetes lifestyle intervention program on male workers in Ko- rea. Diabetes Res Clin Pract 2010; 90: 26-33.
17. Diabetes Prevention Program (DPP) Research Group. The Diabetes
Prevention Program (DPP): description of lifestyle intervention. Diabe- tes Care 2002; 25: 2165-71.
18. American Diabetes Association, Bantle JP, Wylie-Rosett J, Albright AL, Apovian CM, Clark NG, Franz MJ, Hoogwerf BJ, Lichtenstein AH, May- er-Davis E, et al. Nutrition recommendations and interventions for dia- betes: a position statement of the American Diabetes Association. Diabe- tes Care 2008; 31: S61-78.
19. Matthews DR, Hosker JP, Rudenski AS, Naylor BA, Treacher DF, Turner RC. Homeostasis model assessment: insulin resistance and beta-cell func- tion from fasting plasma glucose and insulin concentrations in man. Di- abetologia 1985; 28: 412-9.
20. Saely CH, Aczel S, Marte T, Langer P, Hoefle G, Drexel H. The metabolic syndrome, insulin resistance, and cardiovascular risk in diabetic and nondiabetic patients. J Clin Endocrinol Metab 2005; 90: 5698-703.
21. Chen J, Wildman RP, Hamm LL, Muntner P, Reynolds K, Whelton PK, He J. Association between inflammation and insulin resistance in U.S.
nondiabetic adults: results from the Third National Health and Nutri- tion Examination Survey. Diabetes Care 2004; 27: 2960-5.
22. Bonora E, Targher G, Alberiche M, Bonadonna RC, Saggiani F, Zenere MB, Monauni T, Muggeo M. Homeostasis model assessment closely mir- rors the glucose clamp technique in the assessment of insulin sensitivity:
studies in subjects with various degrees of glucose tolerance and insulin sensitivity. Diabetes Care 2000; 23: 57-63.
23. Vogeser M, König D, Frey I, Predel HG, Parhofer KG, Berg A. Fasting se- rum insulin and the homeostasis model of insulin resistance (HOMA-IR) in the monitoring of lifestyle interventions in obese persons. Clin Biochem 2007; 40: 964-8.
24. Maranghi M, Prudente S, D’Erasmo L, Morini E, Ciociola E, Coletta P, Verrienti A, Arciello S, Copetti M, Pellegrini F, et al. The ectonucleotide pyrophosphatase phosphodiesterase 1 (ENPP1) K121Q polymorphism modulates the beneficial effect of weight loss on fasting glucose in non- diabetic individuals. Nutr Metab Cardiovasc Dis 2013; 23: 505-10.
25. Chandalia M, Grundy SM, Adams-Huet B, Abate N. Ethnic differences in the frequency of ENPP1/PC1 121Q genetic variant in the Dallas Heart Study cohort. J Diabetes Complications 2007; 21: 143-8.
26. Sortica DA, Crispim D, Zaffari GP, Friedman R, Canani LH. The role of ecto-nucleotide pyrophosphatase/phosphodiesterase 1 in diabetic ne- phropathy. Arq Bras Endocrinol Metabol 2011; 55: 677-85.
27. DeFronzo RA, Ferrannini E. Insulin resistance. A multifaceted syndrome responsible for NIDDM, obesity, hypertension, dyslipidemia, and athero- sclerotic cardiovascular disease. Diabetes Care 1991; 14: 173-94.
28. Kang HM, Kim DJ. Total energy intake may be more associated with gly- cemic control compared to each proportion of macronutrients in the ko-
rean diabetic population. Diabetes Metab J 2012; 36: 300-6.
29. Black MH, Watanabe RM, Trigo E, Takayanagi M, Lawrence JM, Buchan- an TA, Xiang AH. High-fat diet is associated with obesity-mediated insu- lin resistance and β-cell dysfunction in Mexican Americans. J Nutr 2013;
143: 479-85.
30. Harding AH, Sargeant LA, Welch A, Oakes S, Luben RN, Bingham S, Day NE, Khaw KT, Wareham NJ. Fat consumption and HbA(1c) levels:
the EPIC-Norfolk study. Diabetes Care 2001; 24: 1911-6.
31. Gaboon NEA. Nutritional genomics and personalized diet. Egypt J Med Hum Genet 2011; 12: 1-7.
32. Phillips C, Lopez-Miranda J, Perez-Jimenez F, McManus R, Roche HM.
Genetic and nutrient determinants of the metabolic syndrome. Curr Opin Cardiol 2006; 21: 185-93.
33. Gami AS, Witt BJ, Howard DE, Erwin PJ, Gami LA, Somers VK, Montori VM. Metabolic syndrome and risk of incident cardiovascular events and death: a systematic review and meta-analysis of longitudinal studies. J Am Coll Cardiol 2007; 49: 403-14.
34. Bu J, Feng Q, Ran J, Li Q, Mei G, Zhang Y. Visceral fat mass is always, but adipokines (adiponectin and resistin) are diversely associated with insu- lin resistance in Chinese type 2 diabetic and normoglycemic subjects. Di- abetes Res Clin Pract 2012; 96: 163-9.
35. Shea JL, King MT, Yi Y, Gulliver W, Sun G. Body fat percentage is associ- ated with cardiometabolic dysregulation in BMI-defined normal weight subjects. Nutr Metab Cardiovasc Dis 2012; 22: 741-7.
36. Lim SY, Ha HS, Kwon HS, Lee JH, Yim HW, Yoon KH, Lee WC, Son HY, Park YM. Factors associated with insulin resistance in a middle-aged non- obese rural population: the Chungju Metabolic Disease Cohort (CMC) Study. Epidemiol Health 2011; 33: e2011009.
37. Gillies CL, Abrams KR, Lambert PC, Cooper NJ, Sutton AJ, Hsu RT, Khunti K. Pharmacological and lifestyle interventions to prevent or delay type 2 diabetes in people with impaired glucose tolerance: systematic review and meta-analysis. BMJ 2007; 334: 299.
38. Bouchard DR, Baillargeon JP, Gagnon C, Brown C, Langlois MF. Impact of health professionals’ contact frequency on response to a lifestyle inter- vention with individuals at high risk for diabetes. Diabetes Res Clin Pract 2012; 96: 129-34.
39. Choi MJ, Yoo SH, Kim KR, Bae YM, Ahn SH, Kim SS, Min SA, Choi JS, Lee SE, Moon YJ, et al. Effect on glycemic, blood pressure, and lipid con- trol according to education types. Diabetes Metab J 2011; 35: 580-6.
40. Abate N, Chandalia M, Di Paola R, Foster DW, Grundy SM, Trischitta V.
Mechanisms of disease: ectonucleotide pyrophosphatase phosphodies- terase 1 as a ‘gatekeeper’ of insulin receptors. Nat Clin Pract Endocrinol Metab 2006; 2: 694-701.