This is an Open Access article distributed under the terms of the Creative Commons At- tribution Non-Commercial License (http://creativecommons.org/licenses/by-nc/3.0/) which permits unrestricted non-commercial use, distribution, and reproduction in any medium, provided the original work is properly cited.
Association between Obesity and Physical Fitness, and Hemoglobin A1c Level and Metabolic Syndrome in Korean Adults
Yoonsuk Jekal1,*, Mi-Kyung Lee1,*, Sukyung Park1, Seung-Hwan Lee1, Jun-Young Kim1, Jung-Ui Kang1, Masayo Naruse1, Sang-Hwan Kim2, Sun-Hyeon Kim2, Sang Hui Chu3, Sang-Hoon Suh4, Justin Y Jeon1
1Department of Sport and Leisure Studies, Yonsei University College of Education, Seoul,
2Department of Family Medicine, Myongji Hospital, Kwandong University School of Medicine, Goyang,
3Department of Nursing, Yonsei University College of Nursing, Seoul,
4Department of Physical Education, Yonsei University College of Education, Seoul, Korea
Background: The purpose of the current study was to investigate the association of obesity level, physical fitness level, hemoglo- bin A1c (HbA1c) level and metabolic syndrome (MetS) risk factors among Korean adults.
Methods: A total of 557 adults (272 males and 285 females) who underwent medical check-up at local hospital were recruited.
In addition to regular health check-up, cardiopulmonary fitness, muscular endurance were measured and their association were analyzed.
Results: The prevalence of MetS was 31.7% for males and 23.7% for females. Females with the higher muscular endurance had lower waist circumference, triglyceride level, and HbA1c level than those with the lower muscular endurance. Males with the higher level of cardiopulmonary fitness had lower diastolic blood pressure, lower high-sensitivity C-reactive protein level and higher high density lipoprotein cholesterol level than males with the lower level of cardiopulmonary fitness. Females with the higher level of cardiopulmonary fitness had lower body weight, body mass index, systolic blood pressure, and fasting blood glu- cose level than females with the lower level of cardiopulmonary fitness. Participants with the higher level of adiposity and the lower level of physical fitness were 5.26 times (95% confidence interval [CI], 2.19 to 12.62), 5.71 times (95% CI, 2.23 to 14.60) more likely to have MetS, respectively, in male and female compared to participants who were neither obese nor have the lower level of fitness.
Conclusion: This study suggests that maintaining a healthy body weight as well as a certain level of fitness is important for the prevention of MetS.
Keywords: Hemoglobin A1c; Metabolic syndrome; Obesity; Physical fitness
Corresponding author: Justin Y Jeon
Department of Sport and Leisure Studies, Yonsei University, 134 Shinchon- dong, Seodaemen-gu, Seoul 120-749, Korea
E-mail: jjeon@yonsei.ac.kr
INTRODUCTION
According to the Korean National Health and Nutrition Ex- amination Survey of 2005 [1], 41.2% of males and 43.9% of fe- males aged over 40 years were either overweight or obese. In addition, 34.9% of males and 19.6% of females aged at 40s had
metabolic syndrome (MetS) based on the definition set forth by National Cholesterol Education Program (NCEP) Adult Treatment Panel III (ATP III). People who were over the age of 50, 43.7% of males and 45.5% of females had MetS [1]. Obesity is long been known as the cause of metabolic syndrome as well as other chronic diseases such as type 2 diabetes and cancer pISSN 1976-9180 · eISSN 2093-2650
[2,3].
Another factor which contributes to the development of MetS is a low level of physical fitness. The importance of physical fit- ness is well-documented, and many studies have reported the importance of maintaining certain level of physical fitness to prevent chronic diseases such as type 2 diabetes and cardiovas- cular disease [4]. Obese people with low levels of cardiopulmo- nary fitness have a higher mortality rate than obese people who have higher levels of cardiopulmonary fitness [5,6]. In fact, a person with low cardiopulmonary fitness has a mortality rate 2.1 times higher than a person with high cardiopulmonary fit- ness, which clearly indicates that high cardiopulmonary fitness is associated with decreased mortality rate [7]. Another study examining the association between obesity, physical fitness and chronic disease mortality with 21,925 people reported that peo- ple who were lean and poor physical fitness (2.91 times), and obese and poor physical fitness (4.08 times) had higher mortali- ty rate as compared to lean and good physical fitness [8]. Re- sults from the above studies indicate that type 2 diabetes and cardiovascular disease should be treated and prevented not only through treatment and eradication of obesity, but also by the increased state of physical fitness with participation of reg- ular physical activity. In addition, maintaining certain level of muscular endurance also helps maintaining lower levels of blood glucose and hemoglobin A1c (HbA1c) [9].
Although the importance of both fatness and cardiopulmo- nary fitness for the prevention and treatment of MetS and oth- er chronic diseases has been investigated, the effects of muscu- lar endurance or combined effects of both cardiopulmonary and muscular fitness on MetS are not fully understood. There- fore, the purpose of the current study is to investigate the asso- ciation of obesity level, cardiopulmonary fitness and muscular endurance with HbA1c level and MetS risk factors.
METHODS
Study population
In this study, 577 subjects were recruited from the adult pa- tients of the Health Examination Center at Kwandong Univer- sity Medical Center in Gyeonggi province between November and December 2008. The characteristics of the study partici- pants are presented in Table 1. This study was approved by the ethics committee of Miz Medi Hospital, Seoul Korea. The study protocol was explained to the participants and only those who signed the consent form were selected to participate.
Data collection
Anthropometric measurements and blood pressure
The height and weight of the subjects, wearing casual clothes without shoes, was taken using JENIX automatic measuring equipment (Garden Jenix, Seoul, Korea). Body mass index (BMI) was calculated as weight (kg) divided by height squared (m2). The waist circumference (WC) was measured at the small- est circumference between the iliac ridge and the twelfth rib, with the arms of the subjects at their sides. Hip circumference (HP) was measured with the subjects in a relaxed, standing position, and was taken at the widest section between the um- bilicus and gluteal fold. Blood pressure (BP) was measured when the subjects were relaxed, using a mercury sphygmoma- nometer (Hico, Tokyo, Japan).
Physical fitness measurements
For the physical fitness measurements, a step test was used to measure cardiopulmonary fitness and sit-ups were used to mea- sure muscular endurance, as described below.
Cardiopulmonary fitness was assessed using the Tecumseh step test. Based on the guidelines for the Tecumseh step test, subjects performed 24 steps per minute, maintaining a con- stant stepping rate, on a 20.3 cm high step for 3 minutes. To help maintain a constant stepping rate, a metronome was used and an assistant was present. The subjects wore heart rate moni- tors (Polar-FS3C, USA), and heart rates were recorded prior to exercise and at each 1-minute intervals during the exercise ses- sion. Heart rate was also measured at 1-minute post-exercise during recovery phase. Participants with higher cardiopulmo- nary fitness would have lower heart rates at 1-minute post-ex- ercise than those with lower cardiopulmonary fitness [10].
Muscular endurance was assessed using a sit-up test. The participants lay on the sit-up equipment and performed sit- ups with their feet attached to the equipment’s foot holders.
One sit-up was counted when the participants had sat up so that their elbows touched their thighs, and they had returned to the supine position and both shoulders touched the equip- ment. The number of sit-ups performed in 30 seconds was re- corded.
Blood collection and analysis
Blood samples were collected from the participants following a 12-hour fast and 30-minutes of rest. The collected blood samples were put into a thermionic tube without any anti-co- agulation chemicals. Following collection, the blood samples
were centrifuged at 3,000 rpm for 15 minutes and the blood plasma was stored at -80°C. The stored blood plasma was then analyzed at the Myongji hospital in Gyeonggi province. Fast- ing blood glucose (FBG), total cholesterol (TC), triglyceride (TG), high density lipoprotein cholesterol (HDL-C), and high- sensitivity C-reactive protein (hs-CRP) levels were analyzed by ADVIA 1650 (Bayer, Terrytown, NY, USA) using colorime- try technology.
Definition of metabolic syndrome
According to NCEP ATPIII standard, MetS is diagnosed when a person has 3 or more components from the following list:
abdominal obesity (WC over 102 cm for males, over 88 cm for females), high FBG level (over 100 mg/dL, fasting), high BP (systolic blood pressure [SBP] over 130 mm Hg or diastolic blood pressure [DBP] over 85 mm Hg), high TG (over 150
mg/dL), and low level of HDL-C (under 40 mg/dL for males, under 50 mg/dL for females) [11]. Due to smaller body size, Asian version modified NCEP ATP III definition were em- ployed (WC: over 90 cm in males, over 80 cm in females) [12].
Data analysis
Data were analyzed using Predictive Analytics Software (PASW) Statistics 17.0 (SPSS Inc., Chicago, IL, USA). To ana- lyze the relationship between obesity, physical fitness levels and the components of MetS, the participants were classified into three groups (tertiles) based on the individuals’ each BMI and a level of physical fitness. Differences among the three groups were analyzed by ANOVA and ANCOVA. Since car- diopulmonary fitness and muscular endurance decrease with age, the age of the participants were controlled.
To examine the combined effects of obesity and physical fit- ness on the components of MetS, participants were first classi- Table 1. Participants’ characteristics
Total
(n = 557) Males
(n = 272) Females
(n = 285) P valuea
Age 53.90 ± 13.28 54.98 ± 13.44 52.88 ± 13.07 0.062
Height, cm 163.44 ± 8.26 169.54 ± 5.82 157.64 ± 5.64 < 0.001
Weight, kg 64.30 ± 10.99 70.84 ± 9.43 58.06 ± 8.47 < 0.001
BMI, kg/m2 23.98 ± 3.11 24.61 ± 2.72 23.39 ± 3.35 < 0.001
WC, cm 79.22 ± 8.99 84.00 ± 7.05 74.61 ± 8.23 < 0.001
SBP, mm Hg 124.70 ± 13.85 126.30 ± 12.47 123.17 ± 14.92 0.007
DBP, mm Hg 75.41 ± 9.63 77.82 ± 8.99 73.10 ± 9.67 < 0.001
TC, mg/dL 191.39 ± 34.42 188.04 ± 33.00 194.60 ± 33.57 0.020
TG, mg/dL 134.74 ± 86.87 154.42 ± 94.88 116.52 ± 74.38 < 0.001
HDL-C, mg/dL 49.58 ± 12.19 45.94 ± 10.74 52.94 ± 12.50 < 0.001
FBG, mg/dL 101.69 ± 21.58 106.68 ± 24.62 96.93 ± 16.93 < 0.001
HbA1c, % 5.68 ± 0.76 5.76 ± 0.81 5.61 ± 0.70 0.025
hs-CRP, mg/dL 0.182 ± 0.878 0.164 ± 0.278 0.198 ± 1.189 0.004
Sit-Up, number/30 sec 12.59 ± 7.06 16.16 ± 5.68 9.17 ± 6.54 < 0.001
RHR, beat/min* 78.13 ± 11.36 76.74 ± 11.47 79.46 ± 11.10 0.005
1 min HR, beat/min* 102.89 ± 13.11 98.43 ± 11.71 107.08 ± 12.97 < 0.001
2 min HR, beat/min* 110.84 ± 14.33 105.25 ± 12.40 116.20 ± 14.01 < 0.001
3 min HR, beat/min* 112.64 ± 15.88 107.47 ± 13.44 117.69 ± 16.47 < 0.001
1-min post exercise HR, beat/min* 89.57 ± 14.63 87.11 ± 14.67 91.94 ± 14.22 < 0.001 Data are mean ± standard deviation.
BMI, body mass index; WC, waist circumference; SBP, systolic blood pressure; DBP, diastolic blood pressure; TC, total cholesterol; TG, triglyc- eride; HDL-C, high density lipoprotein cholesterol; FBG, fasting blood glucose; HbA1c, hemoglobin A1c; hs-CRP, high sensitivity C-reactive protein; RHR, resting heart rate; HR, heart rate.
aComparison between gender.
*Heart rate assessment during Tecumseh step test.
fied into two groups based on each level of total physical fit- ness (cardiopulmonary and muscular strength) and obesity.
Those two groups (50th percentile) were then subdivided into four different groups: low physical fitness and high degree of obesity; low physical fitness and low degree of obesity; high physical fitness and high degree of obesity; and high physical fitness and low degree of obesity. The mean values of five MetS components (WC, BP, FBG, TG, and HDL-C) were compared across 4 groups by ANOVA and ANCOVA. Using a logistic regression model, relative risks in abnormality of the compo- nents of MetS and prevalence of MetS itself were analyzed across the level of obesity, the level of physical fitness and a mixed level of obesity and physical fitness. Statistical signifi- cance was set at P < 0.05.
RESULTS
Characteristics of the participants
Characteristics of participants are shown in Table 1. Males were significantly taller, heavier, and had higher BMI, WC, BP, TG level, FBG level and HbA1c level than females. However, fe-
males had significantly higher levels of TC, HDL-C, and hs- CRP than males. In addition, males had higher level of cardio- pulmonary fitness and muscular endurance than females. The
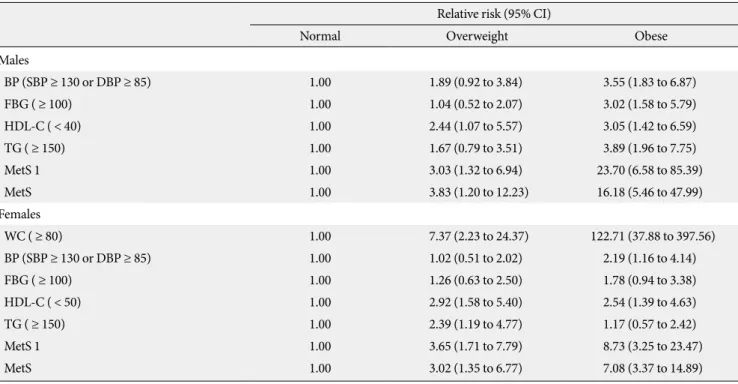
Table 2. Relative risks for metabolic syndrome across a level of obesity after adjusting for age Relative risk (95% CI)
Normal Overweight Obese
Males
BP (SBP ≥ 130 or DBP ≥ 85) 1.00 1.89 (0.92 to 3.84) 3.55 (1.83 to 6.87)
FBG ( ≥ 100) 1.00 1.04 (0.52 to 2.07) 3.02 (1.58 to 5.79)
HDL-C ( < 40) 1.00 2.44 (1.07 to 5.57) 3.05 (1.42 to 6.59)
TG ( ≥ 150) 1.00 1.67 (0.79 to 3.51) 3.89 (1.96 to 7.75)
MetS 1 1.00 3.03 (1.32 to 6.94) 23.70 (6.58 to 85.39)
MetS 1.00 3.83 (1.20 to 12.23) 16.18 (5.46 to 47.99)
Females
WC ( ≥ 80) 1.00 7.37 (2.23 to 24.37) 122.71 (37.88 to 397.56)
BP (SBP ≥ 130 or DBP ≥ 85) 1.00 1.02 (0.51 to 2.02) 2.19 (1.16 to 4.14)
FBG ( ≥ 100) 1.00 1.26 (0.63 to 2.50) 1.78 (0.94 to 3.38)
HDL-C ( < 50) 1.00 2.92 (1.58 to 5.40) 2.54 (1.39 to 4.63)
TG ( ≥ 150) 1.00 2.39 (1.19 to 4.77) 1.17 (0.57 to 2.42)
MetS 1 1.00 3.65 (1.71 to 7.79) 8.73 (3.25 to 23.47)
MetS 1.00 3.02 (1.35 to 6.77) 7.08 (3.37 to 14.89)
Normal, BMI < 23; Overweight, 23 ≤ BMI < 25; Obese BMI ≥ 25.
CI, confidence interval; BP, blood pressure; SBP, systolic blood pressure; DBP, diastolic blood pressure; FBG, fasting blood glucose; HDL-C, high density lipoprotein cholesterol; TG, triglyceride; MetS 1, one or more abnormal value of five components of metabolic syndrome; MetS, metabolic syndrome; WC, waist circumference.
Fig. 1. Prevalence of metabolic syndrome and its compo- nents. WC, waist circumference greater than 90 cm (male) and greater than 80 cm (female); BP, blood pressure of 130/85 mm Hg or higher; FBG, fasting blood glucose level greater than 100 mg/dL, HDL-C, high density lipoprotein cholesterol level of less than 40 mg/dL (male) and less than 50 mg/dL (female);
TG, triglyceride of 150 mg/dL or higher; MetS, metabolic syn- drome.
Prevalence, %
60 50 40 30 20 10
0 WC BP FBG HDL-C TG MetS
Male Female
21.5
44.9
52.6
29.4
43.1
31.7 25.7
33.5 27
45.6
23.5 23.7
prevalence of MetS in the current study population was 31.7% for the males and 23.7% for females. In fact, the prevalence of abnor- mality in the components of MetS with the exception of HDL-C was higher among males as compared to females (Fig. 1).
Effects of obesity on HbA1C and MetS
Relative risks of abnormality in components of MetS and the
development of MetS across the level of obesity are presented in Table 2.
In males, obese participants (BMI > 25) were significantly more likely to have abnormal values of BP (3.55 times), FBG (3.02 times), HDL-C (3.05 times) and TG (3.89 times), one or more abnormal values of MetS components (23.70 times), and higher prevalence of MetS (16.18 times) as compared to healthy Table 3. Comparisons of mean value of anthropometric and
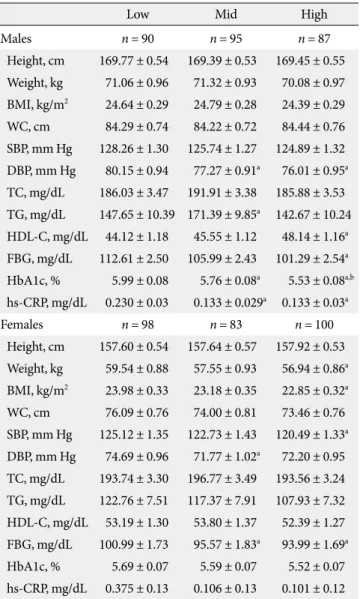
serum analysis across a level of muscular endurance after ad- justing for age
Low Mid High
Males n = 94 n = 84 n = 89
Height, cm 169.30 ± 0.62 169.73 ± 0.57a 169.70 ± 0.65a Weight, kg 68.88 ± 1.08 71.32 ± 0.99a 72.76 ± 1.12a BMI, kg/m2 24.02 ± 0.33 24.73 ± 0.29 25.20 ± 0.34a WC, cm 83.39 ± 0.84 84.52 ± 0.77 84.32 ± 0.88 SBP, mm Hg 128.40 ± 1.49 125.38 ± 1.36 125.24 ± 1.54 DBP, mm Hg 78.68 ± 1.09 77.55 ± 0.99 77.39 ± 1.13 TC, mg/dL 186.40 ± 3.94 195.10 ± 3.59 183.39 ± 4.09b TG, mg/dL 143.14 ± 11.75 166.49 ± 10.75 155.68 ± 11.75 HDL-C, mg/dL 45.95 ± 1.32 44.87 ± 1.21 46.55 ± 1.32 FBG, mg/dL 106.47 ± 2.90 108.03 ± 2.65 105.65 ± 3.01 HbA1c, % 5.81 ± 0.96 5.80 ± 0.88 5.68 ± 0.96 hs-CRP, mg/dL 0.138 ± 0.34 0.170 ± 0.31 0.178 ± 0.34
Females n = 96 n = 92 n = 91
Height, cm 156.81 ± 0.56 157.71 ± 0.54 158.50 ± 0.59 Weight, kg 58.01 ± 0.88 57.69 ± 0.85 58.09 ± 0.93 BMI, kg/m2 23.59 ± 0.34 23.23 ± 0.33 23.16 ± 0.36 WC, cm 75.72 ± 0.80 73.85 ± 0.76a 73.90 ± 0.83a SBP, mm Hg 123.49 ± 1.46 123.01 ± 1.40 122.40 ± 1.55 DBP, mm Hg 72.31 ± 1.02 73.47 ± 0.98 73.33 ± 1.08 TC, mg/dL 192.36 ± 3.49 199.95 ± 3.35 191.18 ± 3.68 TG, mg/dL 130.29 ± 7.81 118.51 ± 7.53 101.67 ± 8.22a HDL-C, mg/dL 50.87 ± 1.36 54.09 ± 1.31 54.40 ± 1.43 FBG, mg/dL 98.07 ± 1.79 96.04 ± 1.72 96.03 ± 1.89 HbA1c, % 5.68 ± 0.069 5.53 ± 0.067a 5.58 ± .073 hs-CRP, mg/dL 0.348 ± 0.13 0.121 ± 0.13 0.123 ± 0.14 Data are mean ± standard error.
BMI, body mass index; WC, waist circumference; SBP, systolic blood pressure; DBP, diastolic blood pressure; TC, total cholesterol; TG, triglyceride; HDL-C, high density lipoprotein cholesterol; FBG, fast- ing blood glucose; HbA1c, hemoglobin A1c; hs-CRP, high sensitivity C-reactive protein.
aSignificant difference with low fit and bwith mid fit.
Table 4. Comparisons of mean value of anthropometric and serum analysis across a level of cardiopulmonary fitness after adjusting for age
Low Mid High
Males n = 90 n = 95 n = 87
Height, cm 169.77 ± 0.54 169.39 ± 0.53 169.45 ± 0.55 Weight, kg 71.06 ± 0.96 71.32 ± 0.93 70.08 ± 0.97 BMI, kg/m2 24.64 ± 0.29 24.79 ± 0.28 24.39 ± 0.29 WC, cm 84.29 ± 0.74 84.22 ± 0.72 84.44 ± 0.76 SBP, mm Hg 128.26 ± 1.30 125.74 ± 1.27 124.89 ± 1.32 DBP, mm Hg 80.15 ± 0.94 77.27 ± 0.91a 76.01 ± 0.95a TC, mg/dL 186.03 ± 3.47 191.91 ± 3.38 185.88 ± 3.53 TG, mg/dL 147.65 ± 10.39 171.39 ± 9.85a 142.67 ± 10.24 HDL-C, mg/dL 44.12 ± 1.18 45.55 ± 1.12 48.14 ± 1.16a FBG, mg/dL 112.61 ± 2.50 105.99 ± 2.43 101.29 ± 2.54a HbA1c, % 5.99 ± 0.08 5.76 ± 0.08a 5.53 ± 0.08a,b hs-CRP, mg/dL 0.230 ± 0.03 0.133 ± 0.029a 0.133 ± 0.03a
Females n = 98 n = 83 n = 100
Height, cm 157.60 ± 0.54 157.64 ± 0.57 157.92 ± 0.53 Weight, kg 59.54 ± 0.88 57.55 ± 0.93 56.94 ± 0.86a BMI, kg/m2 23.98 ± 0.33 23.18 ± 0.35 22.85 ± 0.32a WC, cm 76.09 ± 0.76 74.00 ± 0.81 73.46 ± 0.76 SBP, mm Hg 125.12 ± 1.35 122.73 ± 1.43 120.49 ± 1.33a DBP, mm Hg 74.69 ± 0.96 71.77 ± 1.02a 72.20 ± 0.95 TC, mg/dL 193.74 ± 3.30 196.77 ± 3.49 193.56 ± 3.24 TG, mg/dL 122.76 ± 7.51 117.37 ± 7.91 107.93 ± 7.32 HDL-C, mg/dL 53.19 ± 1.30 53.80 ± 1.37 52.39 ± 1.27 FBG, mg/dL 100.99 ± 1.73 95.57 ± 1.83a 93.99 ± 1.69a HbA1c, % 5.69 ± 0.07 5.59 ± 0.07 5.52 ± 0.07 hs-CRP, mg/dL 0.375 ± 0.13 0.106 ± 0.13 0.101 ± 0.12 Data are mean ± standard error.
BMI, body mass index; WC, waist circumference; SBP, systolic blood pressure; DBP, diastolic blood pressure; TC, total cholesterol; TG, triglyceride; HDL-C, high density lipoprotein cholesterol; FBG, fast- ing blood glucose; HbA1c, hemoglobin A1c; hs-CRP, high sensitivity C-reactive protein.
aSignificant difference with low fit and bwith mid fit.
body weight participants (BMI ≤ 23). In females, obese partici- pants were significantly more likely to have abnormal values of WC (122.71 times), BP (2.19 times) and HDL-C (2.54 times), one or more abnormal values of MetS components (8,73 times) and higher prevalence of MetS (7.08 times) as compared to healthy body weight participants.
Effects of Fitness on HbA1C and MetS
Tables 3 and 4 present the mean values of body composition, components of MetS and HbA1c across the level of muscular endurance and cardiopulmonary fitness after adjusting for age.
Males with the high level of muscular endurance had signif- icantly lower value of TC than counterparts with the low level of muscular endurance. Females with the high level of muscu- lar endurance had lower values of WC and TG, and females who had the moderate level of muscular endurance had lower value of HbA1c than females with the lower muscular endurance (Table 3).
Males with the high cardiopulmonary fitness had signifi- cantly lower mean values of DBP, FBG, HbA1c and hs-CRP and higher value of HDL-C than males with the low cardiopul- monary fitness. Females with the high cardiopulmonary fitness had significantly lower mean values of body weight, BMI, SBP, and FBG than females with the low cardiopulmonary fitness (Table 4).
Fig. 2 presents the prevalence of abnormal values in five com- ponents of MetS and a development of MetS across the level of total physical fitness (2 groups, 50th percentiles). The values of cardiopulmonary fitness and muscular endurance were con- verted into z-score, and two z-score data were summed for to- tal physical fitness score. Participants with low total fitness lev- el (lower 50th percentile) were more likely to have abnormal values in all five components of MetS and increased prevalence of MetS as compared to those with the high total fitness level (upper 50th percentile).
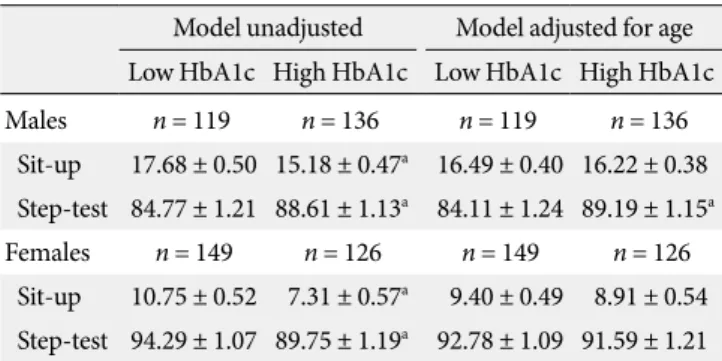
Table 5 presents a comparison of the mean values of muscu- lar endurance (the number of sit-up performed, high number:
high fit) and cardiopulmonary fitness (1-minute post exercise hear rate, low beat: high fit) by a level of HbA1c. In males, those with the high HbA1c level (> 5.5) had significantly lower mus- cular endurance and cardiopulmonary fitness than counter- parts with the low HbA1c level (≤ 5.5). In females, those with the high HbA1c level had significantly lower muscular endur- ance and higher cardiopulmonary fitness than counterparts with low HbA1c level. After adjusting for age, males with the high HbA1c level had significantly lower level of cardiopul- monary fitness than those with the low HbA1c level.
Effects of obesity and Fitness on HbA1c and MetS
Table 6 shows the relative risks for abnormality in five compo- nents of MetS, having one or more abnormal values in five com- ponents and a development of MetS across the combined lev- els of obesity and physical fitness. Males with the higher level of obesity and lower level of fitness were significantly more like- ly to have abnormality in BP (3.04 times), FBG (3.40 times) and TG (4.34), one or more abnormal value of five components (15.79 times) and a prevalence of Mets (5.26 times) as compared to
Table 5. Comparison of physical fitness levels by level of HbA1c Model unadjusted Model adjusted for age Low HbA1c High HbA1c Low HbA1c High HbA1c
Males n = 119 n = 136 n = 119 n = 136
Sit-up 17.68 ± 0.50 15.18 ± 0.47a 16.49 ± 0.40 16.22 ± 0.38 Step-test 84.77 ± 1.21 88.61 ± 1.13a 84.11 ± 1.24 89.19 ± 1.15a Females n = 149 n = 126 n = 149 n = 126
Sit-up 10.75 ± 0.52 7.31 ± 0.57a 9.40 ± 0.49 8.91 ± 0.54 Step-test 94.29 ± 1.07 89.75 ± 1.19a 92.78 ± 1.09 91.59 ± 1.21 Data are mean ± standard error. Low HbA1c, ≤ 5.5; High HbA1c, > 5.6.
aSignificant difference with Low group.
Prevalence, %
50 45 40 35 30 25 20 15 10 5 0
Fig. 2. Prevalence of metabolic syndrome by total physical fit- ness level. WC, waist circumference greater than 90 cm (male) and greater than 80 cm (female); BP, blood pressure of 130/85 mm Hg or higher; FBG, fasting blood glucose level greater than 100 mg/dL, HDL-C, high density lipoprotein cholesterol level of less than 40 mg/dL (male) and less than 50 mg/dL (fe- male); TG, triglyceride of 150 mg/dL or higher; MetS, meta- bolic syndrome.
WC BP FBG HDL-C TG MetS
Low Fit High Fit 28.6
45.5 44.4
39.4 36.4
31 19.3
31.7 34.2 34.8
30.1
22.2
males with the lower level of obesity and higher level of fitness.
In females, those with the higher level of obesity and lower level of fitness were significantly more likely to have abnormality in WC (24.92 times), BP (2.33 times) and HDL-C (3.76 times), one or more abnormal value of five components (9.05 times), and higher prevalence of MetS (5.71 times) as compared to with the lower level of obesity and higher level of fitness.
In males, as compared to those with the lower level of obe- sity and higher level of fitness, those with the lower fitness and lower obesity were more likely to have abnormality in TG (2.38 times) and one or more abnormal value of five components (4.22 times). In addition, males with the higher fitness and higher obesity were more likely to have abnormality in BP (2.81 times), FBG (2.34 times) and TG (3.95 times), one or more ab- normal value of five components (12.08 times) and a prevalence of MetS (4.84 times). In females, as compared to those with the higher fitness level and the lower level of obesity, those with the higher fitness level and the higher fatness levels were more like- ly to have abnormality in WC (8.88 times), HDL-C (3.94 times) and TG (2.78 times), one or more abnormal value of five components (5.67 times) and higher prevalence of MetS
(3.52 times).
DISCUSSION
The importance of fatness and fitness in prevention of chronic diseases including type 2 diabetes, cardiovascular disease and MetS was determined in the current study. Additionally, the current study identified that there is significant association be- tween the level of physical fitness including cardiopulmonary and muscular fitness and some components of MetS, which has not been fully elucidated in the previous studies.
The current study identified a significant relationship between the level of physical fitness including cardiopulmonary fitness and muscular fitness and glucose regulation and MetS in both males and females. People with high fitness level were less likely to have abnormal values in five MetS components, and 50% less likely to be diagnosed as MetS. This finding of the current study agreed with previous studies with healthy people or people with chron- ic disease.
In the study with Korean high school students, adolescents in the lowest level of physical fitness were more likely to have Table 6. Relative risks for metabolic syndrome across a mixed level of physical fitness and obesity after adjusting for age
Relative Risk (95% CI)
Low Fitness High Fitness
High BMI Low BMI High BMI Low BMI
Males n = 68 n = 66 n = 67 n = 66
BP (SBP ≥ 130 or DBP ≥ 85) 3.04 (1.44 to 6.42) 1.67 (0.77 to 3.58) 2.81 (1.36 to 5.82) 1.00
FG ( ≥ 100) 3.40 (1.60 to 7.21) 1.39 (0.65 to 2.96) 2.34 (1.14 to 4.79) 1.00
HDL-C ( < 40) 1.70 (0.78 to 3.69) 0.91 (0.39 to 2.12) 1.50 (0.70 to 3.21) 1.00
TG ( ≥ 150) 4.34 (1.97 to 9.54) 2.38 (1.05 to 5.39) 3.95 (1.86 to 8.43) 1.00
MetS 1 15.79 (3.48 to 71.58) 4.22 (1.50 to 11.89) 12.08 (3.40 to 42.92) 1.00
MetS 5.26 (2.19 to 12.64) 0.90 (0.33 to 2.51) 4.84 (2.04 to 11.49) 1.00
Females n = 70 n = 63 n = 61 n = 78
WC ( ≥ 80) 24.92 (7.92 to 78.43) - 8.88 (2.77 to 28.43) 1.00
BP (SBP ≥130or DBP ≥ 85) 2.33 (1.08 to 5.06) 1.89 (0.85 to 4.19) 1.46 (0.64 to 3.30) 1.00
FBG ( ≥ 100) 1.64 (0.76 to 3.52) 0.97 (0.42 to 2.20) 1.35 (0.61 to 2.98) 1.00
HDL-C ( < 50) 3.76 (1.84 to 7.72) 1.70 (0.83 to 3.51) 3.94 (1.90 to 8.16) 1.00
TG ( ≥ 150) 2.37 (0.97 to 5.82) 1.85 (0.72 to 4.73) 2.78 (1.12 to 6.89) 1.00
MetS 1 9.05 (3.57 to 22.93) 1.96 (0.96 to 4.02) 5.67 (2.44 to 13.14) 1.00
MetS 5.71 (2.23 to 14.60) 1.04 (0.34 to 3.23) 3.53 (1.33 to 9.40) 1.00
CI, confidence interval; BP, blood pressure; SBP, systolic blood pressure; DBP, diastolic blood pressure; FBG, fasting blood glucose; HDL-C, high density lipoprotein cholesterol; TG, triglyceride; MetS 1, one or more abnormal value of five components of metabolic syndrome; MetS, metabolic syndrome; WC, waist circumference.
high BMI, insulin resistance and the higher number of cardio- vascular disease risk factors [4]. Interestingly, maintaining normal glucose tolerance was anticipated with even low in- tense activity participation. In the study with subjects with type 2 diabetes, subject who spent more time in walking had signifi- cantly decreased risk of oral glucose intolerance [13].
In addition, the result of a study examining 2,316 diabetic patients for 15 years reported that a reduction of each 1 MET (metabolic equivalent) in cardiopulmonary fitness resulted in a 20% increase of mortality rate, and cardiopulmonary fitness under 8.8 MET significantly increased the diabetes mortality [14,15]. McAuley et al. [16] demonstrated that people with low level of cardiopulmonary fitness (under 5 MET) had an 80%
increase in mortality rate. If standardized guidelines report the minimal level of physical fitness to prevent MetS, diabetes or cardiovascular disease, these guidelines sigfnificantly will help reducing the prevalence of metabolic diseases as well as main- taining or promoting healthy life.
Similar to the findings of previous studies, current study concluded that reducing body weight plays a significant role in preventing risk factors of chronic disease or disease itself. By analyzing data from the Korean National Health Insurance Corporation (KNHIC) study from 1993 to 2004, Jee and his colleagues [17] concluded that a person with BMI of 32 kg/m2 or greater had a 2.9 times higher (for males) and 1.3 times higher (for females) premature mortality rate as compared to a person with BMI of 23 to 25 kg/m2. The results of the current study indicated that obese males and females were more likely to have abnormality in components of MetS and a development of MetS than males and females with normal body weight.
These findings concurred with Katzmarzyk’s research, which found that obese or overweight people were more likely to be diagnosed as MetS (30.6 times and 4.7 times, respectively) as compared to normal weight people [18]. Therefore, both stud- ies concluded that increased rate of developing MetS is antici- pated from increased prevalence of obesity.
In order to investigate the relationships between a mixed level of obesity and physical fitness and components of MetS, all participants were classified into four groups: 1) high fatness and low fitness, 2) high fatness and high fitness, 3) fatness and low fitness, and 4) low fatness and high fitness. The findings from comparisons between these four groups concluded that participants with high fatness and low fitness level were most likely to have abnormality in components of MetS and MetS, and participants with high fatness and fitness was the second
most likely to have abnormality in components of MetS and MetS. These findings indicate that the level of obesity would be a more significant correlate of MetS than the level of physi- cal fitness. The males with low fatness and low fitness had rela- tively higher triglyceride level and higher number of abnormal values in MetS components than the males with low fatness and high fitness. In general, both the males and females with high fatness and low fitness were more likely to have higher number of abnormal values in MetS components than coun- terparts with high fatness and high fitness. We infer that peo- ple with a high degree of obesity may be greatly influenced by low physical fitness level which in turn increases the likelihood of abnormality in components of MetS.
The study on mortality rates for cardiovascular disease as- sociated with obesity and cardiopulmonary fitness with 21,925 males found that male adults with normal body weight and low cardiopulmonary fitness had 2.94 times higher mortality rates than those with normal body weight and high cardiopul- monary fitness [5]. The study also found that obese males with low cardiopulmonary fitness had 4.11 times higher mortality rate by cardiovascular disease than obese males with high car- diopulmonary fitness [5]. These findings concluded that both the level of obesity and cardiopulmonary fitness level were strongly related with the cardiovascular disease mortality. An- other study examining the relationship between cardiopulmo- nary fitness, obesity and the prevalence of diabetes among 6,249 females found that females with high fat and high fit were 2.32 times more likely to have diabetes as compared to females with normal body weight and high fit, and obese females with low cardiopulmonary fitness were 3.62 times more likely to have diabetes than normal females with high fitness [19].
The current study used customary methods in the fields of physical fitness assessment or the clinical trials, and these meth- ods are cost-efficient and less-burdensome. The Tecumseh step test is less common in clinical trials as compared to gas analyzer to measure VO2max. However, it is simple and easy to perform, and it is ideal for applying to a variety of subjects including all age groups or with different physical conditions even with chronic disease [20,21]. A study by Lee et al. [10] reported that the results of VO2max gas analyzer and the step test were signifi- cantly correlated (r = -0.490) and this step test could be a sub- stitute for measuring cardiopulmonary fitness. The sit-up test employed to measure muscular endurance in the current study is widely used in the Korea as well as in most countries, and the sit-up test data used in our previous study was signifi-
cantly related to insulin resistance [22].
The finding from the current study recommends that main- taining healthy body weight as well as good level of physical fitness including cardiopulmonary and muscular fitness is im- portant for the treatment and prevention of metabolic diseases including, type 2 diabetes, cardiovascular disease and MetS.
REFERENCES
1. Ministry of Health and Welfare, Korea Centers for Disease Control and Prevention. The Third Korea National Health and Nutrition Examination Survey (KNHANES III), 2005. Seoul:
Ministry of Health and Welfare; 2006.
2. Arnlov J, Ingelsson E, Sundstrom J, Lind L. Impact of body mass index and the metabolic syndrome on the risk of cardio- vascular disease and death in middle-aged men. Circulation 2010;121:230-6.
3. Aschner P. Metabolic syndrome as a risk factor for diabetes.
Expert Rev Cardiovasc Ther 2010;8:407-12.
4. Jekal Y, Kim ES, Im JA, Park JH, Lee MK, Lee SH, Suh SH, Chu SH, Kang ES, Lee HC, Jeon JY. Interaction between fatness and fitness on CVD risk factors in Asian youth. Int J Sports Med 2009;30:733-40.
5. Lee CD, Blair SN, Jackson AS. Cardiorespiratory fitness, body composition, and all-cause and cardiovascular disease mortal- ity in men. Am J Clin Nutr 1999;69:373-80.
6. Wessel TR, Arant CB, Olson MB, Johnson BD, Reis SE, Sharaf BL, Shaw LJ, Handberg E, Sopko G, Kelsey SF, Pepine CJ, Merz NB. Relationship of physical fitness vs body mass index with coronary artery disease and cardiovascular events in women.
JAMA 2004;292:1179-87.
7. Carnethon MR, Gulati M, Greenland P. Prevalence and car- diovascular disease correlates of low cardiorespiratory fitness in adolescents and adults. JAMA 2005;294:2981-8.
8. Wei M, Kampert JB, Barlow CE, Nichaman MZ, Gibbons LW, Paffenbarger RS Jr, Blair SN. Relationship between low cardio- respiratory fitness and mortality in normal-weight, overweight, and obese men. JAMA 1999;282:1547-53.
9. Gordon BA, Benson AC, Bird SR, Fraser SF. Resistance train- ing improves metabolic health in type 2 diabetes: a systematic review. Diabetes Res Clin Pract 2009;83:157-75.
10. Lee DC, Koh MY, Kim YS, Gang HJ. Correlation between car- diorespiratory fitness measured by step test and Hba1C, blood pressure and blood lipids in type II diabetic patients. Korean J
Sport Sci 2006;17:28-36.
11. National Cholesterol Education Program/National Heart, Lung and Blood Institute/National Institute of Health. Third report of the Expert Panel on Detection, Evaluation, and Treat- ment of High Blood Cholesterol in Adults (Adult Treatment Panel III). Bethesda: National Heart, Lung and Blood Institute/
National Institute of Health; 2002.
12. Tan CE, Ma S, Wai D, Chew SK, Tai ES. Can we apply the Na- tional Cholesterol Education Program Adult Treatment Panel definition of the metabolic syndrome to Asians? Diabetes Care 2004;27:1182-6.
13. Jekal Y, Lee MK, Kim ES, Park JH, Lee HJ, Han SJ, Kang ES, Lee HC, Kim SH, Jeon JY. Effects of walking and physical ac- tivity on glucose regulation among type 2 diabetics. Korean Diabetes J 2008;32:60-7.
14. Church TS, Cheng YJ, Earnest CP, Barlow CE, Gibbons LW, Priest EL, Blair SN. Exercise capacity and body composition as predictors of mortality among men with diabetes. Diabetes Care 2004;27:83-8.
15. Church TS, LaMonte MJ, Barlow CE, Blair SN. Cardiorespira- tory fitness and body mass index as predictors of cardiovascu- lar disease mortality among men with diabetes. Arch Intern Med 2005;165:2114-20.
16. McAuley PA, Myers JN, Abella JP, Tan SY, Froelicher VF. Exer- cise capacity and body mass as predictors of mortality among male veterans with type 2 diabetes. Diabetes Care 2007;30:
1539-43.
17. Jee SH, Sull JW, Park J, Lee SY, Ohrr H, Guallar E, Samet JM.
Body-mass index and mortality in Korean men and women. N Engl J Med 2006;355:779-87.
18. Katzmarzyk PT, Church TS, Janssen I, Ross R, Blair SN. Meta- bolic syndrome, obesity, and mortality: impact of cardiorespi- ratory fitness. Diabetes Care 2005;28:391-7.
19. Sui X, Hooker SP, Lee IM, Church TS, Colabianchi N, Lee CD, Blair SN. A prospective study of cardiorespiratory fitness and risk of type 2 diabetes in women. Diabetes Care 2008;31:550-5.
20. Adams GM. Exercise physiology laboratory manual. Boston:
WCB/McGraw-Hill; 1990.
21. Montoye HJ. Physical activity and health: an epidemiologic study of an entire community. Englewood Cliffs: Prentice Halls;
1975.
22. Chen CN, Chuang LM, Wu YT. Clinical measures of physical fitness predict insulin resistance in people at risk for diabetes.
Phys Ther 2008;88:1355-64.