THE KOREAN JOURNAL OF HEMATOLOGY O R I G I N A L A R T I C L E
Serum hepcidin levels and iron parameters in children with iron deficiency
Hyoung Soo Choi
1, Sang Hoon Song
2, Jae Hee Lee
3, Hee-Jin Kim
4, Hye Ran Yang
11Department of Pediatrics, Seoul National University Bundang Hospital, Seoul National University College of Medicine, Seongnam,
2Department of Laboratory Medicine, Seoul National University Hospital, Seoul National University College of Medicine, Seoul,
3Department of Pediatrics, Chosun University Hospital, Gwangju, 4Department of Laboratory Medicine & Genetics, Samsung Medical Center, Sungkyunkwan University School of Medicine, Seoul, Korea
p-ISSN 1738-7949 / e-ISSN 2092-9129 http://dx.doi.org/10.5045/kjh.2012.47.4.286 Korean J Hematol 2012;47:286-92.
Received on October 2, 2012 Revised on October 31, 2012 Accepted on November 16, 2012
Background
Iron deficiency (ID) and iron deficiency anemia (IDA) are common nutritional disorders in children. Hepcidin, a peptide hormone produced in the liver, is a central regulator of systemic iron metabolism. We evaluated whether serum hepcidin levels can diagnose ID in children.
Methods
Sera from 59 children (23 males and 36 females; 5 months to 17 years) were analyzed for hepcidin-25 by ELISA. Patients were classified according to hemoglobin level and iron parameters as: IDA, (N=17), ID (N=18), and control (N=24).
Results
Serum hepcidin, ferritin, soluble transferrin receptor (sTfR), transferrin saturation, and hemoglobin levels differed significantly between groups (P<0.0001). Serum hepcidin and ferritin levels (mean±SD) were 2.01±2.30 and 7.00±7.86, 7.72±8.03 and 29.35±
24.01, 16.71±14.74 and 46.40±43.57 ng/mL in the IDA, ID, and control groups, respectively. The area under the receiver operating characteristic curve for serum hepcidin as a predictor of ID was 0.852 (95% CI, 0.755‒0.950). Hepcidin ≤6.895 ng/mL had a sensitivity of 79.2% and specificity of 82.8% for the diagnosis of ID. Serum hepcidin levels were significantly correlated with ferritin, transferrin saturation, and hemoglobin levels and significantly negatively correlated with sTfR level and total iron binding capacity (P
<0.0001).
Conclusion
Serum hepcidin levels are significantly associated with iron status and can be a useful indicator of ID. Further studies are necessary to validate these findings and determine a reliable cutoff value in children.
Key Words Serum hepcidin, Iron deficiency, Children
*This study was supported by a grant from SNUBH Research Fund (Grant number:
11-2010-014).
Correspondence to Hye Ran Yang, M.D., Ph.D.
Department of Pediatrics, Seoul National University Bundang Hospital, 82, Gumi-ro 173 Beon-gil, Bundang-gu, Seongnam 463-707, Korea
Tel: +82-31-787-7285 Fax: +82-31-787-4054 E-mail: [email protected]
Ⓒ 2012 Korean Society of Hematology
INTRODUCTION
Iron deficiency (ID) and iron deficiency anemia (IDA) are common nutritional disorders in children that place chil- dren at risk of impaired psychomotor and/or mental develop- ment [1]. However, commonly used tests of iron status have limitations. Ferritin is an indicator of iron stores, but its levels are elevated in patients with coexisting inflammation.
Soluble transferring receptor (sTfR) levels reflect tissue ID, but they are influenced by erythropoietic activity [2]. In
addition, transferrin saturation level may be affected by in- flammation and undergoes diurnal variation [1].
Hepcidin-25, a 25-amino acid peptide hormone produced in the liver, is a central regulator of systemic iron metabolism [3, 4]. Hepcidin downregulates duodenal iron absorption and macrophage iron release by modulating cellular iron export via ferroportin [5]. The dysregulation of hepcidin production is associated with a variety of iron disorders [6].
Hepcidin deficiency is the cause of iron overload in heredi- tary hemochromatosis, while hepcidin excess is associated with anemia of inflammation, chronic kidney disease, and
iron-refractory iron deficiency anemia [6, 7].
Hepcidin levels are reduced in patients with ID. Therefore, measurement of blood or urine hepcidin levels may enable the determination of iron requirements and be an accurate indicator of physiological ID [4]. The use of serum hepcidin level as an index for ID has been tested in adult populations [8-11]. However, very few studies have investigated the ef- fectiveness of serum hepcidin measurements in children [12-14]. Furthermore, the sensitivities and specificities of various serum hepcidin cutoff levels in the diagnosis of ID have not been determined in either adults or children.
This study evaluated the use of serum hepcidin levels as a diagnostic test of ID in children. To this end, the correla- tions between serum hepcidin levels and other iron parame- ters were determined. The sensitivity and specificity of serum hepcidin as an indicator of ID were determined using receiver operating characteristic (ROC) curves.
MATERIALS AND METHODS
1. Subjects
In total, 59 children (23 males and 36 females) were en- rolled in this study. The age of the patients ranged from 5 months to 17 years (median, 4 years). Venous blood samples were drawn, and serum samples were frozen at -70oC until needed for the hepcidin-25 assay. The patients were classified according to hemoglobin level and iron parameters as follows:
Group 1, IDA (N=17); Group 2, ID without anemia (N=18), and Group 3, controls with normal iron levels (N=24).
2. Iron parameters
Serum was analyzed for ferritin, iron, total iron binding capacity (TIBC), transferrin saturation (Iron/TIBC), and C-reactive protein (CRP) levels. sTfR level was measured by a competitive ELISA (C-ELISA) (R&D Systems, Inc., Minneapolis, MN, USA). ID was defined as serum ferritin
<12 ng/mL in children aged ≤5 years or <15 ng/mL in children >5 years, or as transferrin saturation <16% [1].
IDA was defined as a significantly reduced hemoglobin level and decreased mean corpuscular volume (MCV) with ID [1].
3. Serum hepcidin measurement
Serum hepcidin-25 levels were measured by a C-ELISA using a commercial kit from Peninsula Laboratories (Bachem, Torrance, CA, USA) as described previously [15, 16]. Patients’
samples were assayed in duplicate. The results from the C-ELISA were compared with those of the standard curves developed from calibrators run simultaneously with study samples.
4. Statistical analysis
SPSS version 19 was used for data analysis. All values are expressed as mean±SD. The differences between study groups were tested by the nonparametric Kruskal-Wallis test. Correlations between variables were calculated using
Pearson’s correlation analysis for numerical data. The diag- nostic utility of serum hepcidin level as a test for ID was evaluated according to the area under the ROC curve (AUC).
For Pearson’s correlation and linear regression modeling, the log-transformed values of hepcidin and ferritin were used to stabilize variances and satisfy normality assumptions.
Linear regression analyses were used to evaluate the effects of age-, gender-, and body mass index (BMI)-adjusted in- dependent variables on log hepcidin levels as continuous dependent variables. The level of significance was set at P<0.05.
5. Ethics
Informed consent was obtained from all subjects and/or their guardians. This study was approved by the Institutional Review Board of the Seoul National University Bundang Hospital.
RESULTS
1. Study population characteristics
The characteristics of the 59 subjects enrolled in this study are shown in Table 1. There were no significant differences in the clinical characteristics between the 3 groups with respect to age, gender, or BMI (P>0.05). In addition, CRP level, time of sampling, and the proportion of the patients with Helicobacter pylori infection did not significantly differ between groups.
2. Hematologic data and iron parameters
There were significant differences in the levels of serum hepcidin, ferritin, sTfR, iron, transferrin, transferrin satu- ration, and hemoglobin between the 3 groups (P<0.0001, Kruskal-Wallis test). Serum hepcidin levels in Group 1 (2.01±2.30; range, 0.40–5.30 ng/mL) and Group 2 (7.72±8.03;
range, 1.26–23.37 ng/mL) were significantly lower than that in Group 3 (16.71±14.74; range, 3.24–66.86 ng/mL) (Table 1).
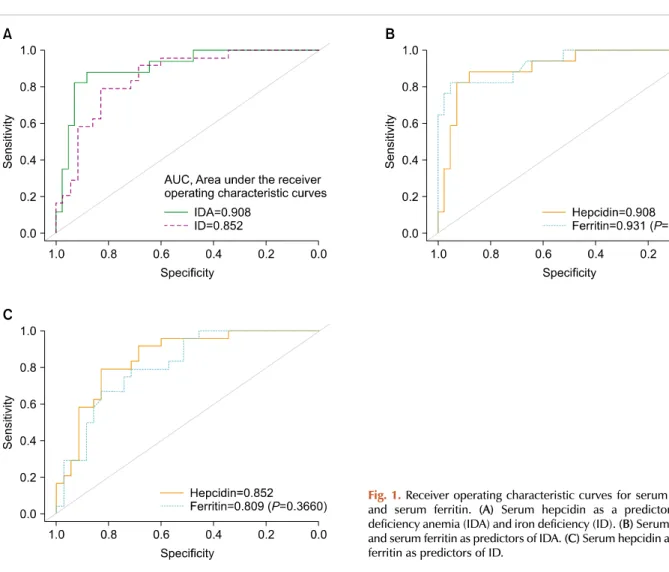
3. Serum hepcidin level as an indicator of ID and IDA The ROC curves for serum hepcidin and serum ferritin as predictors of ID and IDA are shown in Fig. 1. The AUC of serum hepcidin was 0.852 (95% CI, 0.755–0.950) for Group 2 and 0.908 (95% CI, 0.824–0.991) for Group 1. The AUC of serum ferritin was 0.809 (95% CI, 0.700–0.918) for Group 2 (ID group) and 0.931 (95% CI, 0.857–1.000) for Group 1 (IDA group); the AUC values for serum ferritin in the 2 groups did not significantly differ from those for serum hepcidin (P=0.3660 and P=0.6845, respectively). A scatter plot of the distribution of serum hepcidin levels around the cutoff point in the 3 groups is shown in Fig. 2. Serum hepcidin ≤6.895 ng/mL had a sensitivity of 79.2% and specif- icity of 82.8% for Group 2. Meanwhile, serum hepcidin
≤2.735 ng/mL had a sensitivity of 88.1% and specificity of 88.2% for Group 1.
Table 1. Subject characteristics.
Group 1 (N=17) Group 2 (N=18) Group 3 (N=24) P
Age (months) 101.2±70.34 52.83±52.94 67.25±58.01 0.127
Male/female 7/10 8/10 8/16 0.747
BMI (kg/m2) 16.80±5.10 17.17±3.03 15.84±4.48 0.258
Hepcidin (ng/mL) 2.01±2.30 7.72±8.03 16.71±14.74 <0.0001
Ferritin (ng/mL) 7.00±7.86 29.35±24.01 46.40±43.57 <0.0001
sTfR (nmol/L) 4.63±22.67 35.16±11.59 27.25±10.63 <0.0001
Transferrin saturation (%) 4.44±2.67 11.87±6.02 23.80±9.48 <0.0001
Iron (μg/dL) 20.18±11.90 45.61±18.72 82.29±28.31 <0.0001
TIBC (μg/dL) 466.41±66.17 395.28±48.62 342.38±103.48 <0.0001
Hb (g/dL) 8.26±1.78 12.26±0.98 12.76±1.05 <0.0001
CRP (mg/dL) 0.13±0.22 0.16±0.46 0.19±0.48 0.566
Time of sampling (1/2/3) 10/6/1 9/6/3 10/13/1 0.403
H. pylori (yes/no) 3/14 1/17 0/24 0.084
Time of sampling (1/2/3): 1, before midday; 2, midday to 5 pm; 3, after 5 pm.
Abbreviations: BMI, body mass index; sTfR, soluble transferrin receptor; TIBC, total iron binding capacity; Hb, hemoglobin; CRP, C-reactive protein; H. pylori, Helicobacter pylori.
Fig. 1. Receiver operating characteristic curves for serum hepcidin and serum ferritin. (A) Serum hepcidin as a predictor of iron deficiency anemia (IDA) and iron deficiency (ID). (B) Serum hepcidin and serum ferritin as predictors of IDA. (C) Serum hepcidin and serum ferritin as predictors of ID.
4. Factors associated with serum hepcidin levels
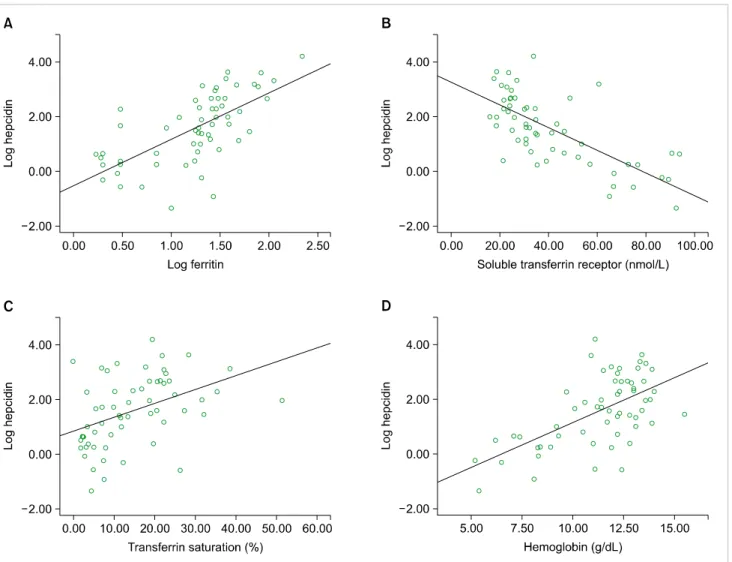
Serum hepcidin levels were significantly positively corre- lated with the levels of ferritin, iron, transferrin saturation, and hemoglobin (P<0.05) (Table 2). Meanwhile, serum hep- cidin levels were significantly negatively correlated with
sTfR and TIBC (P<0.0001) (Table 2). Among these parame- ters, log ferritin showed the strongest positive correlation with log hepcidin (P<0.0001) (Fig. 3). Three IDA patients and 1 ID patient with H. pylori infection showed compatible low serum hepcidin levels. Adjusted linear regression analy-
Fig. 2. Distribution of serum hepcidin levels in the IDA, ID, and normal controls around the cutoff point. IDA, iron deficiency anemia; ID, iron deficiency.
Table 2. Correlations between log hepcidin and other parameters.
r P
Age -0.204 0.121
Gender -0.073 0.584
BMI -0.103 0.436
Ferritin 0.602 <0.0001
Log ferritin 0.666 <0.0001
sTfR -0.712 <0.0001
Transferrin saturation 0.429 0.001
Iron 0.366 0.004
TIBC -0.563 <0.0001
Hb 0.604 <0.0001
CRP 0.185 0.161
Time of sampling 0.091 0.492
Relapse -0.265 0.043
H. pylori infection -0.284 0.029
Abbreviations: BMI, body mass index; sTfR, soluble transferrin receptor; TIBC, total iron binding capacity; Hb, hemoglobin; CRP, C-reactive protein; H. pylori, Helicobacter pylori.
Fig. 3. Correlations between serum hepcidin and other parameters. Common regression lines are shown. (A) Log-transformed serum hepcidin and log-transformed ferritin (r=0.666). (B) Log-transformed serum hepcidin and soluble transferrin receptor (r=-0.712). (C) Log-transformed serum hepcidin and transferrin saturation (r=0.429). (D) Log-transformed serum hepcidin and hemoglobin (r=0.604).
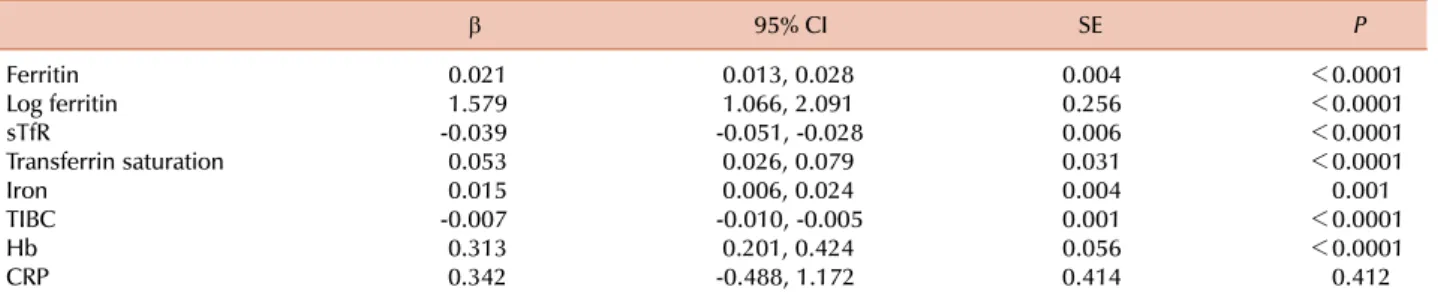
Table 3. Adjusteda) simple linear regression for log hepcidin.
β 95% CI SE P
Ferritin 0.021 0.013, 0.028 0.004 <0.0001
Log ferritin 1.579 1.066, 2.091 0.256 <0.0001
sTfR -0.039 -0.051, -0.028 0.006 <0.0001
Transferrin saturation 0.053 0.026, 0.079 0.031 <0.0001
Iron 0.015 0.006, 0.024 0.004 0.001
TIBC -0.007 -0.010, -0.005 0.001 <0.0001
Hb 0.313 0.201, 0.424 0.056 <0.0001
CRP 0.342 -0.488, 1.172 0.414 0.412
a)Adjusted for age, gender, and body mass index.
Abbreviations: sTfR, soluble transferrin receptor; TIBC, total iron binding capacity; Hb, hemoglobin; CRP, C-reactive protein; CI, confidence interval; SE, standard error.
ses demonstrated that log hepcidin was positively associated with ferritin, iron, transferrin saturation, and hemoglobin and negatively associated with sTfR and TIBC (Table 3).
DISCUSSION
Since its discovery, many clinical applications for hepcidin measurement have been proposed, including its use in the diagnosis of anemia of inflammation, anemia associated with chronic kidney disease and hemodialysis, genetic hemochro- matosis, and ID [10]. However, how hepcidin measurements complement the existing array of iron indices remains un- clear [10].
Hepcidin is encoded as an 84-amino acid prepropeptide [17], which is cleaved to yield the 60-amino acid form called prohepcidin, which is further processed to yield the 25-amino acid form of hepcidin [17]. Previous studies investigating the use of prohepcidin as a marker for ID failed to find significant correlations between prohepcidin level and iron measurements in children [18, 19]. However, levels of the mature bioactive form of hepcidin-25 are correlated with iron status and erythropoiesis [20].
Immunochemical and mass spectrometric assays are avail- able to measure the levels of hepcidin in serum, plasma, and urine; moreover, an international effort is underway to standardize these assays [7, 21]. A comparative study of different assays for hepcidin analysis found that although the absolute values of the results in each laboratory differ significantly, the results of samples within a given laboratory are well correlated between assays and analytical variance is generally low [21]. The development of reference hepcidin preparations would enable inter-laboratory comparison of assays and the standardization of units and reference ranges, facilitating the clinical use of a hepcidin index [21, 22].
This study evaluated the value of serum hepcidin levels as a diagnostic test for ID and IDA in children. Serum hepci- din levels measured by C-ELISA were significantly lower in children with ID and IDA than that in children in the normal control group and were more profoundly reduced in IDA. Furthermore, serum hepcidin levels were correlated with iron status in all groups. Positive correlations were
found between serum hepcidin level and serum ferritin, iron, transferrin saturation, and hemoglobin; conversely, negative correlations were found with sTfR and TIBC. Among these parameters, log ferritin was most strongly positively corre- lated with log hepcidin. These results are concordant with those of previous reports [23, 24], indicating that urinary hepcidin is positively associated with hemoglobin, MCV, iron, ferritin, and transferrin saturation. Another study [12]
reports similar results with serum hepcidin from cord blood.
The mean serum hepcidin level in normal control children in this study was 16.71±14.74 ng/mL. Mean serum hepcidin levels were significantly lower in the ID (7.72±8.03 ng/mL) and IDA groups (2.01±2.30 ng/mL). Low serum hepcidin in ID and IDA can be attributed to the lower total iron stores in these groups than that in the normal controls [13].
Serum hepcidin levels in this study were lower than the reference range reported in healthy male and female adults (median and 5–95% reference range, 112 ng/mL [29–254 ng/mL] for men and 65 ng/mL [17–286 ng/mL] for women) [8]. In addition, the reference range in 137 neonate cord blood hepcidin samples was 20.5–231.9 ng/mL (median, 78.4 ng/mL) [12], which is higher than that in the present study.
Therefore, it is necessary to establish a reference range of serum hepcidin levels for children other than neonates.
We determined 2 cutoff points for serum hepcidin to differentiate children with ID and IDA from normal controls.
These 2 cutoff points had narrow confidence intervals and favorable predictive potentials. Hepcidin ≤2.735 ng/mL had a sensitivity of 88.1% and specificity of 88.2% for diagnosing IDA. Meanwhile, hepcidin ≤6.895 ng/mL had a sensitivity of 79.2% and specificity of 82.8% for diagnosing ID. In 261 premenopausal female blood donors (with a 95% reference range of serum hepcidin levels from 8.2–199.7 ng/mL), serum hepcidin <8 ng/mL had a sensitivity of 41.5% and specificity of 97.6% for diagnosing ID, while <18 ng/mL had a sensi- tivity of 79.2% and specificity of 85.6% [10]. More studies are required to determine a reliable cutoff value of serum hepcidin in ID.
In general, while AUC values ≤0.75 are not clinically useful, AUC values ≥0.97 have high clinical value; these values correspond to likelihood ratios of approximately 10 and 0.1, respectively [25]. The AUC of serum hepcidin for
the detection of IDA is reported to be 0.89 in non-anemic female blood donors [10]. Meanwhile, the AUC for serum hepcidin in the present study was 0.852 for the detection of ID and 0.908 for the detection of IDA, demonstrating moderate discriminatory power. These values are comparable to the AUC of serum ferritin determined in the present and previous studies [26, 27]. Therefore, the results suggest serum hepcidin has potential utility as a diagnostic test for ID in children.
Hepcidin production is induced by inflammation and iron overload and is suppressed in patients with ID, hypoxia, anemia, and conditions characterized by increased eryth- ropoietic activity [2, 7]. Serum hepcidin levels are positively correlated with CRP levels [12]. Patients with signs of in- fection or inflammation were excluded from the present study. Therefore, we did not find a significant correlation between serum hepcidin and CRP levels. Four patients in the present study with H. pylori infection had IDA or ID and compatible low serum hepcidin levels. These results are concordant with those of Cherian et al. [23], who report no differences in the urinary hepcidin levels of children regardless of H. pylori seropositivity. One possible ex- planation for this is that H. pylori-induced inflammation does not affect iron status via increased hepcidin production in children [23]. Therefore, it is necessary to evaluate the value of serum hepcidin for diagnosing ID under inflam- matory conditions. Patients with anemia of inflammation and IDA have significantly lower hepcidin levels than pa- tients with only anemia of inflammation [9, 28].
Hepcidin levels can be measured in the serum, plasma, and urine. Initial studies investigating the role of hepcidin in iron pathophysiology used urinary hepcidin assays for technical reasons [8]. The urinary hepcidin assay provides an indirect measure of the circulating hormone level and allows development of a potential non-invasive means for diagnosing ID, which could be particularly useful for children [13, 23, 24]. However, the higher pre-analytical variability associated with urine specimens compared to serum is a potential limitation of this approach [29]. Further evaluation of urine hepcidin for non-invasive monitoring of iron status in children is necessary.
Diurnal variation is a potential limitation of the use of serum hepcidin levels for diagnostic tests [29, 30]. Serum hepcidin levels exhibit diurnal variations similar to those of serum iron levels, with levels at noon and 8 pm being significantly higher than those at 8 am [8]. However, we did not identify a significant difference in serum hepcidin levels between samples taken in the morning and afternoon.
The small number of subjects analyzed is a limitation of this study. The cutoff values of serum hepcidin for diagnos- ing ID determined in the present study should be confirmed in studies with larger sample sizes. However, to our knowl- edge, this is the first trial to determine a cutoff level for serum hepcidin level for the diagnosis of ID in children.
In conclusion, serum hepcidin levels are significantly asso- ciated with iron status in children, and could be useful in- dicators of ID. Further studies are necessary to confirm the
value of serum hepcidin measurement in the diagnosis of ID and to determine the reliable reference range and cutoff values in children.
ACKNOWLEDGMENTS
The authors thank the participating subjects and their families. The authors also thank Dr. Ahn SY and Dr. Lee JH for their assistance with statistical analysis.
REFERENCES
1. Zimmermann MB, Hurrell RF. Nutritional iron deficiency.
Lancet 2007;370:511-20.
2. Kroot JJ, Tjalsma H, Fleming RE, Swinkels DW. Hepcidin in human iron disorders: diagnostic implications. Clin Chem 2011;57:1650-69.
3. Ganz T. Hepcidin, a key regulator of iron metabolism and mediator of anemia of inflammation. Blood 2003;102:783-8.
4. Kemna EH, Tjalsma H, Willems HL, Swinkels DW. Hepcidin:
from discovery to differential diagnosis. Haematologica 2008;93:
90-7.
5. Nemeth E, Tuttle MS, Powelson J, et al. Hepcidin regulates cellular iron efflux by binding to ferroportin and inducing its internaliz- ation. Science 2004;306:2090-3.
6. Nemeth E, Ganz T. The role of hepcidin in iron metabolism. Acta Haematol 2009;122:78-86.
7. Ganz T. Hepcidin and iron regulation, 10 years later. Blood 2011;117:4425-33.
8. Ganz T, Olbina G, Girelli D, Nemeth E, Westerman M. Immuno- assay for human serum hepcidin. Blood 2008;112:4292-7.
9. Lasocki S, Baron G, Driss F, et al. Diagnostic accuracy of serum hepcidin for iron deficiency in critically ill patients with anemia.
Intensive Care Med 2010;36:1044-8.
10. Pasricha SR, McQuilten Z, Westerman M, et al. Serum hepcidin as a diagnostic test of iron deficiency in premenopausal female blood donors. Haematologica 2011;96:1099-105.
11. Thomas C, Kobold U, Thomas L. Serum hepcidin-25 in com- parison to biochemical markers and hematological indices for the differentiation of iron-restricted erythropoiesis. Clin Chem Lab Med 2011;49:207-13.
12. Rehu M, Punnonen K, Ostland V, et al. Maternal serum hepcidin is low at term and independent of cord blood iron status. Eur J Haematol 2010;85:345-52.
13. Müller KF, Lorenz L, Poets CF, Westerman M, Franz AR. Hepcidin concentrations in serum and urine correlate with iron homeo- stasis in preterm infants. J Pediatr 2012;160:949-53.e2.
14. Wu TW, Tabangin M, Kusano R, Ma Y, Ridsdale R, Akinbi H. The utility of serum hepcidin as a biomarker for late-onset neonatal sepsis. J Pediatr 2012 [Epub ahead of print].
15. Brătescu LO, Bârsan L, Munteanu D, Stancu S, Mircescu G. Is hepcidin-25 a clinically relevant parameter for the iron status in hemodialysis patients? J Ren Nutr 2010;20(5 Suppl):S77-83.
16. Prentice AM, Doherty CP, Abrams SA, et al. Hepcidin is the major predictor of erythrocyte iron incorporation in anemic African
children. Blood 2012;119:1922-8.
17. Park CH, Valore EV, Waring AJ, Ganz T. Hepcidin, a urinary antimicrobial peptide synthesized in the liver. J Biol Chem 2001;276:7806-10.
18. Yapakçi E, Ecevit A, Gökmen Z, Tarcan A, Ozbek N. Erythrocyte transfusions and serum prohepcidin levels in premature newborns with anemia of prematurity. J Pediatr Hematol Oncol 2009;31:840-2.
19. Tiker F, Celik B, Tarcan A, Kilicdag H, Ozbek N, Gurakan B. Serum pro-hepcidin levels and relationships with iron parameters in healthy preterm and term newborns. Pediatr Hematol Oncol 2006;23:293-7.
20. Frazer DM, Anderson GJ. Hepcidin compared with prohepcidin:
an absorbing story. Am J Clin Nutr 2009;89:475-6.
21. Kroot JJ, Kemna EH, Bansal SS, et al. Results of the first international round robin for the quantification of urinary and plasma hepcidin assays: need for standardization. Haematologica 2009;94:1748-52.
22. Galesloot TE, Vermeulen SH, Geurts-Moespot AJ, et al. Serum hepcidin: reference ranges and biochemical correlates in the general population. Blood 2011;117:e218-25.
23. Cherian S, Forbes DA, Cook AG, et al. An insight into the relationships between hepcidin, anemia, infections and inflam-
matory cytokines in pediatric refugees: a cross-sectional study.
PLoS One 2008;3:e4030.
24. Sanad M, Gharib AF. Urinary hepcidin level as an early predictor of iron deficiency in children: A case control study. Ital J Pediatr 2011;37:37.
25. Fan J, Upadhye S, Worster A. Understanding receiver operating characteristic (ROC) curves. CJEM 2006;8:19-20.
26. Guyatt GH, Oxman AD, Ali M, Willan A, McIlroy W, Patterson C. Laboratory diagnosis of iron-deficiency anemia: an overview.
J Gen Intern Med 1992;7:145-53.
27. Punnonen K, Irjala K, Rajamäki A. Serum transferrin receptor and its ratio to serum ferritin in the diagnosis of iron deficiency. Blood 1997;89:1052-7.
28. Theurl I, Aigner E, Theurl M, et al. Regulation of iron homeostasis in anemia of chronic disease and iron deficiency anemia: dia- gnostic and therapeutic implications. Blood 2009;113:5277-86.
29. Kroot JJ, Hendriks JC, Laarakkers CM, et al. (Pre)analytical imprecision, between-subject variability, and daily variations in serum and urine hepcidin: implications for clinical studies. Anal Biochem 2009;389:124-9.
30. Nemeth E. Targeting the hepcidin-ferroportin axis in the dia- gnosis and treatment of anemias. Adv Hematol 2010;2010:750643.