Endocrinol Metab 2016;31:320-327
http://dx.doi.org/10.3803/EnM.2016.31.2.320 pISSN 2093-596X · eISSN 2093-5978
Original Article
C-Peptide-Based Index Is More Related to Incident Type 2 Diabetes in Non-Diabetic Subjects than Insulin-Based
Index
Jong-Dai Kim1, Sung Ju Kang1, Min Kyung Lee2, Se Eun Park3, Eun Jung Rhee3, Cheol-Young Park3, Ki-Won Oh3, Sung-Woo Park3, Won-Young Lee3
1Division of Endocrinology, Department of Internal Medicine, Konyang University Hospital, Konyang University College of Medicine, Daejeon; 2Division of Endocrinology, Department of Internal Medicine, Myongji Hospital, Seonam University College of Medicine, Goyang; 3Division of Endocrinology and Metabolism, Department of Internal Medicine, Kangbuk Samsung Hospital, Sungkyunkwan University School of Medicine, Seoul, Korea
Background: Diabetes can be efficiently prevented by life style modification and medical therapy. So, identification for high risk subjects for incident type 2 diabetes is important. The aim of this study is to identify the best β-cell function index to identify high risk subjects in non-diabetic Koreans.
Methods: This is a retrospective longitudinal study. Total 140 non-diabetic subjects who underwent standard 2-hour 75 g oral glucose tolerance test from January 2007 to February 2007 at Kangbuk Samsung Hospital and followed up for more than 1 year were analyzed (mean follow-up, 54.9±16.4 months). The subjects were consist of subjects with normal glucose tolerance (n=44) and subjects with prediabetes (n=97) who were 20 years of age or older. Samples for insulin and C-peptide levels were obtained at 0 and 30 minutes at baseline.
Results: Thirty subjects out of 140 subjects (21.4%) developed type 2 diabetes. When insulin-based index and C-peptide-based index are compared between progressor and non-progressor to diabetes, all C-peptide-based indices were statistically different between two groups, but only insulinogenic index and disposition index among insulin-based index were statistically different.
C-peptide-based index had higher value of area under receiver operating characteristic curve (AROC) value than that of insulin- based index. “C-peptidogenic” index had highest AROC value among indices (AROC, 0.850; 95% confidence interval, 0.761 to 0.915). C-peptidogenic index had significantly higher AROC than insulinogenic index (0.850 vs. 0.731 respectively; P=0.014).
Conclusion: C-peptide-based index was more closely related to incident type 2 diabetes in non-diabetic subjects than insulin- based index.
Keywords: Glucose tolerance test; C-peptide; Insulin secretion and incident diabetes
Received: 14 March 2016, Revised: 7 May 2016, Accepted: 16 May 2016 Corresponding author: Won-Young Lee
Division of Endocrinology and Metabolism, Department of Internal Medicine, Kangbuk Samsung Hospital, Sungkyunkwan University School of Medicine, 29 Saemunan-ro, Jongno-gu, Seoul 03181, Korea
Tel: +82-2-2001-2440, Fax: +82-2-2001-1578, E-mail: [email protected]
Copyright © 2016 Korean Endocrine Society
This is an Open Access article distributed under the terms of the Creative Com- mons Attribution Non-Commercial License (http://creativecommons.org/
licenses/by-nc/4.0/) which permits unrestricted non-commercial use, distribu- tion, and reproduction in any medium, provided the original work is properly cited.
INTRODUCTION
The number of subjects with type 2 diabetes and prediabetes is increasing [1]. Current prevalence of prediabetes in Koreans aged over 30 years or older is 19.3% [2]. Up to 50% of predia- betes can progress into diabetes within 10 years [3].
Patients with type 2 diabetes have higher mortality and mor- bidity compared to those without diabetes [4]. Once diabetes is diagnosed, β-cell function is usually declined [5]. So prevent- ing diabetes is important. Even if it failed to prevent diabetes, delaying the onset of diabetes is also of value. As the develop- ment of microvascular complication is also dependent on dura- tion of diabetes [6], delaying the onset of diabetes as late as possible is important to prevent microvascular complications.
Accurate identification of high risk subjects is important, since diabetes can be prevented through life style intervention or medication [7]. Abdul-Ghani et al. [8] reported that oral dis- position index calculated by using insulin during oral glucose tolerance test (OGTT) is the best predictor for future develop- ment of diabetes in non-diabetic subjects.
Whereas considerable portion of insulin that is released into portal vein from pancreatic islets is cleared by liver at first pass transit, C-peptide that almost always is co-secreted with insulin at same molecules, is not cleared by liver [9]. So, we hypothe- sized that C-peptide-based index would be more accurately re- flects β-cell function. The aim of this study is to compare insu- lin based index with C-peptide-based index for prediction of incident type 2 diabetes in Korean non-diabetic subjects.
METHODS
Subjects
The study population consisted of subjects who had undergone comprehensive health examinations and subsequently under- gone OGTT at the Kangbuk Samsung Hospital. All subjects were 20 years of age or older. After health examination, subjects who had fasting glucose equal to or higher than 100 mg/dL were referred to outpatient clinic at Department of Endocrinolo- gy of Kangbuk Samsung Hospital. They have undergone stan- dard 2-hour (2-h) 75 g OGTT from January 2007 to February 2007. Among them, total 140 subjects that were followed up for more than 1 year through outpatient clinics or annual health check-up at Kangbuk Samsung Hospital, so that we can identify progression to diabetes or not, were eligible for our analysis.
At baselines, subjects in whom OGTT results were satisfied to diabetes criteria and subjects who had a history of diabetes
or currently using insulin or oral anti-diabetic drugs based on self-report questionnaire, were excluded. Subjects who had malignancies, anemia, pregnancy, chronic kidney disease, or liver cirrhosis were also excluded. One hundred forty subjects included in this analysis were without diabetes at baseline (sub- jects with impaired fasting glucose, subjects with impaired glu- cose tolerance, and subjects with normal glucose tolerance).
The study was approved by the Institutional Review Board at Kangbuk Samsung Hospital. Informed consent requirement was waived because personal identifying information was not accessed.
Oral glucose tolerance test
Participants underwent a 2-h 75 g OGTT following a 10-hour overnight fast. Subjects ingested a solution containing 75 g of dextrose, and venous blood samples were obtained at 0, 30, and 120 minutes for the determination of plasma glucose level. Sam- ples for insulin and C-peptide were obtained at 0 and 30 minutes.
Anthropometric and laboratory measurements
Height, weight, and waist circumferences were measured.
Body mass index (kg/m2) was calculated as body weight in ki- lograms divided by height in meters squared. Blood pressures were measured using a sphygmomanometer (Vital Signs Moni- tor 300 series, Welch Allyn Inc., Skaneateles Falls, NY, USA) after at least 5 minutes of rest. Blood samples were collected following an overnight fast. Plasma glucose concentrations were determined using a Beckman glucose analyzer II (Beck- man Instruments, Fullerton, CA, USA). The assay coefficient of variation (CV) for glucose was <1.5%. Serum insulin levels were measured using an immunoradiometric assay (DIA- source, Nivells, Belgium) following the manufacturer’s recom- mendations. The intra-assay CV was 1.8% and the interassay CV was 6.3%. C-peptide was measured using a radioimmuno- assay method with a commercial kit (DIAsource). The intra-as- say CV was 6.5% and the interassay CV was 9.4%. Glycated hemoglobin (HbA1c) was measured using an immunoturbidi- metric assay with a Cobra Integra 800 automatic analyzer (Roche Diagnostics, Basel, Switzerland) with a reference value range of 4.4% to 6.4%. HbA1c measurements were standard- ized to the reference method aligned with the Diabetes Control and Complications Trial and the National Glycohemoglobin Standardization Program (NGSP) standards. The intra-assay CV was 2.3% and the interassay CV was 2.4%, both of which are within the NGSP acceptable range. Plasma lipids, including total cholesterol, triglyceride, high density lipoprotein choles-
terol (HDL-C), and low density lipoprotein cholesterol, were measured by enzymatic colorimetric assay (Siemens, Tarry- town, NY, USA). Serum high-sensitivity C-reactive protein (hs-CRP) levels were measured by nephelometric assay using a BNII nephelometer (Dade Behring, Deerfield, IL, USA).
Apolipoprotein B (apoB) and apoA-I levels were measured with the nephelometric method using a BNII system (Dade Behring Co., Marburg, Germany). Creatinine, alanine amino- transferase, γ-glutamyl transpeptidase, uric acid were measured by standard laboratory methods. All of the laboratory tests were undertaken at the same laboratory.
Assessment for the development of diabetes
The development of diabetes was assessed from the annual re-
cords of all participants or in each outpatient clinic visits. The development of diabetes was defined as fasting plasma glucose
≥126 mg/dL or HbA1c ≥6.5% or reporting to have developed diabetes in self-reported questionnaire at each visit. Subjects who had a history of diabetes or currently using insulin or oral anti-diabetic drugs based on annual check-up self-report ques- tionnaire at each visit were considered to have diabetes. Pro- gressor was defined as who developed incident type 2 diabetes.
Variables and calculation
(1) The homeostatic model assessment of insulin resistance (HOMA-IR) was calculated using the following formula [10]:
HOMA-IR=(fasting insulin [μIU/mL]×fasting glucose [mmol/
L])/22.5)
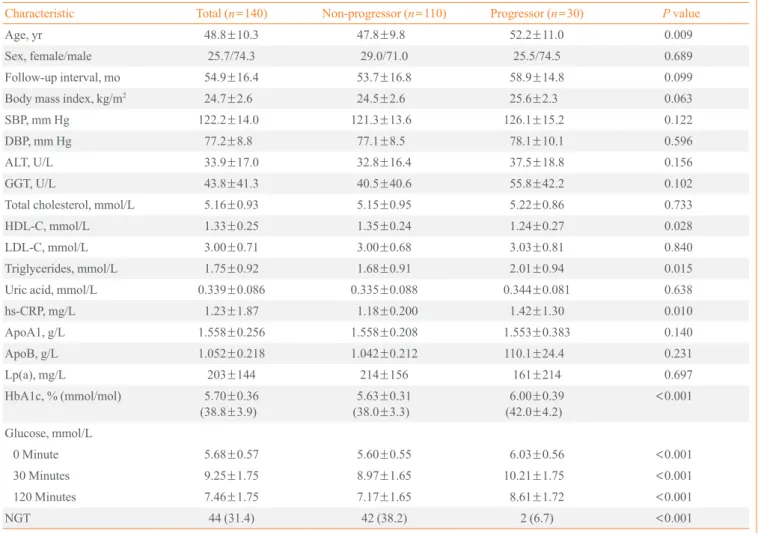
Table 1. Baseline Characteristics between Progressors and Non-Progressors to Diabetes
Characteristic Total (n=140) Non-progressor (n=110) Progressor (n=30) P value
Age, yr 48.8±10.3 47.8±9.8 52.2±11.0 0.009
Sex, female/male 25.7/74.3 29.0/71.0 25.5/74.5 0.689
Follow-up interval, mo 54.9±16.4 53.7±16.8 58.9±14.8 0.099
Body mass index, kg/m2 24.7±2.6 24.5±2.6 25.6±2.3 0.063
SBP, mm Hg 122.2±14.0 121.3±13.6 126.1±15.2 0.122
DBP, mm Hg 77.2±8.8 77.1±8.5 78.1±10.1 0.596
ALT, U/L 33.9±17.0 32.8±16.4 37.5±18.8 0.156
GGT, U/L 43.8±41.3 40.5±40.6 55.8±42.2 0.102
Total cholesterol, mmol/L 5.16±0.93 5.15±0.95 5.22±0.86 0.733
HDL-C, mmol/L 1.33±0.25 1.35±0.24 1.24±0.27 0.028
LDL-C, mmol/L 3.00±0.71 3.00±0.68 3.03±0.81 0.840
Triglycerides, mmol/L 1.75±0.92 1.68±0.91 2.01±0.94 0.015
Uric acid, mmol/L 0.339±0.086 0.335±0.088 0.344±0.081 0.638
hs-CRP, mg/L 1.23±1.87 1.18±0.200 1.42±1.30 0.010
ApoA1, g/L 1.558±0.256 1.558±0.208 1.553±0.383 0.140
ApoB, g/L 1.052±0.218 1.042±0.212 110.1±24.4 0.231
Lp(a), mg/L 203±144 214±156 161±214 0.697
HbA1c, % (mmol/mol) 5.70±0.36
(38.8±3.9) 5.63±0.31
(38.0±3.3) 6.00±0.39
(42.0±4.2)
<0.001 Glucose, mmol/L
0 Minute 5.68±0.57 5.60±0.55 6.03±0.56 <0.001
30 Minutes 9.25±1.75 8.97±1.65 10.21±1.75 <0.001
120 Minutes 7.46±1.75 7.17±1.65 8.61±1.72 <0.001
NGT 44 (31.4) 42 (38.2) 2 (6.7) <0.001
Values are expressed as mean±SD or number (%).
SBP, systolic blood pressure; DBP, diastolic blood pressure; ALT, alanine aminotransferase; GGT, γ-glutamyl transpeptidase; HDL-C, high density lipoprotein cholesterol; LDL-C, low density lipoprotein cholesterol; hs-CRP, high-sensitivity C-reactive protein; ApoA1, apolipoprotein A1; ApoB, apolipoprotein B; Lp(a), lipoprotein a; HbA1c, glycated hemoglobin; NGT, normal glucose tolerance.
(2) HOMA-IR by C-peptide was calculated using replacing in- sulin with C-peptide in HOMA-IR formula.
(3) Insulinogenic index was calculated using the following for- mula [11]: insulinogenic index=(insulin30min–insulin0min)/(glu- cose30min–glucose0min).
(4) C-peptidogenic index was calculated replacing insulin with C-peptide in insulinogenic index formula (we propose this term for formula that replace insulin with C-peptide in insulinogenic index formula).
(5) Oral disposition index (by insulin) was calculated as ratio of insulinogenic index to HOMA-IR.
(6) Oral disposition index based on C-peptide was calculated as ratio of C-peptidogenic index to HOMA-IR by C-peptide (we propose this term formula that replace insulin to C-peptide in oral disposition index formula).
Statistical analysis
Continuous variables are reported as mean±SD or median (95% confidence interval) if not normally distributed. Compar- isons of continuous variables between groups were performed using unpaired t test or Mann-Whitney U test. Categorical data are expressed as number (percentages) and were compared us- ing the chi-square test. Backward stepwise multivariate binary logistic regression analyses were performed in order to find the
risk factors for future development of type 2 diabetes. To com- pare the ability for predicting incident type 2 diabetes, we used area under the receiver operating characteristic curve (ROC), and then used the DeLong algorithm for determination of sta- tistical significance [12]. P<0.05 was considered statistically significant. All statistical analyses were performed using IBM PASW version 18.0 (IBM, Armonk, NY, USA) except for ROC curve analysis, which was performed using MedCalc for Win- dows version 12.5 (MedCalc Software, Ostend, Belgium).
RESULTS
Total 140 subjects were followed-up for 54.9±16.4 months.
During this period, 30 subjects (21.4%) developed type 2 dia- betes. Subjects who progressed to type 2 diabetes were older, showed higher triglyceride, lower HDL-C, and higher hs-CRP (Table 1). In multivariate regression analysis, age, glucose, in- sulin, and C-peptide-based parameters are independent predic- tor of incident type 2 diabetes (data were not shown).
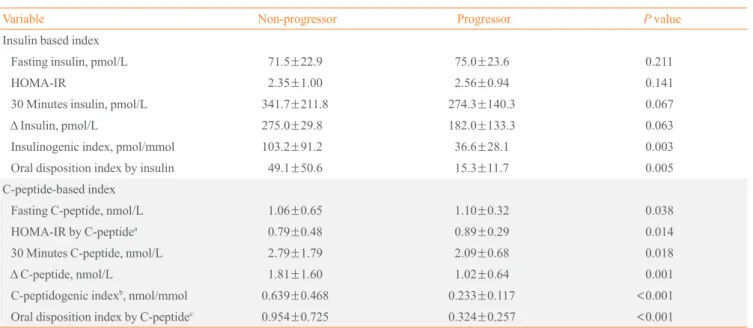
When insulin-based index and C-peptide-based index were compared between progressor and non-progressor, while all C- peptide-based index were statistically different between two groups, only insulinogenic index and disposition index as- sessed by insulin were statistically different among insulin-
Table 2. Comparison between Insulin Based Index and C-Peptide-Based Index for Diabetes Progression
Variable Non-progressor Progressor P value
Insulin based index
Fasting insulin, pmol/L 71.5±22.9 75.0±23.6 0.211
HOMA-IR 2.35±1.00 2.56±0.94 0.141
30 Minutes insulin, pmol/L 341.7±211.8 274.3±140.3 0.067
Δ Insulin, pmol/L 275.0±29.8 182.0±133.3 0.063
Insulinogenic index, pmol/mmol 103.2±91.2 36.6±28.1 0.003
Oral disposition index by insulin 49.1±50.6 15.3±11.7 0.005
C-peptide-based index
Fasting C-peptide, nmol/L 1.06±0.65 1.10±0.32 0.038
HOMA-IR by C-peptidea 0.79±0.48 0.89±0.29 0.014
30 Minutes C-peptide, nmol/L 2.79±1.79 2.09±0.68 0.018
Δ C-peptide, nmol/L 1.81±1.60 1.02±0.64 0.001
C-peptidogenic indexb, nmol/mmol 0.639±0.468 0.233±0.117 <0.001
Oral disposition index by C-peptidec 0.954±0.725 0.324±0.257 <0.001
Values are expressed as mean±SD.
HOMA-IR, homeostatic model assessment of insulin resistance.
aHOMA-IR by C-peptide=fasting glucose×fasting C-peptide/22.5; bC-peptidogenic index=(C-peptide30min–C-peptide0min)/(glucose30min–glucose0min);
cOral disposition index by C-peptide=C-peptidogenic index/HOMA-IR by C-peptide.
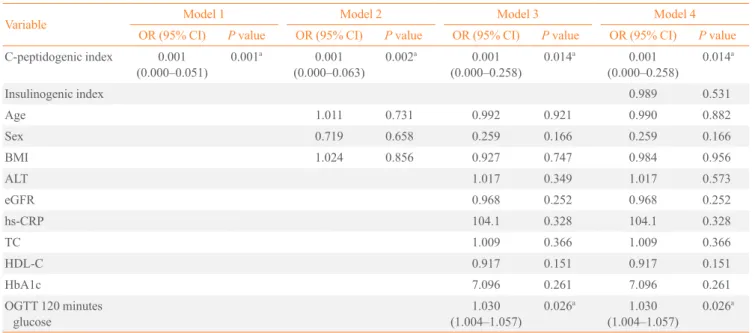
based indexes (Table 2). In multivariate binary logistic regres- sion analysis, C-peptidogenic index was independent predictor for incident type 2 diabetes even after adjusted for glucose pa- rameters (HbA1c, OGTT 120 minutes glucose, and insulino- genic index) (Table 3). In ROC curve analysis, C-peptide-based index had higher value of area under ROC curve (AROC) than insulin based index. C-peptidogenic index had highest AROC value among parameters. C-peptidogenic index had signifi-
cantly higher AROC than insulinogenic index (Table 4).
While insulin resistance indices based on insulin had no sig- nificant difference between two groups, all indices assessing insulin secretion (both insulin and C-peptide-based indices) had significant differences between the two groups (Table 2).
Also in ROC curve analysis, insulin resistance indices had lower AROC value than insulin secretion indices (Table 4).
Table 3. Multivariate Regression Analysis Results for Predicting Incident Diabetes in Nondiabetic Subjects
Variable Model 1 Model 2 Model 3 Model 4
OR (95% CI) P value OR (95% CI) P value OR (95% CI) P value OR (95% CI) P value C-peptidogenic index 0.001
(0.000–0.051) 0.001a 0.001
(0.000–0.063) 0.002a 0.001
(0.000–0.258) 0.014a 0.001
(0.000–0.258) 0.014a
Insulinogenic index 0.989 0.531
Age 1.011 0.731 0.992 0.921 0.990 0.882
Sex 0.719 0.658 0.259 0.166 0.259 0.166
BMI 1.024 0.856 0.927 0.747 0.984 0.956
ALT 1.017 0.349 1.017 0.573
eGFR 0.968 0.252 0.968 0.252
hs-CRP 104.1 0.328 104.1 0.328
TC 1.009 0.366 1.009 0.366
HDL-C 0.917 0.151 0.917 0.151
HbA1c 7.096 0.261 7.096 0.261
OGTT 120 minutes
glucose 1.030
(1.004–1.057) 0.026a 1.030
(1.004–1.057) 0.026a OR, odds ratio; CI, confidence interval; BMI, body mass index; ALT, alanine transferase; eGFR, estimated glomerular filtration rate; hs-CRP, high- sensitivity C-reactive protein; TC, total cholesterol; HDL-C, high density lipoprotein cholesterol; HbA1C, glycated hemoglobin; OGTT, oral glucose tolerance test.
aFor P<0.005.
Table 4. Comparison between Glycemic and β-Cell Function Markers Future Development of Type 2 Diabetes
Variable AROC 95% CI Cutoff Sensitivity, % Specificity, %
Fasting plasma glucose, mmol/L 0.756 0.673–0.828 5.66 60.9 76.7
30 Minutes glucose, mmol/L 0.734 0.639–0.815 9.27 64.4 75.0
120 Minutes glucose, mmol/L 0.782 0.691–0.856 7.77 66.4 70.0
HbA1c, % (mmol/mol) 0.789 0.699–0.862 5.9 (41.0) 86.4 56.7
HOMA-IR 0.641 0.542–0.732 2.818 79.5 47.6
HOMA-IR by C-peptide 0.705 0.608–0.789 0.997 85.4 52.4
Insulinogenic index, pmol/mol 0.731 0.629–0.817 30.4 68.8 61.1
C-peptidogenic index, nmol/mola 0.850 0.761–0.915 0.245 86.8 64.7
AROC, area under receiver operating characteristic curve; CI, confidence interval; HbA1c, glycated hemoglobin; HOMA-IR, homeostatic model as- sessment of insulin resistance.
aAROC comparison between insulinogenic index vs. C-peptidogenic index, P=0.014.
DISCUSSION
In this retrospective longitudinal study, insulin secretion defect was the major determinant for the progression to diabetes from prediabetes. C-peptidogenic index was more closely related to the progression to diabetes than insulinogenic index and other glucose parameters.
There were some reports that C-peptide-based indices were better indices than insulin based indices for the evaluation of pathophysiology of diabetes. Fasting C-peptide multiplied by fasting glucose was better associated with insulin resistance measured as hyperinsulinemic-euglycemic clamps than HOMA- IR [13]. Meier et al. [14] reported that C-peptide-based index was more closely correlated than insulin-based index with β-cell mass. Loopstra-Masters et al. [15] report that proinsulin- to-C-peptide ratio were stronger predictor of diabetes in com- parison with proinsulin-to-insulin ratios.
There are some hypothesis why C-peptide-based index is more closely related to diabetes progression in prediabetes.
First, C-peptide is may be better index because C-peptide doesn’t undergo hepatic extraction, so C-peptide may more ac- curately reflect pre-hepatic β-cell secretion. Pre-hepatic β-cell insulin secretion can be estimated by plasma C-peptide level [16,17]. Second, C-peptides have more steady clearance than insulin [16]. Insulin clearance is influenced by various factors.
In insulin resistant state, activity of insulin degrading enzyme is increased. Hepatic extraction of insulin is also increased in insulin resistance state [18]. Third, C-peptide has lower within- subject and between-subject variation than insulin, so C-pep- tides were more reproducible for the determination of β-cell function [19,20]. Fourth, recent research has revealed various action of C-peptide as a bioactive peptide. C-peptide can inhib- it nuclear factor κB, reduce reactive oxygen species, and acti- vate AMP-activated protein kinase [21-24]. C-peptide has the insulinomimetic effect and may also interact synergistically with insulin by disaggregating hexameric insulin into active monomeric form [9,25].
There are some differences and common points of our study with other studies. In Insulin Resistance Atherosclerosis Study prospective cohort study for non-diabetic subjects, C-peptide- to-proinsulin ratio was more stronger predictor for diabetes progression than insulin-to-proinsulin ratio [15]. Our study showed different results to that study in that we used stimulated C-peptide rather than basal C-peptide. So we could evaluated β-cell secretion function more accurately. Utzschneider et al.
[26] reported that oral disposition index based on insulin pre-
dicts the development of future diabetes above and beyond fast- ing and 2-h glucose levels in prospective cohort study for non- diabetic Japanese Americans, but this study did not measure C- peptide. In our study, C-peptidogenic index had more strong to predict future development of diabetes than insulinogenic in- dex. Also in our study, C-peptidogenic index was more closely related to future development of diabetes than fasting and 2-h glucose. In Japanese non-diabetic cohort study [27], similarly in our study, insulin secretion had a greater impact on the inci- dence of type 2 diabetes than insulin resistance. But that study did not compare insulin secretion index to glucose parameter.
We compared C-peptidogenic index to glucose parameters.
This is first report that C-peptide-based insulin secretion in- dex is better than insulin based insulin secretion index for pre- dicting diabetes progression in prediabetes. C-peptidogenic in- dex also had better value to traditional criteria for the diagnosis of prediabetes (0 minute glucose, 120 minutes glucose, and HbA1c) for the prediction of diabetes progression.
Our study has several limitations. Our study is not prospec- tive study and has relatively small sample size. Because we didn’t measure 60 minutes glucose in OGTT, we could not compare C-peptidogenic index to 60 minutes glucose that pre- viously reported as the best index for predicting diabetes. We did not have data for the family history of diabetes. So we could not adjust the data for it. In determining the progression to dia- betes, we did not check post prandial 2-h glucose or OGTT, we were only dependent on fasting plasma glucose, HbA1c and the questionnaire; thus, we have limitation in that we did not clear- ly diagnose new diabetes case during follow-up.
From this study, we could suggest that in Korean non-diabet- ic subjects, C-peptidogenic index was most strong predictor for future diabetes development. Validation of this finding is war- ranted in more large scale study, in other ethnic groups, and in prospective studies.
CONFLICTS OF INTEREST
No potential conflict of interest relevant to this article was re- ported.
ORCID
Jong-Dai Kim http://orcid.org/0000-0002-2606-3646 Won-Young Lee http://orcid.org/0000-0002-1082-7592
REFERENCES
1. International Diabetes Federation. IDF diabetes atlas. 6th ed. Brussels: International Diabetes Federation; 2013.
2. Jeon JY, Ko SH, Kwon HS, Kim NH, Kim JH, Kim CS, et al. Prevalence of diabetes and prediabetes according to fast- ing plasma glucose and HbA1c. Diabetes Metab J 2013;37:
349-57.
3. Gerstein HC, Santaguida P, Raina P, Morrison KM, Balion C, Hunt D, et al. Annual incidence and relative risk of dia- betes in people with various categories of dysglycemia: a systematic overview and meta-analysis of prospective stud- ies. Diabetes Res Clin Pract 2007;78:305-12.
4. Laakso M. Epidemiology of diabetic dyslipidemia. Diabe- tes Rev 1995;3:408-22.
5. Bagust A, Beale S. Deteriorating beta-cell function in type 2 diabetes: a long-term model. QJM 2003;96:281-8.
6. Writing Team for the Diabetes Control and Complications Trial/Epidemiology of Diabetes Interventions and Compli- cations Research Group. Effect of intensive therapy on the microvascular complications of type 1 diabetes mellitus.
JAMA 2002;287:2563-9.
7. Knowler WC, Barrett-Connor E, Fowler SE, Hamman RF, Lachin JM, Walker EA, et al. Reduction in the incidence of type 2 diabetes with lifestyle intervention or metformin. N Engl J Med 2002;346:393-403.
8. Abdul-Ghani MA, Williams K, DeFronzo RA, Stern M.
What is the best predictor of future type 2 diabetes? Diabe- tes Care 2007;30:1544-8.
9. Grunberger G, Qiang X, Li Z, Mathews ST, Sbrissa D, Shi- sheva A, et al. Molecular basis for the insulinomimetic ef- fects of C-peptide. Diabetologia 2001;44:1247-57.
10. Matthews DR, Hosker JP, Rudenski AS, Naylor BA,
Treacher DF, Turner RC. Homeostasis model assessment:
insulin resistance and beta-cell function from fasting plas- ma glucose and insulin concentrations in man. Diabetologia 1985;28:412-9.
11. Seltzer HS, Allen EW, Herron AL Jr, Brennan MT. Insulin secretion in response to glycemic stimulus: relation of de- layed initial release to carbohydrate intolerance in mild dia- betes mellitus. J Clin Invest 1967;46:323-35.
12. DeLong ER, DeLong DM, Clarke-Pearson DL. Comparing the areas under two or more correlated receiver operating characteristic curves: a nonparametric approach. Biometrics 1988;44:837-45.
13. Ohkura T, Shiochi H, Fujioka Y, Sumi K, Yamamoto N,
Matsuzawa K, et al. 20/(fasting C-peptide × fasting plasma glucose) is a simple and effective index of insulin resistance in patients with type 2 diabetes mellitus: a preliminary re- port. Cardiovasc Diabetol 2013;12:21.
14. Meier JJ, Menge BA, Breuer TG, Muller CA, Tannapfel A, Uhl W, et al. Functional assessment of pancreatic beta-cell area in humans. Diabetes 2009;58:1595-603.
15. Loopstra-Masters RC, Haffner SM, Lorenzo C, Wagen- knecht LE, Hanley AJ. Proinsulin-to-C-peptide ratio versus proinsulin-to-insulin ratio in the prediction of incident dia- betes: the Insulin Resistance Atherosclerosis Study (IRAS).
Diabetologia 2011;54:3047-54.
16. Van Cauter E, Mestrez F, Sturis J, Polonsky KS. Estimation of insulin secretion rates from C-peptide levels. Compari- son of individual and standard kinetic parameters for C- peptide clearance. Diabetes 1992;41:368-77.
17. Breda E, Cobelli C. Insulin secretion rate during glucose stimuli: alternative analyses of C-peptide data. Ann Biomed Eng 2001;29:692-700.
18. Hsieh SD, Kanazawa Y, Akanuma Y. Serum free C-peptide response to oral glucose loading as a parameter for the mon- itoring of pancreatic B-cell function in diabetic patients.
Diabetes Res Clin Pract 1985;1:109-14.
19. Gottsater A, Landin-Olsson M, Fernlund P, Gullberg B, Le- rnmark A, Sundkvist G. Pancreatic beta-cell function evalu- ated by intravenous glucose and glucagon stimulation. A comparison between insulin and C-peptide to measure in- sulin secretion. Scand J Clin Lab Invest 1992;52:631-9.
20. Utzschneider KM, Prigeon RL, Tong J, Gerchman F, Carr DB, Zraika S, et al. Within-subject variability of measures of beta cell function derived from a 2 h OGTT: implications for research studies. Diabetologia 2007;50:2516-25.
21. Luppi P, Cifarelli V, Tse H, Piganelli J, Trucco M. Human C-peptide antagonises high glucose-induced endothelial dysfunction through the nuclear factor-kappaB pathway.
Diabetologia 2008;51:1534-43.
22. Cifarelli V, Geng X, Styche A, Lakomy R, Trucco M, Luppi P. C-peptide reduces high-glucose-induced apoptosis of en- dothelial cells and decreases NAD(P)H-oxidase reactive oxygen species generation in human aortic endothelial cells. Diabetologia 2011;54:2702-12.
23. Bhatt MP, Lim YC, Hwang J, Na S, Kim YM, Ha KS. C- peptide prevents hyperglycemia-induced endothelial apop- tosis through inhibition of reactive oxygen species-mediat- ed transglutaminase 2 activation. Diabetes 2013;62:243-53.
24. Bhatt MP, Lim YC, Kim YM, Ha KS. C-peptide activates
AMPKα and prevents ROS-mediated mitochondrial fission and endothelial apoptosis in diabetes. Diabetes 2013;62:
3851-62.
25. Kubota M, Sato Y, Khookhor O, Ekberg K, Chibalin AV, Wahren J. Enhanced insulin action following subcutaneous co-administration of insulin and C-peptide in rats. Diabetes Metab Res Rev 2014;30:124-31.
26. Utzschneider KM, Prigeon RL, Faulenbach MV, Tong J,
Carr DB, Boyko EJ, et al. Oral disposition index predicts the development of future diabetes above and beyond fast- ing and 2-h glucose levels. Diabetes Care 2009;32:335-41.
27. Morimoto A, Tatsumi Y, Deura K, Mizuno S, Ohno Y, Mi- yamatsu N, et al. Impact of impaired insulin secretion and insulin resistance on the incidence of type 2 diabetes melli- tus in a Japanese population: the Saku study. Diabetologia 2013;56:1671-9.