• 검색 결과가 없습니다.

Birth Weight Predicts Anthropometric and Body Composition Assessment Results in Adults: A Population-Based Cross-Sectional Study

N/A
N/A
Protected

Academic year: 2021

Share "Birth Weight Predicts Anthropometric and Body Composition Assessment Results in Adults: A Population-Based Cross-Sectional Study"

Copied!
10
0
0

로드 중.... (전체 텍스트 보기)

전체 글

(1)

Birth Weight Predicts Anthropometric and Body Composition Assessment Results in Adults:

A Population-Based Cross-Sectional Study

Issa Al Salmi

1,2,

*, Suad Hannawi

3

1

Medicine Department, The Royal Hospital, Muscat;

2

Medicine Department, Oman Medical Specialty Board, Muscat, Oman;

3

Medicine Department, Ministry of Health and Prevention, Dubai, UAE

Background: A poor intrauterine environment is associated with increased risks of hypertension, chronic kid- ney disease, and/or diabetes. This study evaluated relationships between birth weight and body habitus in a representative sample of the general population.

Methods: Adult participants were asked to complete a birth weight questionnaire. Associations between vari- ous current anthropometric and body composition measurements and birth weight were investigated.

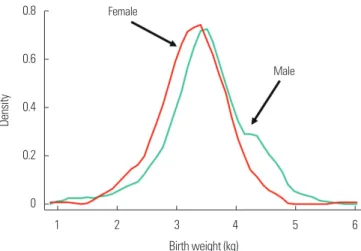
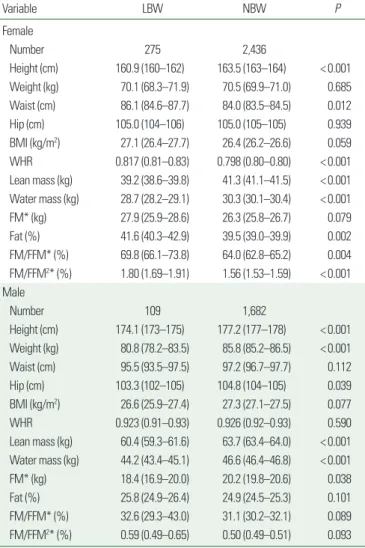
Results: Of 7,157 respondents, 4,502 reported their birth weight, which ranged from 0.4 to 7.0 kg with a mean and standard deviation of 3.37±0.7 kg; of these, 384 had low birth weights (LBWs; <2.5 kg). In females, lower birth weights were associated with lower height, weight, lean body mass (LBM), total body water (TBW), fat mass (FM), fat%, and fat-free mass (FFM) than those of higher older birth weights (quintiles); however, waist cir- cumference (WC), and hip circumference (HC) were similar across quintiles. In males, LBW was similarly associat- ed with lower height, weight, LBM, TBW, FM, fat%, and FFM, and also with lower WC and HC. The obesity mark- ers such as WC, WHR, and body mass index (BMI) were 47%, 61%, and 45% greater, respectively, in LBW females compared to normal birth weight females, while these associations showed non-significant trend in males with LBW.

Conclusion: In adult male and female respondents, LBW was associated with lower body habitus: central obe- sity and body fatness (BMI, FM, fat%, FFM, FM/FFM, and FM/FFM

2

) were more pronounced in females than males, even after taking into account current physical activity and socioeconomic status. These findings indicate LBW may contribute to high blood pressure, dysglycemia and metabolic-abnormalities in adults.

Key words: Birth weight, Anthropometry, Body mass index, Body composition, Fat mass, Adiposity, Obesity

Received December 20, 2020 Reviewed April 6, 2021 Accepted April 19, 2021

* Corresponding author Issa Al Salmi

https://orcid.org/0000-0002-3443-5972 Medicine Department, The Royal Hospital, 23 July St., P.O. Box 1331, code 111, Muscat, Oman

Tel: +968-927-09000 Fax: +968-245-99966 E-mail: [email protected]

INTRODUCTION

Over the last few decades, the contribution of the intrauterine environment to the development of chronic and non-communica- ble diseases has been highlighted.

1-3

Epidemiological studies have demonstrated that a poor intrauterine environment is associated with an increased risk of hypertension, chronic kidney disease, and/or diabetes. Since early 1980s, it has been hypothesized that

nutrient deprivation during distinct periods of prenatal organ de- velopment programs the offspring for cardiovascular diseaselater in life.

1-3

Low birth weight (LBW), reflecting a poor intrauterine envi- ronment, is associated with diminished nephron endowment and other pathophysiological changes that may later lead to develop- ment of high blood pressure.

1,2,4

LBW has been associated with the development of non-insulin- dependent diabetes and with a central pattern of fat distribution,

Copyright © 2021 Korean Society for the Study of Obesity

This is an Open Access article distributed under the terms of the Creative Commons Attribution Non-Commercial License (https://creativecommons.org/licenses/by-nc/4.0/) which permits unrestricted non-commercial use, distribution, and reproduction in any medium, provided the original work is properly cited.

eISSN 2508-7576

2017-03-16 https://crossmark-cdn.crossref.org/widget/v2.0/logos/CROSSMARK_Color_square.svg

Original Article

(2)

which is a component of the insulin resistance syndrome in adults.

5

These observations led to the hypothesis that non-insulin-depen- dent diabetes and cardiovascular disease could be programmed by events in fetal life that lead to persistent changes in body composi- tion and metabolic function.

6

Currently, more than 75% of the disease burden is attributable to non-communicable diseases, with cardiovascular disease being the leading cause of death.

7

The distribution of chronic diseases and related risk factors among the general population of Korea is similar to that of other industrialized nations: 12% of the population has diabetes, 30% is overweight, 20% are obese, 41% has high choles- terol, and 21% has metabolic syndrome.

7

The prevalence of overweight and obesity is increasing at an alarm- ing rate worldwide.

8-12

The prevalence of overweight (body mass index [BMI] ≥ 25 and < 30 kg/m

2

) has remained remarkably sta- ble in both men and women, while that of extreme obesity (BMI

≥ 40 kg/m

2

) has undergone a nine-fold increase from 0.9% in 1960−1962 to 8.1% in 2013−2014. This currently leaves only the remaining ~30% of the U.S. population as having a healthy weight (BMI between 18.5 and 25 kg/m

2

).

13,14

Similar findings have been reported in developing countries. Nationally representative surveys showed alarming rates of overweight and obesity. The prevalence of obesity (defined by BMI ≥ 30 kg/m

2

) was 18.4%, showing a 2.5- fold rise over a 20-year period. Similar surveys conducted in the last 20 years indicate the prevalence of obesity appears to have stabilized among men since 1995, but continues to increase in women.

13,14

Obesity is a multi-factorial disorder and birth weight is thought to be an important factor in its evolution;

8-12

however, the relation- ships between birth weight and overweight, obesity, and body fat distribution in adult life are not well understood.

1-3,15,16

Improving our understanding of the factors that lead to the development of overweight and central obesity is a major public health challenge as obesity is an important risk factor for metabolic diseases and car- diovascular disease.

8-12

Previous studies assessing the relationship between birth weight and adult overweight, fat mass (FM), or body fat distribution showed inconsistent results, as many of these stud- ies used single measures of body fat or body fat distribution as out- comes in relation to birth weight.

17

Some studies have shown J- shaped or linear associations between birth weight and BMI in childhood, while other studies have shown no significant relation-

ships between birth weight and BMI.

18

Also, other researchers have criticized the use of only the BMI, which is only an indirect measure of body fatness, as the outcome measure because it also includes lean and bone mass

17,18

Moreover, the generalizability of some of these studies is limited as they have been based on localized geo- graphical populations, and have included people from specific eth- nicities and/or professional groups.

19-21

To date, no study has as- sessed a cluster of anthropometric and body composition measure- ments in a nationally representative sample of the adult population.

Hence, this population-based cross-sectional nationally represen- tative study aimed to investigate the relationships between birth weight and adult anthropometric and detailed body composition measurements (including adult body fat distribution and most in- dicators of adult body fatness) in men and women.

METHODS Study subjects

The detailed methodology of the Australian Diabetes, Obesity and Lifestyle Study (AusDiab) study had been discussed previous- ly.

22,23

The study was approved and obtained via the Ethics Commit- tee (No. 3/2002) of the International Diabetes Institute. All re- sponders gave written informed consent to participate in the survey upon arrival at thetesting site. The AusDiab survey is a longitudinal study in which data were collected from a stratified sample of Aus- tralians aged 25 years or over, residing in 42 randomly selected ur- ban and non-urban areas (Census Collector Districts) of the six states of Australia and the Northern Territory.

22

Methods and measurements

Questions addressing birth weight were included in the second round of the AusDiab study, which began in July 2004 and is still ongoing. Participants were asked to report their birth weight, assess the level of accuracy of their estimate, and identify the source of their birth weight data. Finally, participants were asked if they had any additional comments. The birth weight data were linked to the anthropometric findings and results of the baseline AusDiab survey.

At baseline, all participants except those who were (1) chairbound,

(2) pregnant, or (3) too unsteady on their feet underwent anthro-

pometric measurements while wearing light clothing and no foot-

(3)

wear. The methods for obtaining these measurements have been described previously.

22,23

Briefly, height was measured to the nearest 0.5 cm using a stadiometer, and weight was measured using a mechan- ical beam balance, and was recorded to the nearest 0.1 kg. The BMI was calculated as weight (kg)/height (m)

2

. The BMI groups were classified according to World Health Organization criteria

24

as fol- lows: normal < 25.0 kg/m

2

, overweight 25.0–29.9 kg/m

2

or obese

≥ 30.0 kg/m

2

. Waist and hip circumferences (HCs) were measured using a W606PM Lufkin steel measuring tape. For each of waist and HC, two measurements to the nearest 0.5 cm were recorded. If the variation between the measurements was greater than 2 cm, a third measurement was taken. The mean of the two closest measurements was calculated. The waist-to-hip ratio (WHR) was obtained by di- viding the mean waist circumference (WC) by the mean HC.

The body can be divided into a FM component and fat-free mass (FFM) component for assessment purposes. The lean body mass (LBM) represents the weight of muscles, bones, ligaments, tendons, and internal organs. The FFM consists of minerals, protein, glyco- gen, and water, and therefore encompasses total intracellular and extracellular body water. The total body water (TBW) is the amount of water retained in the body. The TBW content of the adult human is approximately 60% of the body weight and is broadly divided into the intracellular and the extracellular fluid compartments. Generally, men tend to have higher water weight than woman due to a greater amount of muscle.

All subjects underwent bioimpedance measurements except those who (1) were chairbound, (2) were pregnant, (3) had a colostomy/

ileostomy, (4) did not have a height measurement, or (5) weighed

> 150 kg. The scale for the bioimpedance machine (Tanita TBF 105 Body Fat Analyzer; Tanita Corp., Tokyo, Japan) was placed on a firm, flat surface and measurements completed while the participants wore light clothing with no shoes, socks, or hosiery. If the body fat percentage was greater than 70% or impedance < 100, the process was repeated. If the second reading was within five percentage points of the first reading, the data from the second reading was recorded.

If the second reading was not within five percentage points, the pro- cess was repeated until two consecutive readings within five percent- age points were obtained. Once obtained, all data from the latter of these two readings were recorded. We analyzed the body fat further by using the recommendations of Wells and Victora

25

, who suggest-

ed that whole-body adiposity is best assessed by calculating the in- dexes of FM to FFM (FM/FFM) and FM/FFM

2

.

An interviewer-administered questionnaire was used to deter- mine smoking, alcohol consumption, leisure-time physical activity and television viewing. The assessment of socioeconomic status was based on education, occupation, and income. We considered adult height, adult weight, WC, HC, LBM and TBW to be “low” if they were below the sex-specific 10th percentiles, and WC, waist- to-hip ratio, and body fat parentage (fat%) to be “high” if they were above the sex-specific 90th percentiles. The World Health Organi- zation criteria

24

define obesity as follows: (1) a BMI of ≥30 kg/m

2

for both men and women; (2) a WC ≥ 1.02 m (102 cm) in men and in women of ≥0.88 m (88 cm), also termed abdominal obesity;

and (3) a WHR above 0.90 for males and above 0.85 for females. In addition, FM was considered “high” when the result was > 90th percentile, which was > 48.6 kg for females, and > 34.3 kg for males. The fat% was considered “high” when the result was > 90th percentile, which was > 54.7 kg for females; and > 34.3 kg. for males. The FM/FFM ratio was considered “high” when the result was > 90th percentile, which was > 120.8 for females, and for male

> 52.2. The FM/FFM

2

was considered “high” when it was calcu- lated to be > 90th percentile, which was > 3.12 for females, and

> 0.80 for males. The height was considered “low” when the result was < 10th percentile, which was ≤ 155 cm for females, and ≤ 168 cm for males. The weight was considered “low” when the result was < 10th percentile, which was ≤ 54 kg for females; and ≤69.6 kg for males. The HC was considered “low” when the result was

< 10th percentile, which was ≤ 92.8 cm for females, and ≤ 95.9 cm for males. Lean mass was considered low when the results was

< 10th percentile, ≤ 35.3 kg for females, and ≤ 56.0 kg for males.

Water mass was considered “low” when the result was < 10th per- centile, which was ≤ 25.8 kg for females, and ≤ 41.0 kg for males.

The birth weights, if recorded in pounds and ounces, were convert- ed to kilograms for the statistical analyses. LBW was defined as a birth weight < 2.5 kg. Birth weight was also divided equally into quintiles for further categorical analyses.

Statistical analyses

All analyses were performed using the Stata software program

(Stata Corp., College Station, TX, USA). The birth/weights, if re-

(4)

corded in pounds and ounces, were converted to kilograms for sta- tistical analyses. LBW was defined as birth weight < 2.5 kg. Birth weight was also divided equally into quintiles for further categorical analyses.

Apart from the FM, FM/FFM and FM/FFM

2

variables, the re- maining variables were approximately normally distributed. Student t-test was used to assess the differences in anthropometric and body composition measurements among those who reported their birth weight and those who did not. We examined age-adjusted anthro- pometric measurements by sex-specific quintiles, and the multivar- iate-adjusted means of fat% and FM/FFM

2

by were examined by sex-specific categories. In multivariate analyses, we adjusted for age, BMI, physical activity, smoking status, alcohol intake and socioeco- nomic status (based on education, income, and dwelling type). We used linear regression to assess the strength of the associations be- tween birth weight (per 1 kg increase) and adult height, weight, WC, HC, LBM, TBW, WHR, BMI, and body fat indices, in females and males separately. We used logistic regression to calculate the age-ad- justed odds ratios for: (1) obesity according to BMI, WC, and WHR, (2) “low” height, weight, HC, LBM, and TBW, and (3) “high” FM, fat%, FM/FFM, and FM/FFM

2

among people with LBW relative to those with normal birth weight (NBW). No significant interac- tion terms between various covariates were identified in our models.

RESULTS

Of the 7,157 respondents to our questionnaire, 4,502 reported

information related to their birth weight. Their birth weights ranged from 0.4 to 7.0 kg with a mean and standard deviation (SD) of 3.37± 0.7 kg, as shown in Fig. 1. The average values of 3.35± 0.6 vs. 3.37± 0.7 kg were nearly equal for those who obtained their birth weight from family members and for those who obtained it from medical records, respectively, after adjustment for age and sex (P=0.36). The mean birth weight of females (3.28 kg; SD, 0.6 kg) was lower than that of males, (3.5 kg; SD, 0.7 kg). The prevalence of LBW (< 2.5 kg) was 10% and 6% in females and males, respec- tively.

Table 1 presents the comparison of relevant characteristics be- tween participants who reported their birth weight and those who did not. Those who did not report their birth weight were older,

Table 1. Characteristics of people who provided their birth weight and those who did not provide their birth weight (including both respondents and non-respondents to our birth weight questionnaire)

Variable Birth weight data* No birth weight data

P Female

Number 2,711 1,354

Age (yr) 48.2 (47.7–48.8) 53.6 (53.1–54.1) < 0.001 Height (cm) 163.2 (163–164) 161.2 (161.0–162.0) < 0.001 Weight (kg) 70.4 (69.8–71.0) 70.3 (69.8–70.9) 0.893 Waist (cm) 84.2 (83.7–84.7) 86.5 (86.0–86.9) < 0.001

Hip (cm) 105 (104–105) 104 (104–104) 0.020

Body mass index (kg/m

2

) 26.6 (26.4–26.8) 27.0 (26.8–27.2) 0.005 Waist-to-hip ratio 0.93 (0.92–0.93) 0.94 (0.94–0.94) < 0.001 Lean mass (kg) 41.1 (40.9–41.3) 40.4 (40.2–40.6) < 0.001 Body water (kg) 30.1 (30.0–30.2) 29.6 (29.5–29.7) < 0.001 Fat mass

(kg) 27.1 (25.9–27.9) 26.7 (26.3–27.1) 0.265

Fat (%) 39.8 (39.4–40.2) 40.3 (39.9–40.7) 0.084

Male

Number 1,791 1,301

Age (yr) 48.3 (47.7–48.8) 53.6 (53.1–54.1) < 0.001 Height (cm) 177.0 (177.0–177.0) 175.0 (175.0–175.0) < 0.001 Weight (kg) 85.5 (84.9–86.2) 83.2 (82.7–83.7) < 0.001

Waist (cm) 97.1 (96.6–97.6) 97.8 (97.4–98.2) 0.028

Hip (cm) 105 (105–105) 106 (105–106) 0.107

Body mass index (kg/m

2

) 27.3 (27.1–27.5) 27.2 (27.1–27.3) 0.496 Waist-to-hip ratio 0.80 (0.80–0.80) 0.82 (0.82–0.82) < 0.001 Lean mass (kg) 63.5 (63.2–63.8) 61.9 (61.7–62.1) < 0.001 Body water (kg) 46.5 (46.3–46.7) 45.3 (45.2–45.5) < 0.001 Fat mass

(kg) 20.1 (19.6–20.5) 19.1 (18.8–19.4) < 0.001

Fat (%) 24.8 (24.5–25.2) 24.6 (24.3–24.8) 0.201

Values are presented as mean (range).

*Participants with birth weight data (n= 4,502);

Participants who did not provide their birth weight in the questionnaire (n= 2,655);

Geometric mean.

0.8

0.6

0.4

0.2

0

Density

1 2 3 4 5 6 Birth weight (kg)

Female

Male

Figure 1. Birth weight distribution of study participants.

(5)

shorter and were more likely to have higher WHR and lower LBM.

Table 2 presents the participants’ anthropometric data by quintiles of birth weight for females and males. Females in the lowest birth weight quintile had the lowest mean height, weight, LBM, FM, fat%, FFM, and TBW, but no differences were apparent with re- spect to BMI or WC. Males in the lowest birth weight quintile had lower mean height, weight, BMI, LBM, TBW, WC, HC, FM, fat%, and FFM than those of higher birth weight quintiles; however, WHR did not differ by birth weight quintile. The differences ac- cording to birth weight quintiles persisted even after adjustment for

BMI, physical activity, smoking, alcohol intake and socioeconomic status. Both females and males with LBW had the highest fat% af- ter adjustment for age, BMI, physical activity, smoking status, alco- hol intake and socioeconomic status. This relationship was even more pronounced when the relationship between birth weight and FM/FFM

2

was examined.

When applying the traditional definition of LBW (< 2.5 kg), as shown in Table 3, females with LBW were shorter, had higher WC, WHR, FM, fat%, and FFM, and lower LBM and TBW than fe- males with NBW (≥ 2.5 kg); however, there were no significant Table 2. Age-adjusted means and 95% CI of anthropometric and body composition measurements by sex-specific birth weight quintiles

Variable Quintile of sex-specific birth weight

Q1 Q2 Q3 Q4 Q5 P

Female

Birth weight (kg) < 2.81 2.81–3.18 3.19–3.40 3.41–3.71 ≥ 3.72

Number 546 637 526 466 536

Height (cm) 160.9 (160–161) 162.5 (162–163) 163.8 (163–164) 163.7 (163–164) 165.4 (165.0–166.0) < 0.001

Weight (kg) 69.2 (68.0–70.5) 69.2 (68.0–70.3) 70.4 (69.1–71.6) 70.5 (69.1–71.8) 73.1 (71.8–74.3) < 0.001

Waist (cm) 84.8 (83.7–85.9) 84.0 (83.0–85.0) 83.5 (82.4–84.6) 84.1 (82.9–85.2) 84.8 (83.7–85.9 0.400

Hip (cm) 104.6 (104–106) 104.5 (104–105) 104.7 (104–106) 104.9 (104.0–106.0) 106.3 (105–107) 0.059

BMI (kg/m

2

) 26.8 (26.3–27.2) 26.2 (25.8–26.6) 26.2 (25.8–26.6) 26.3 (25.9–26.8) 26.7 (26.3–27.2) 0.253

WHR 0.807 (0.80–0.81) 0.802 (0.80–0.81) 0.796 (0.79–0.80) 0.80 (0.79–0.81) 0.796 (0.79–0.80) 0.032

Lean mass (kg) 39.5 (39.1–39.9) 40.5 (40.1–40.9) 41.4 (41.0–41.8) 41.4 (40.9–41.8) 43.0 (42.5–43.4) < 0.001 Water mass (kg) 28.9 (28.6–29.2) 29.6 (29.4–29.9) 30.3 (30.0–30.6 30.3 (30.0–30.6) 31.4 (31.1–31.8) < 0.001

FM* (kg) 27.4 (26.4–27.9) 25.8 (24.9–26.7) 26.0 (25.0–27.0) 26.2 (25.2–27.3) 27.1 (26.5–27.5) 0.062

Fat (%) 41.6 (40.7–42.5) 39.6 (38.7–40.4) 39.3 (38.4–40.2) 39.4 (38.4–40.4) 39.5 (38.5–40.4) 0.024

FM/FFM* (%) 67.8 (64.9–70.1) 64.1 (61.8–65.5) 63.3 (60.8–65.8) 63.8 (61.1–66.5) 64.3 (61.8–66.9) 0.093

FM/FFM

2

* (%) 1.72 (1.65–1.80) 1.59 (1.53–1.66) 1.54 (1.47–1.60) 1.55 (1.48–1.62) 1.51 (1.45–1.58) < 0.001 Male

Birth weight (kg) < 3.06 3.06–3.36 3.37–3.63 3.64-4.04 ≥ 4.05

Number 364 355 408 311 353

Height (cm) 174.7 (174–175) 175.7 (175–176) 176.9 (176–178) 178.6 (178–179) 179.4 (179–180) < 0.001

Weight (kg) 82.3 (80.9–83.7) 83.3 (81.8–84.7) 84.4 (83.1–85.8) 88.8 (87.3–90.4) 89.5 (88.1–91.0) < 0.001

Waist (cm) 96.0 (94.9–97.1) 95.9 (94.8–97.0) 96.3 (95.3–97.4) 98.9 (97.7–100) 98.8 (97.7–99.9) < 0.001

Hip (cm) 103.8 (103–105) 103.5 (103–104) 104.2 (104–105) 106.2 (105–107) 106.1 (105–107) < 0.001

BMI (kg/m

2

) 26.9 (26.5–27.3) 26.9 (26.5–27.3) 27.0 (26.6–27.4) 27.9 (27.4–28.3) 27.8 (27.4–28.3) < 0.001

WHR 0.924 (0.92–0.93) 0.926 (0.92–0.93) 0.923 (0.92–0.93) 0.929 (0.92–0.94) 0.929 (0.92–0.94) 0.469

Lean mass (kg) 61.4 (60.7–62.0) 62.3 (61.6–62.9) 63.3 (62.7–63.9) 60.0 (64.3–65.7) 65.8 (65.2–66.4) < 0.001 Water mass (kg) 44.9 (44.5–45.4) 45.6 (45.1–46.0) 46.3 (45.9–46.8) 47.6 (47.1–48.1) 48.2 (47.7–48.6) < 0.001

FM* (kg) 19.1 (18.2–20.0) 19.0 (18.1–20.0) 19.6 (18.8–20.4) 21.6 (20.5–22.6) 21.5 (20.5–22.5) < 0.001

Fat (%) 24.6 (23.8–25.3) 24.3 (23.5–25.0) 24.3 (23.6–25.0) 25.7 (24.9–26.6) 25.5 (24.8–26.3) 0.014

FM/FFM* (%) 31.8 (30.0–32.6) 31.7 (29.5–32.1) 31.1 (29.9–32.3) 33.2 (31.8–34.8) 32.9 (31.5–34.3) 0.035

FM/FFM

2

* (%) 0.55 (0.51–0.59) 0.50 (0.48–0.52) 0.49 (0.48–0.51) 0.51 (0.49–0.54) 0.50 (0.48–0.52) 0.055

Values are presented as mean (95% CI).

*Geometric mean.

CI, confidence interval; BMI, body mass index; WHR, waist-to-hip ratio; FM, fat mass; FFM, fat free mass.

(6)

differences with respect to current body weight, HC or BMI. Males with LBW were shorter, had lower LBM, weight, BMI, LBM, TBW, WC, HC, FM, fat%, and FFM than those with NBW, al- though there no significant differences with respect to WC and WHR. Overall, compared to people with birth weight ≥ 2.5 kg, the indices of body fatness we assessed were significantly greater in LBW females than in males.

We examined the predicted associations of each kilogram increase in birth weight with body size and composition. Among females, for each kg of birth weight, there was a predicted increase (95%

confidence interval [CI]) of 2.0 cm (1.7–2.4 cm) in height, 1.70 kg (0.8–2.6 kg) in weight, 1.67 kg (1.4–2.0 kg) in LBM, 1.23 kg (1.0–

1.4 kg) in TBW, with P<0.001 for all. However, there was a pre- dicted decrease of 0.01 unit (–0.01 to –0.002) in WHR (P=0.003), 0.72% (–1.34 to –0.1) in fat% (P=0.023), and 0.14% (–0.21% to –0.07%) in FM/FFM

2

(P<0.001). Among males, for each kg of birth weight, there was an increase of 2.3 cm (1.9–2.8 cm) in height, 3.8 kg (2.8–4.7 kg) in weight, 1.5 cm (0.8–2.3 cm) in WC, 1.36 cm (0.8–1.9 cm) in HC, 2.3 kg (1.8–2.7 kg) in LBM, and 1.7 kg (1.4–

2.0 kg) in TBW, with P<0.001 for all.

Table 4 shows that the obesity markers WC, WHR, and BMI were 47%, 61%, and 45% greater, respectively, among females with LBW compared to normal birth weight females, together with 36%, 58%, 64%, and 56% increases in the risks of high (> 90th per- centile) FM, fat%, FM/FFM and FM/FFM2, respectively. Both fe- males and males with LBW had 1.7–2.8 times the risk for having lower height, weight, HC, lean mass, and TBW relative to those Table 3. Age-adjusted means (95% CI) of anthropometric and body composition

measurements for 384 LBW (< 2.5 kg) participants and 4,118 NBW (≥ 2.5 kg) par- ticipants

Variable LBW NBW P

Female

Number 275 2,436

Height (cm) 160.9 (160–162) 163.5 (163–164) < 0.001 Weight (kg) 70.1 (68.3–71.9) 70.5 (69.9–71.0) 0.685 Waist (cm) 86.1 (84.6–87.7) 84.0 (83.5–84.5) 0.012

Hip (cm) 105.0 (104–106) 105.0 (105–105) 0.939

BMI (kg/m

2

) 27.1 (26.4–27.7) 26.4 (26.2–26.6) 0.059 WHR 0.817 (0.81–0.83) 0.798 (0.80–0.80) < 0.001 Lean mass (kg) 39.2 (38.6–39.8) 41.3 (41.1–41.5) < 0.001 Water mass (kg) 28.7 (28.2–29.1) 30.3 (30.1–30.4) < 0.001

FM* (kg) 27.9 (25.9–28.6) 26.3 (25.8–26.7) 0.079

Fat (%) 41.6 (40.3–42.9) 39.5 (39.0–39.9) 0.002

FM/FFM* (%) 69.8 (66.1–73.8) 64.0 (62.8–65.2) 0.004 FM/FFM

2

* (%) 1.80 (1.69–1.91) 1.56 (1.53–1.59) < 0.001 Male

Number 109 1,682

Height (cm) 174.1 (173–175) 177.2 (177–178) < 0.001 Weight (kg) 80.8 (78.2–83.5) 85.8 (85.2–86.5) < 0.001 Waist (cm) 95.5 (93.5–97.5) 97.2 (96.7–97.7) 0.112

Hip (cm) 103.3 (102–105) 104.8 (104–105) 0.039

BMI (kg/m

2

) 26.6 (25.9–27.4) 27.3 (27.1–27.5) 0.077

WHR 0.923 (0.91–0.93) 0.926 (0.92–0.93) 0.590

Lean mass (kg) 60.4 (59.3–61.6) 63.7 (63.4–64.0) < 0.001 Water mass (kg) 44.2 (43.4–45.1) 46.6 (46.4–46.8) < 0.001

FM* (kg) 18.4 (16.9–20.0) 20.2 (19.8–20.6) 0.038

Fat (%) 25.8 (24.9–26.4) 24.9 (24.5–25.3) 0.101

FM/FFM* (%) 32.6 (29.3–43.0) 31.1 (30.2–32.1) 0.089 FM/FFM

2

* (%) 0.59 (0.49–0.65) 0.50 (0.49–0.51) 0.093 Values are presented as mean (95% CI). The relationships persisted after adjustment for physical activity, smoking, alcohol intake and socioeconomic status (based on edu- cation, dwelling type, and income).

*Geometric mean.

CI, confidence interval; LBW, low birth weight; NBW, normal birth weight; BMI, body mass index; WHR, waist-to-hip ratio; FM, fat mass; FFM, fat-free mass.

Table 4. Age-adjusted odds ratio and 95% CI of being in various anthropometric and body composition categories for people with LBW relative to those with NBW

Variable Female Male

Odds ratio (95% CI) P Odds ratio (95% CI) P BMI-obese* 1.45 (1.06–1.98) 0.019 1.36 (0.96–1.43) 0.091 Waist-obese* 1.47 (1.10–1.96) 0.009 1.24 (0.95–1.35) 0.079 WHR-obese* 1.61 (1.22–2.11) 0.001 1.23 (0.93–1.76) 0.087 High FM 1.36 (0.96–1.92) 0.081 1.28 (0.90–1.52) 0.103 High fat% 1.58 (1.14–2.21 0.006 1.40 (0.95–1.60) 0.097 High FM/FFM 1.64 (1.18–2.28) 0.003 1.38 (0.97–1.37) 0.085 High FM/FFM

2

1.56 (1.12–2.18) 0.008 1.39 (0.98–1.75) 0.053 Low height 1.99 (1.43–2.78) < 0.001 2.79 (1.74–4.49) < 0.001 Low weight 1.91 (1.35–2.72) < 0.001 2.17 (1.30–3.62) 0.003 Low hip 1.68 (1.16–2.42) 0.006 2.02 (1.18–3.44) 0.010 Low lean mass 2.39 (1.72–3.32) < 0.001 2.72 (1.69–4.38) < 0.001 Low water mass 2.40 (1.73–3.34) < 0.001 2.72 (1.69–4.38) < 0.001 The relationships persisted after adjustment for physical activity, smoking, alcohol in- take and socioeconomic status (based on education, dwelling type, and income).

*World Health Organization criteria: High FM: high represent > 90th percentile (female

> 48.6; male > 34.3 kg); High fat%: high represent > 90th percentile (female > 54.7;

male > 34.3 kg); High FM/FFM: high represent > 90th percentile (female > 120.8; male

> 52.2); High FM/FFM

2

: high represent > 90th percentile (female > 3.12; male > 0.80);

Low height: low represent < 10th percentile (female ≤ 155 cm; male ≤ 168 cm); Low weight: low represent < 10th percentile (female ≤ 54 kg; male ≤ 69.6 kg); Low hip: low represent < 10th percentile (female ≤ 92.8 cm; male ≤ 95.9 cm); Low lean mass: low represent < 10th percentile (female ≤ 35.3 kg; male ≤ 56.0 kg); Low water mass: low represent < 10th percentile (female ≤ 25.8 kg; male ≤ 41.0 kg).

CI, confidence interval; LBW, low birth weight (< 2.5 kg); NBW, normal birth weight

(≥ 2.5 kg); BMI, body mass index; WHR, waist-to-hip ratio; FM, fat mass; FFM, fat free

mass.

(7)

with normal birth weight.

DISCUSSION

This is the first study to examine the associations of birth weight with measures of adult body size and composition in a nationally representative sample of the general population. The results indi- cated significant associations of birth weight with adult body habi- tus among the general population. Lower birth weights were asso- ciated with lower height, weight, LBM and TBW in both females and males. LBW was also associated with greater central fat and to- tal body fat.

Using the conventional definition of LBW (<2.5 kg), highlighted the sex differences: all measures of LBM were lower in LBW par- ticipants of both sexes, including the prevalence of central obesity;

in addition, body fatness as assessed using several different indices, including BMI, FM, fat%, FFM, FM/FFM, and FM/FFM

2

, was significantly increased in LBW females and males compared with those of higher birth weights.

Fetal development is one of the critical periods with regard to adult obesity. The association of birth weight with LBM is consis- tent with the theory that restricted intrauterine nutrition limits cell division and cell growth and modifies fetal organ structure,

26

and the development of muscle mass, in particular; it is also thought these adverse effects may not be fully reversed by subsequent improve- ments in nutrition.

27-29

It is possible that factors influencing birth weight at term may also influence storage of fat in later life.

16,30-33

However, these changes or modification may be qualitative, or quan- titative and differ by sex.

Several studies have suggested an inverse association between birth weight (or famine exposure during early gestation) and vari- ous measures of abdominal obesity in childhood or adult life.

34,35

Our results, like those of Ravelli et al.,

36

confirmed this phenome- non was more pronounced in adult females with LBW than in males. This relationship was independent of current body size and persisted after adjustment for all major confounders.

Additional studies of newborns have suggested that preterm small- for-gestational age infants store excess calories as fat, and their pro- tein reserves in the form of muscle mass remain low.

37-39

Previous research during a wartime famine in the Netherlands showed that

under-nutrition in early pregnancy resulted in increased rates of obesity in males at 19 years of age, whereas under-nutrition in the third trimester or early postnatal life resulted in a reduced likelihood of obesity.

40,41

However, subsequent follow-up of the Dutch men at 50 years of age showed that this effect on adiposity did not persist.

36

These findings might explain the sex differences observed in our study, where males with LBW did not exhibit significantly higher adiposity or central obesity. The basis for restriction of the phenom- enon to females or its accentuation in females is poorly understood, but probably reflects a survival or reproductive advantage.

40,41

One study found that body-fat percentage and leptin concentrations were positively associated with birth weight.

42

Other studies have shown that leptin levels were higher in women than in men, and women had greater body fat and FM than men. It has been sug- gested that this discrepancy in body composition may be due to the increased deposition of subcutaneous fat in female newborns, such that sex differences in body composition are already present in newborns.

43

Lower birth weights predispose humans to a variety of chronic diseases and their risk factors (diabetes, hypertension, cardiovascu- lar diseases, chronic kidney disease, metabolic syndrome, chronic pulmonary disorders, and osteoarthritis).

1-3

We have already de- scribed most of these phenomena in the AusDiab Birth weight co- hort.

15,16,44,45

In view of the correlations of these conditions with measures of central fat, the greater susceptibility of those with lower birth weight to chronic disease could be mediated, in part, through their relative preservation or amplification of central body fat.

46

The greater predisposition to chronic disease among lower birth weight females is also compatible with the different influences of birth weight on central fat deposition in males and females.

1-3,15,16

Limitations

The present study was limited by not including the gestational

age in the analyses, and thus stratification of the participants’ data

by those who had been small-for- gestational age, appropriate-for-

gestational age and large-for-gestational age at birth in comparison

with the general population was not possible. While many small-

for gestational age babies tend to catch up during infancy, the study

did not have information regarding the rate of growth during first

few years of life.

(8)

Conclusions

The findings of this study may have implications for the preven- tion and management of renal disorders in any country where the incidence of LBW is increasing and the affected newborns survive.

Advancements in intensive care and general medical care over time have allowed more lower-birth weight infants to survive to adult life. In all populations, a worldwide trend towards higher levels of body fat and BMI potentially compounds the effects of other risk factors such as the expression of glycemic abnormalities associated with lower birth weights. Modest increases in body fat may have a trivial impact on the burden of metabolic and renal diseases when acting in isolation, but may have substantial impact when com- bined with other risk factors. It would therefore be prudent to adopt policies of intensified whole-of-life surveillance of lower- birth weight people in anticipation of the potential risks. Also, as the earliest known risk factor for renal disease, consideration of LBW among people in more developed countries could be used in risk stratification for early identification of renal disease or its risk factors. The long-term health outcomes for LBW infants are of po- tential concern and may guide point-of-care decisions for further testing and management selection that sets a platform for risk re- duction based on biological platform stratification.

These findings contribute to our understanding of the determi- nants of adult body habitus, and inferentially, of their influence on adult health profiles. From a public health perspective, these find- ings indicate LBW may play an important role in the predisposition to dysglycemia and various metabolic abnormalities.

CONFLICTS OF INTEREST

The authors declare no conflict of interest.

ACKNOWLEDGMENTS

We thank the participants, Survey Team, and Steering Commit- tee of the AusDiab Study for their support of and assistance with the birth weight project since 2004. The AusDiab study is co-coor- dinated by the Baker IDI Heart and Diabetes Institute.

We have no conflicts of interest to declare; however, the Ausdiab study was provided financial support by the Commonwealth De-

partment of Health and Aged Care, Abbott Australasia, Alp- hapharm, Aventis Pharmaceutical, AstraZeneca, Bristol-Myers Squibb Pharmaceuticals, Eli Lilly (Australia), GlaxoSmithKline, Janssen-Cilag (Australia), Merck Lipha, Merck Sharp & Dohme (Australia), Novartis Pharmaceutical (Australia), Novo Nordisk Pharmaceutical, Pharmacia and Upjohn, Pfizer, Roche Diagnostics, Sanofi Synthelabo (Australia), Servier Laboratories (Australia), BioRad Laboratories, HITECH Pathology, the Australian Kidney Foundation, Diabetes Australia, Diabetes Australia (Northern Ter- ritory), Queensland Health, the South Australian Department of Human Services, the Tasmanian Department of Human Services, the Victorian Department of Human Services, and the Health De- partment of Western Australia.

AUTHOR CONTRIBUTIONS

Study concept and design: ISA; acquisition of data: ISA; analysis and interpretation of data: all authors; drafting of the manuscript:

all authors; critical revision of the manuscript: SH; statistical analy- sis: ISA; obtained funding: ISA; administrative, technical, or mate- rial support: all authors; and study supervision: all authors.

REFERENCES

1. Al Salmi I, M Shaheen FA, Hannawi S. Birth weight, gestation- al age, and blood pressure: early life management strategy and population health perspective. Saudi J Kidney Dis Transpl 2019;30:299-308.

2. Al Salmi I, Hannawi S. Birth weight and gestational age: early life management strategy to population health for cardiac dis- eases. J Integr Cardiol 2018;4:1-3.

3. Al Salmi I, Hannawi S. Birthweight and gestational age: early life management strategy to population health for non-com- municable diseases. Int J Pediatr Res 2018;4:9.

4. Low birth weight and nephron number working group. The impact of kidney development on the life course: a consensus document for action. Nephron 2017;136:3-49.

5. Hong YH, Chung S. Small for gestational age and obesity re- lated comorbidities. Ann Pediatr Endocrinol Metab 2018;23:

4-8.

(9)

6. Robinson R. The fetal origins of adult disease. BMJ 2001;322:

375-6.

7. Al-Lawati JA, Mabry R, Mohammed AJ. Addressing the threat of chronic diseases in Oman. Prev Chronic Dis 2008;5:A99.

8. Nam GE, Kim YH, Han K, Jung JH, Park YG, Lee KW, et al.

Obesity fact sheet in Korea, 2018: data focusing on waist cir- cumference and obesity-related comorbidities. J Obes Metab Syndr 2019;28:236-45.

9. Nam GE, Kim YH, Han K, Jung JH, Rhee EJ, Lee SS, et al.

Obesity fact sheet in Korea, 2019: prevalence of obesity and abdominal obesity from 2009 to 2018 and social factors. J Obes Metab Syndr 2020;29:124-32.

10. Seo MH, Kim YH, Han K, Jung JH, Park YG, Lee SS, et al.

Prevalence of obesity and incidence of obesity-related comor- bidities in Koreans based on national health insurance service health checkup data 2006-2015. J Obes Metab Syndr 2018;

27:46-52.

11. Seo MH, Kim YH, Han K, Lee WY, Yoo SJ. Prevalence of obesity and incidence of obesity-related comorbidities in Ko- reans based on National Health Insurance Service Health Checkup Data 2006-2015 (J Obes Metab Syndr 2018;27:46- 52). J Obes Metab Syndr 2018;27:198-9.

12. Yoon JH. Prevalence of obesity and incidence of obesity-relat- ed comorbidities in Koreans based on National Health Insur- ance Service Health Checkup Data 2006-2015 (J Obes Metab Syndr 2018;27:46-52). J Obes Metab Syndr 2018;27:195-7.

13. Kumar S, Kelly AS. Review of childhood obesity: from epide- miology, etiology, and comorbidities to clinical assessment and treatment. Mayo Clin Proc 2017;92:251-65.

14. Purnell JQ. Definitions, classification, and epidemiology of obesity. In: Feingold KR, Anawalt B, Boyce A, Chrousos G, Dungan K, Grossman A, et al., editors. Endotext. South Dart- mouth (MA): MDText.com; 2000.

15. Al Salmi I, Hannawi S. Birth weight is inversely correlated with blood pressure: population-based study. J Hypertens 2020;38:

2205-14.

16. Al Salmi I, Hannawi S. Birthweight and lipids in adult life:

population-based cross sectional study. Lipids 2020;55:365-74.

17. Te Velde SJ, Twisk JW, Van Mechelen W, Kemper HC. Birth weight, adult body composition, and subcutaneous fat distri-

bution. Obes Res 2003;11:202-8.

18. Kang M, Yoo JE, Kim K, Choi S, Park SM. Associations be- tween birth weight, obesity, fat mass and lean mass in Korean adolescents: the Fifth Korea National Health and Nutrition Examination Survey. BMJ Open 2018;8:e018039.

19. Huxley R. Fatal flaw in the fetal argument. Br J Nutr 2006;95:

441-2.

20. Huxley R, Neil A, Collins R. Unravelling the fetal origins hy- pothesis: is there really an inverse association between birth- weight and subsequent blood pressure? Lancet 2002;360:

659-65.

21. Huxley R, Owen CG, Whincup PH, Cook DG, Rich-Edwards J, Smith GD, et al. Is birth weight a risk factor for ischemic heart disease in later life? Am J Clin Nutr 2007;85:1244-50.

22. Dunstan DW, Zimmet PZ, Welborn TA, Cameron AJ, Shaw J, de Courten M, et al. The Australian Diabetes, Obesity and Lifestyle Study (AusDiab): methods and response rates. Dia- betes Res Clin Pract 2002;57:119-29.

23. Magliano DJ, Barr EL, Zimmet PZ, Cameron AJ, Dunstan DW, Colagiuri S, et al. Glucose indices, health behaviors, and incidence of diabetes in Australia: the Australian Diabetes, Obesity and lifestyle study. Diabetes Care 2008;31:267-72.

24. Obesity: preventing and managing the global epidemic. Re- port of a WHO consultation. World Health Organ Tech Rep Ser 2000;894:i-xii, 1-253.

25. Wells JC, Victora CG. Indices of whole-body and central adi- posity for evaluating the metabolic load of obesity. Int J Obes (Lond) 2005;29:483-9.

26. Sarr O, Yang K, Regnault TR. In utero programming of later adiposity: the role of fetal growth restriction. J Pregnancy 2012;2012:134758.

27. Kuh D, Hardy R, Butterworth S, Okell L, Wadsworth M, Coo- per C, et al. Developmental origins of midlife grip strength:

findings from a birth cohort study. J Gerontol A Biol Sci Med Sci 2006;61:702-6.

28. Lopez-Lopez J, Lopez-Jaramillo P, Camacho PA, Gomez-Ar- belaez D, Cohen DD. The link between fetal programming, inflammation, muscular strength, and blood pressure. Media- tors Inflamm 2015;2015:710613.

29. Phillips DI. Relation of fetal growth to adult muscle mass and

(10)

glucose tolerance. Diabet Med 1995;12:686-90.

30. Hokken-Koelega AC, van Pareren Y, Sas T, Arends N. Final height data, body composition and glucose metabolism in growth hormone-treated short children born small for gesta- tional age. Horm Res 2003;60 Suppl 3:113-4.

31. Khandelwal P, Jain V, Gupta AK, Kalaivani M, Paul VK. As- sociation of early postnatal growth trajectory with body com- position in term low birth weight infants. J Dev Orig Health Dis 2014;5:189-96.

32. Sandboge S, Moltchanova E, Blomstedt PA, Salonen MK, Kajantie E, Osmond C, et al. Birth-weight and resting meta- bolic rate in adulthood: sex-specific differences. Ann Med 2012;44:296-303.

33. Simpson J, Smith AD, Fraser A, Sattar N, Lindsay RS, Ring SM, et al. Programming of adiposity in childhood and adoles- cence: associations with birth weight and cord blood adipo- kines. J Clin Endocrinol Metab 2017;102:499-506.

34. Ansari H, Qorbani M, Rezaei F, Djalalinia S, Asadi M, Miran- zadeh S, et al. Association of birth weight with abdominal obesity and weight disorders in children and adolescents: the weight disorder survey of the CASPIAN-IV Study. J Cardio- vasc Thorac Res 2017;9:140-6.

35. Ylihärsilä H, Kajantie E, Osmond C, Forsén T, Barker DJ, Er- iksson JG. Birth size, adult body composition and muscle strength in later life. Int J Obes (Lond) 2007;31:1392-9.

36. Ravelli AC, van Der Meulen JH, Osmond C, Barker DJ, Blek- er OP. Obesity at the age of 50 y in men and women exposed to famine prenatally. Am J Clin Nutr 1999;70:811-6.

37. Catalano PM, Tyzbir ED, Allen SR, McBean JH, McAuliffe TL. Evaluation of fetal growth by estimation of neonatal body composition. Obstet Gynecol 1992;79:46-50.

38. Lapillonne A, Peretti N, Ho PS, Claris O, Salle BL. Aetiology, morphology and body composition of infants born small for gestational age. Acta Paediatr Suppl 1997;423:173-6.

39. Yau KI, Chang MH. Growth and body composition of pre- term, small-for-gestational-age infants at a postmenstrual age of 37-40 weeks. Early Hum Dev 1993;33:117-31.

40. Lumey LH, Stein AD, Susser E. Prenatal famine and adult health. Annu Rev Public Health 2011;32:237-62.

41. Stein AD, Pierik FH, Verrips GH, Susser ES, Lumey LH. Ma- ternal exposure to the Dutch famine before conception and during pregnancy: quality of life and depressive symptoms in adult offspring. Epidemiology 2009;20:909-15.

42. Martínez-Cordero C, Amador-Licona N, Guízar-Mendoza JM, Hernández-Méndez J, Ruelas-Orozco G. Body fat at birth and cord blood levels of insulin, adiponectin, leptin, and insulin- like growth factor-I in small-for-gestational-age infants. Arch Med Res 2006;37:490-4.

43. Villar J, Puglia FA, Fenton TR, Cheikh Ismail L, Staines-Urias E, Giuliani F, et al. Body composition at birth and its relation- ship with neonatal anthropometric ratios: the newborn body composition study of the INTERGROWTH-21project. Pe- diatr Res 2017;82:305-16.

44. Al Salmi I, Hoy WE, Kondalsamy-Chennakes S, Wang Z, Healy H, Shaw JE. Birth weight and stages of CKD: a case- control study in an Australian population. Am J Kidney Dis 2008;52:1070-8.

45. Al Salmi I, Hoy WE, Kondalsamy-Chennakesavan S, Wang Z, Gobe GC, Barr EL, et al. Disorders of glucose regulation in adults and birth weight: results from the Australian Diabetes, Obesity and Lifestyle (AUSDIAB) Study. Diabetes Care 2008;

31:159-64.

46. Gunnarsdottir I, Birgisdottir BE, Benediktsson R, Gudnason V,

Thorsdottir I. Association between size at birth, truncal fat

and obesity in adult life and its contribution to blood pressure

and coronary heart disease: study in a high birth weight pop-

ulation. Eur J Clin Nutr 2004;58:812-8.

수치

Table 1. Characteristics of people who provided their birth weight and those who  did not provide their birth weight (including both respondents and non-respondents  to our birth weight questionnaire)
Table 2 presents the participants’ anthropometric data by quintiles  of birth weight for females and males
Table 4. Age-adjusted odds ratio and 95% CI of being in various anthropometric  and body composition categories for people with LBW relative to those with NBW

참조

관련 문서

In conclusion, Pilates chair exercise is a positive factor in improving skeletal muscle mass among menopausal women's body composition and lower muscles EMG

A study on the relationship between body mass index and the food habits of college students. Keilins respiratory chain concept and its

• The fundamental relation between the forces acting on a rigid body in plane motion and the acceleration of its mass center and the angular acceleration of the body

In this study, 12 weeks of aerobic exercise was conducted in middle-aged women aged 45 to 55 years with a body fat rate of 30% or more to determine the effects of blood

• The fundamental relation between the forces acting on a rigid body in plane motion and the acceleration of its mass center and the angular acceleration of the body is

Changes in body composition, health status, and dietary behavior for middle-aged obese women in a weight control program at a community health center.. Changes

Bone mineral content (BMC) and bone mineral density (BMD) of the lumbar spine, total hip, and proximal femur were measured before and after exercise... Results : 1) Body

Analysis of body characteristics on olive flounder ( Paralichthys oilvaceus ) fed on the extruded and moist pellets (body weight, body length, body height and body width) · ·