대한비만학회지: 제 13 권 제 3 호 2004 □ 종 설 □
- 171 - Body composition is now a popular topic in Japan because most Japanese have become aware that obe- sity is a serious health problem increasing the risk of developing coronary artery disease, hypertension, diabetes and other health disorders. In Japan, anal- ysis of body composition started in the 1960's mai- nly in the field of exercise and sports sciences.
Densitometry, skinfold caliper method and ultrasound visualization has been the most widely used methods for the estimation of body composition.
Estimating body composition
The underwater weighing method has been the most common method of densitometry. But the spring scale that is typically used for the measu- rement of the underwater weight, does not allow a precise measurement. To improve the precision, a computerized apparatus was developed. The use of this computerized apparatus, however, was limited only in the specialized research laboratories. For a better public access, we developed a portable-type ultrasound apparatus to measure subcutaneous fat thickness. Based on the pre-calibrated estimation equation that is programmed in the apparatus, the body fatness is computed automatically upon the completion of measurement. Skinfold caliper is still a popular apparatus in Japan. It, however, does not
allow a reliable and valid estimation of the body fat for special populations, such as athletes and different age groups, although we have developed some new equations for children, adults of 20 to 59 years old and young athletes.
Physical fitness of obese person
An obese person typically scores low in a physical fitness test, for example, of vertical jump, 50 m run and endurance run. Does this poor physical fitness reflect poor physical functions of muscle and/or the respiratory-cardiovascular system? In order to describe the relations between physical fitness level and body fatness, jumping reaction time, muscle strength, ana- erobic power output and maximum oxygen uptake were measured from obese males. All the subjects were young students aged 18 to 25 years old. As obesity was defined as “excessive enlargement of the body's total quantity of fat”, over 20% of body fat for men and 30% for women were used as the criteria for obesity in the study. Jumping reaction time, EMG reaction time, movement time and whole body reaction time were measured from each sub- ject. Isometric muscle strength was also measured on hand-grip, elbow flexion, trunk extension and knee extension. In addition, anaerobic power output was measured by the staircase climb test and VO
2max
Obesity and Weight Control
Kaoru Kitagawa
Laboratory for Exercise Physiology and Biomechanics, School of Health and Sport Sciences, Chukyo University, Japan
- 대한비만학회지: 제 13 권 제 3 호 2004 -
- 172 - and the related variables were measured by treadmill running. From the limited scope of our findings about physical fitness of obese males, the results seems to suggest that obesity itself does not affect the intrinsic ability of neuro-muscular and respira- tory-cardiovascular functions and that the excess fat of obese males only acted like an inactive load that decreased their physical fitness.
Changes with age in body composition of Japanese
There has been no reliable longitudinal-study conducted to examine the age-related changes of body composition among Japanese, whereas the previous study discussed the body composition changes among British and American populations. In order to determine a reasonable national standard in body composition among Japanese population, the sample of subjects selected for a study should not
differ in body height and weight by any more than 1 SD for the mean of the given age category cited in the Japanese Ministry of Education
Annual Report. Body composition was estimated by densitometry using the underwater-weighing method and pulmonary residual volume measurement. The percentage of body fat was computed from the body density based on the equation of Lohman et al. for prepubescent subjects, and the equation of Brozek et al. for adults. For the aged subjects of 60 to 76 years old, the density of lean body weight was also measured by the DEXA in order to examine whether or not densitometry could be applied to this popul- ation. Their densities resulted in 1.0950±0.0036 g/mL for males and 1.0957±0.0032 g/mL for females, which were quite similar to the 1.1 g/mL for adults proposed by Siri and Brozek et al. We, therefore, decided to apply the equation of Brozek et al. for the aged subjects.
The results of the study (Fig. 1) showed that body
Fig. 1. Changes in Body Weight and Composition with Age0 10 20 30 40 50 60
70 BODY WEIGHT
FAT LEAN BODY WEIGHT
(kg) MALES
0 10 20 30 40 50 60 70
BODY WEIGHT
FAT LEAN BODY WEIGHT
(kg) FEMALES
0 40
%FAT (%)
0 10 20 30 40
%FAT (%)
10 20 30 0 10 20 30 40 50 60 70
0 10 20 30 40 50 60
70 BODY WEIGHT
FAT LEAN BODY WEIGHT
(kg) MALES
0 10 20 30 40 50 60 70
0 10 20 30 40 50 60 70
BODY WEIGHT
FAT LEAN BODY WEIGHT
(kg) FEMALES
0 40
%FAT (%)
0 10 20 30 40 50 60 70 80 AGE
0 10 20 30 40 50 60 70 80 (yrs.)
0 10 20 30 40
10 20 30 40
%FAT (%)
10 20 30
10 20 30
0 10 20 30 40 50 60 70 80 AGE
0 10 20 30 40 50 60 70 80 (yrs.) 0
10 20 30 40 50 60 70
0 10 20 30 40 50 60
70 BODY WEIGHT
FAT LEAN BODY WEIGHT
(kg) MALES
0 10 20 30 40 50 60 70
0 10 20 30 40 50 60 70
BODY WEIGHT
FAT LEAN BODY WEIGHT
(kg) FEMALES
0 40
%FAT (%)
0 10 20 30 40
10 20 30 40
%FAT (%)
10 20 30
10 20 30 0 10 20 30 40 50 60 70
0 10 20 30 40 50 60
70 BODY WEIGHT
FAT LEAN BODY WEIGHT
(kg) MALES
0 10 20 30 40 50 60 70
0 10 20 30 40 50 60 70
BODY WEIGHT
FAT LEAN BODY WEIGHT
(kg) FEMALES
0 40
%FAT (%)
0 10 20 30 40 50 60 70 80 AGE
0 10 20 30 40 50 60 70 80 (yrs.)
0 10 20 30 40
10 20 30 40
%FAT (%)
10 20 30
10 20 30
0 10 20 30 40 50 60 70 80 AGE
0 10 20 30 40 50 60 70 80 (yrs.)
- Obesity and Weight Control -
- 173 - weight, lean body weight and fat increased during adolescence, and in particular, a large increase was evident in body weight and lean body weight among males. The difference in body weight between males and females after the young adult stage seems to derive from a difference in lean body weight. The lean body weight of males decreased gradually from the young adult stage to the aged stage; the average decrement was calculated to be 3.7% per decade.
Females did not show the clear change in lean body weight after the young adult stage. Fat continuously increased at a constant rate from the prepubescent to the aged stage in both sexes. The average increment was 6.2% per decade for males and 16.1% for females. The changing pattern of body composition in Japanese was very similar to that reported on British and American populations, but the decrement in lean body weight and increments in fat and percent body fat of this study were different from
British and American populations. Judging from Fig 1, it is about 50 years old for average Japanese males to become obese and about 60 years for females.
Energy expenditure of sports activity
Regular aerobic exercise brings about favorable changes in body weight and body composition.
Walking, jogging and cycling are recommended for weight reduction.
Because they do not require a specialized training or equipment, they are relatively safe to perform and it is easy to estimate energy expenditure. Simple and repetitive nature of these exercises, however, often makes the performer feel too tiresome to continue the exercise. Recreational sports and games are more attractive than these exercises. For the recreational sports and games, however, it is difficult to deter-
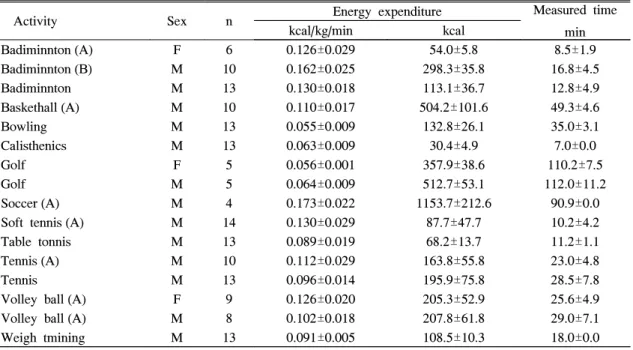
Table 1. Energy Expenditure in Recreational and Sports Activity Measured Continuously by the Portable Type Apparatus
Activity Sex n Energy expenditure Measured time
kcal/kg/min kcal min
Badiminnton (A) F 6 0.126±0.029 54.0±5.8 8.5±1.9
Badiminnton (B) M 10 0.162±0.025 298.3±35.8 16.8±4.5
Badiminnton M 13 0.130±0.018 113.1±36.7 12.8±4.9
Baskethall (A) M 10 0.110±0.017 504.2±101.6 49.3±4.6
Bowling M 13 0.055±0.009 132.8±26.1 35.0±3.1
Calisthenics M 13 0.063±0.009 30.4±4.9 7.0±0.0
Golf F 5 0.056±0.001 357.9±38.6 110.2±7.5
Golf M 5 0.064±0.009 512.7±53.1 112.0±11.2
Soccer (A) M 4 0.173±0.022 1153.7±212.6 90.9±0.0
Soft tennis (A) M 14 0.130±0.029 87.7±47.7 10.2±4.2
Table tonnis M 13 0.089±0.019 68.2±13.7 11.2±1.1
Tennis (A) M 10 0.112±0.029 163.8±55.8 23.0±4.8
Tennis M 13 0.096±0.014 195.9±75.8 28.5±7.8
Volley ball (A) F 9 0.126±0.020 205.3±52.9 25.6±4.9
Volley ball (A) M 8 0.102±0.018 207.8±61.8 29.0±7.1
Weigh tmining M 13 0.091±0.005 108.5±10.3 18.0±0.0
A: athlete, M: male, F: female (mean±SD)
- 대한비만학회지: 제 13 권 제 3 호 2004 -
- 174 - mine energy expenditure precisely and the most values of energy expenditure listed in the textbooks are measured by conventional Douglas bag method that could not measure vigorous and continuous sports activity. So we measured the energy expen- diture of some vigorous sports activities using a portable-type apparatus. As shown in Table 1, athl- etes showed higher values of energy expenditure than recreational players. This is probably due to the difference in their effectiveness of utilizing the body parts for maximizing the performance outcome. The results suggest that the energy expenditure during the vigorous sports activities is affected by the individual sports ability.
Effects of physical activity on weight reduction
Regular aerobic exercise brings about favorable changes: reducing body weight and fat while maintaining lean body weight. Amount of fat burned due to physical activity, however, is small. For example, one-hour walk burned at most 20 g of fat
(fifty hours of walk is required to lose 1 kg of body fat!) Based on this datum, it is suggested that an exercise program should be continued for at least three to four months for reducing body weight and
fat. Our program for obese middle aged males: 90 minute bicycling consuming 300 kcal with intensity of 60% HRmax, three times a week and 14 weeks reduced averaged 1.4 kg of body fat of which inte- rnal fat was 0.2 kg.
People in the developed countries have lost their purpose to move in order to obtain food. Human being will not want to move and will keep energy in his body for starvation. So it will be still controversy whether or not physical activity plays a definite role to improve obesity even if everybody knows the positive effects of physical activity on body.
Reference