plement public health screening programs to detect illnesses at an early stage, improve patient outcomes, prevent disease, and pro- mote health [1]. Since the prevalence of cancer and cancer-related mortalities are increasing, cancer screening is one of the most im- portant objectives in health screening programs [2]. Korean op- portunistic screening programs include cancer screening and measurement of tumor markers such as prostate-specific antigen, alpha-fetoprotein, carcinoembryonic antigen (CEA), and cancer antigen (CA) 19-9, which are similar to the programs implemented in other East Asian countries [3, 4].
CEA is useful for determining a patient’s prognosis, for surveil- lance following curative resection, and for monitoring response to therapy among patients with colorectal cancer [5]. Most of the guidelines from the American Society of Clinical Oncology, the European Group on Tumor Markers, and the National Academy of Clinical Biochemistry do not recommend tumor marker testing
INTRODUCTION
Despite controversies regarding the expense and ineffective- ness of health screening programs, many countries routinely im-
건강검진 기관에서 관찰되는 암태아성 항원의 위양성 상승
False-positive Elevations in Carcinoembryonic Antigen Levels at a Health Screening Center
정소이
Soie Chung, M.D.
서울대학교병원 헬스케어시스템 강남센터 진단검사의학과, 헬스케어 연구소
Department of Laboratory Medicine and Healthcare Research Institute, Healthcare System Gangnam Center, Seoul National University Hospital, Seoul, Korea
Vol. 9, No. 3: 146-152, July 2019
https://doi.org/10.3343/lmo.2019.9.3.146 진단면역학
Corresponding author: Soie Chung, M.D.
https://orcid.org/0000-0002-4528-1534
Department of Laboratory Medicine, Seoul National University Hospital Healthcare System Gangnam Center, 39th Fl. GFC, 152 Teheran-ro, Gangnam-gu, Seoul 06236, Korea
Tel: +82-2-2112-5686, Fax: +82-2-2112-5794, E-mail: [email protected] Received: June 19, 2018
Revision received: August 20, 2018 Accepted: August 21, 2018
This article is available from http://www.labmedonline.org 2019, Laboratory Medicine Online
This is an Open Access article distributed under the terms of the Creative Commons Attribution Non-Commercial License (http://creativecommons.org/licenses/by-nc/4.0/) which permits unrestricted non-commercial use, distribution, and reproduction in any medium, provided the original work is properly cited.
Background: Although routine screening of carcinoembryonic antigen (CEA) is not recommended for the early diagnosis of colorectal cancers, CEA levels are frequently measured in practice and during opportunistic health screening programs. We evaluated the frequency of false-positive results according to CEA level at a health screening center.
Methods: The medical records of 25,786 participants who underwent a general health check-up and CEA testing at the Seoul National University Hospital Healthcare System Gangnam Center from March 2015 to February 2016 were reviewed. CEA levels were measured using the Architect i2000sr (Abbott Laboratories, USA). The cut-off level for elevated CEA was 5.0 ng/mL.
Results: Among 25,786 participants who underwent CEA screening, 597 (2.3%) had CEA levels >5.0 ng/mL. Among 597 participants with ele- vated CEA levels, 12 (2.0%) had actual malignancies with CEA levels of 8.3–155.3 ng/mL. Diabetes, smoking, chronic obstructive pulmonary dis- ease, and colonic polyps were considered as causes of false elevation. The false-positive rates of CEA according to level were as follows: 5.1–10.0 ng/mL, 99.5%; 10.1–15.0 ng/mL, 87.2%; 15.1–20.0 ng/mL, 100.0%; >20.0 ng/mL, 33.3%. A subsequent decrease in the CEA level after a 1-month follow-up was observed in 47.6% of all cases with elevated CEA levels.
Conclusions: False elevation in CEA levels in the range of 5.0–20.0 ng/mL is common in patients who underwent testing at a health screening center. False-positive results above 20.0 ng/mL are less common. These data could provide a guide for the interpretation of elevated CEA level at a health screening center.
Key Words: Carcinoembryonic antigen, Mass screening, Biomarkers, Tumor
2017-03-16 https://crossmark-cdn.crossref.org/widget/v2.0/logos/CROSSMARK_Color_square.svg
for cancer screening due to false elevation associated with various benign conditions. However, the levels of tumor markers are of- ten measured in opportunistic screening programs or evaluated in clinical practice. Thus, there is a definite gap between the stance of the authorities and the routine clinical practice. However, there are no specific clinical guidelines in the screening of elevated CEA levels in apparently healthy people. Elevated CEA levels of- ten lead to unnecessary and extensive workups such as colonos- copy, low-dose chest computed tomography (LDCT), abdominal CT, and mammogram, which are often performed to determine whether colorectal cancer (CRC), lung cancer, or breast cancer is present, respectively.
Our health screening center, the Seoul National University Hos- pital Healthcare System Gangnam Center, provides comprehen- sive medical checkups and screening, including endoscopic ex- aminations and imaging studies, and nearly 20,000 people visit our center every year [6].
Although it is well-known that false CEA elevations occur [7], the frequency and range of these false-positive results have not been well described in a modern health screening center with high-quality imaging capabilities. In this study, we collected and analyzed the data from our health screening center to evaluate whether follow-up or further examination following elevated CEA levels is necessary for apparently healthy people.
MATERIALS AND METHODS
1. Study population
The medical records of 25,786 persons who underwent a gen- eral health checkup and CEA testing at the Seoul National Univer- sity Hospital Healthcare System Gangnam Center from March 2015 to February 2016 were reviewed. The study protocol was re- viewed and approved by the institutional review board of Seoul National University Hospital (IRB no. H-1606-013-770). Since the current study was performed as a retrospective study using data- base and medical records, informed consent was waived by the board. The follow-up data were reviewed until December 2017 to monitor for the presence of malignancy.
2. Demographic characteristics, anthropometric data and laboratory findings
Demographic characteristics and anthropometric data were ob-
tained using medical questionnaires, nurse interviews, and health examinations. Data about body mass index (BMI), white blood cell count (WBC), hemoglobin (Hb), platelet count (PLT), glycated hemoglobin (HbA1c), fasting blood sugar (FBS), serum creatinine (Cr), aspartate aminotransferase (AST), alanine aminotransferase (ALT), high-sensitivity C-reactive protein (hs-CRP), and CEA were obtained from the medical records. Blood samples were taken af- ter at least a 12-hour fasting. The serum samples were collected in a tube with a clot activator and serum gel separator. Centrifuga- tion was performed at 3,000 rpm for 10 minutes within 30 min- utes of blood draw to prevent glycolysis. WBC, Hb, and PLT were analyzed using an Advia 2120 hematology analyzer (Siemens, Tar- rytown, NY, USA). FBS, serum Cr, AST, ALT, and hs-CRP were measured using an ARCHITECT Ci8200 (Abbott Laboratories, Ab- bott Park, IL, USA). HbA1c was measured using an ADAMS HA 8160 analyzing system (ARKRAY Inc., Kyoto, Japan). CEA was measured with an ARCHITECT i2000sr (Abbott Laboratories) uti- lizing a chemiluminescent microparticle immunoassay (CMIA).
The cut-off level for elevated CEA was defined as 5 ng/mL after validation of reference ranges provided by the manufacturer (0.0–
5.0 ng/mL). Serial dilution to exclude spurious elevation caused by interaction with heterophilic antibody was performed when CEA level was over 10.0 ng/mL. One month follow-up of CEA lev- els was performed in participants with elevated CEA. Decrease in the CEA level was defined as 10% decrease from the initial test or CEA level below 5.0 ng/mL in the follow-up test. There was no standardized protocol workup for elevated CEA, and subsequent investigations or follow-up after 1 month follow-up were often de- cided by the attending physician. These procedures included colonoscopy, esophagogastroduodenoscopy, abdominal ultraso- nography (USG) or CT, LDCT, and mammograms or breast USG.
3. Statistical analysis
All statistical analyses were performed using the Statistical Pack- age for the Social Sciences (SPSS) 22.0 for Windows (SPSS, Chi- cago, IL, USA) and MedCalc for Windows version 16.8.4.0 (Med- Calc Software, Mariakerke, Belgium). All statistical outcomes were based on two-sided tests and P values <0.05 were significant.
For continuous variables, data were expressed as medians (in- terquartile ranges) when their distributions were not normal ac- cording to the Kolmogorov-Smirnov test (P<0.001). Data were expressed as means (SD) when they showed normal distributions.
Pearson’s chi-square test was performed to compare the propor- tional differences in men and women, in participants’ smoking habits, and in fecal immunochemical test (FIT) results among CEA subgroups. Independent-sample t-test was performed to compare age, BMI, and levels of WBC, PLT, HbA1c, FBS, serum creatinine, AST, ALT, hs-CRP, and CEA among HbA1c subgroups.
RESULTS
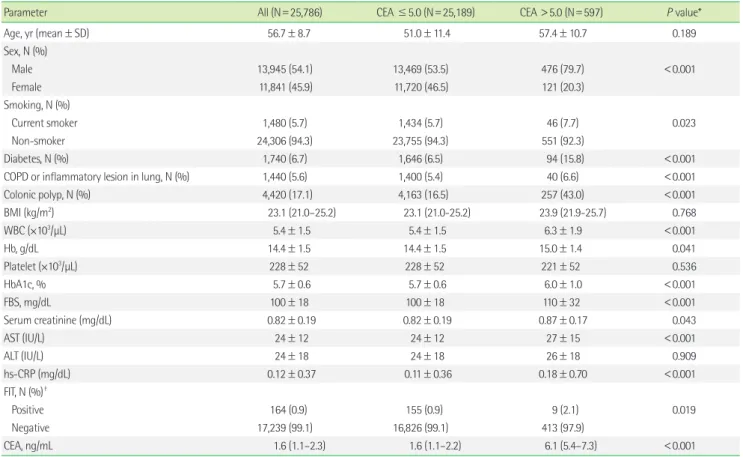
The demographic characteristics of all participants and sub- groups according to CEA level are shown in Table 1. The median and interquartile ranges of the CEA level of all participants was 1.6 (1.1–2.3). Among the 25,786 participants who underwent CEA testing, 597 (2.3%) had CEA levels >5.0 ng/mL. Subgroups were divided according to CEA level: CEA ≤5.0 (N=25,189) and CEA
>5.0 (N=597). Mean age and levels of WBC, Hb, HbA1c, FBS, se- rum Cr, AST, and hs-CRP were significantly higher in the elevated
CEA group. The percentages of male participants, smokers, par- ticipants with diabetes, participants with chronic obstructive pul- monary disease (COPD) or inflammatory lesion in the lungs, par- ticipants with colonic polyp, and participants with positive FIT were also higher in the elevated CEA group.
Among the 597 participants with elevated CEA levels, 12 (2.0%) had actual malignancies, including colorectal (N=5), lung (N=4), breast (N=1), and pancreatobiliary cancer (N=2) (Table 2). Colonic polyp, diabetes, smoking, COPD, and inflammatory lesions of the lung were the benign conditions associated with elevations in CEA levels. However, 38.2% of participants had elevated CEA lev- els but no specific clinical condition related to CEA elevation, and 53.5% of these participants had normal CEA levels at the 1-month follow-up test.
To investigate the clinical utility of CEA in cancer screening, case reviews were performed among patients with elevated CEA levels and malignancy (Table 3). Four participants were known
Table 1. Characteristics of the study population
Parameter All (N=25,786) CEA ≤5.0 (N=25,189) CEA >5.0 (N=597) P value*
Age, yr (mean±SD) 56.7±8.7 51.0±11.4 57.4±10.7 0.189
Sex, N (%)
Male 13,945 (54.1) 13,469 (53.5) 476 (79.7) <0.001
Female 11,841 (45.9) 11,720 (46.5) 121 (20.3)
Smoking, N (%)
Current smoker 1,480 (5.7) 1,434 (5.7) 46 (7.7) 0.023
Non-smoker 24,306 (94.3) 23,755 (94.3) 551 (92.3)
Diabetes, N (%) 1,740 (6.7) 1,646 (6.5) 94 (15.8) <0.001
COPD or inflammatory lesion in lung, N (%) 1,440 (5.6) 1,400 (5.4) 40 (6.6) <0.001
Colonic polyp, N (%) 4,420 (17.1) 4,163 (16.5) 257 (43.0) <0.001
BMI (kg/m2) 23.1 (21.0–25.2) 23.1 (21.0-25.2) 23.9 (21.9-25.7) 0.768
WBC (×103/µL) 5.4±1.5 5.4±1.5 6.3±1.9 <0.001
Hb, g/dL 14.4±1.5 14.4±1.5 15.0±1.4 0.041
Platelet (×103/µL) 228±52 228±52 221±52 0.536
HbA1c, % 5.7±0.6 5.7±0.6 6.0±1.0 <0.001
FBS, mg/dL 100±18 100±18 110±32 <0.001
Serum creatinine (mg/dL) 0.82±0.19 0.82±0.19 0.87±0.17 0.043
AST (IU/L) 24±12 24±12 27±15 <0.001
ALT (IU/L) 24±18 24±18 26±18 0.909
hs-CRP (mg/dL) 0.12±0.37 0.11±0.36 0.18±0.70 <0.001
FIT, N (%)†
Positive 164 (0.9) 155 (0.9) 9 (2.1) 0.019
Negative 17,239 (99.1) 16,826 (99.1) 413 (97.9)
CEA, ng/mL 1.6 (1.1–2.3) 1.6 (1.1–2.2) 6.1 (5.4–7.3) <0.001
Values were presented as mean (SD), median (interquartile range), or number (percentage).
*CEA ≤5.0 vs. CEA >5.0 ng/mL; †Data were missing in 8,383 participants.
Abbreviations: CEA, carcinoembryonic antigen; COPD, chronic obstructive pulmonary disease; BMI, body mass index; Hb, hemoglobin; HbA1c, glycated hemoglobin; FBS, fast- ing blood sugar; AST, aspartate aminotransferase; ALT, alanine aminotransferase; FIT, fecal immunochemical test; CEA, carcinoembryonic antigen; CA 19-9, cancer antigen 19-9.
cancer patients on monitoring, and seven were newly diagnosed with colorectal, lung, or breast cancer at checkup. The range of CEA levels in these patients newly diagnosed with malignancies was 8.3–155.3 ng/mL. The diagnoses of the four newly diagnosed colorectal cancer patients had their diagnoses confirmed by an additional colonoscopic examination after the initial test showed elevated CEA levels. Among the four participants with elevated CEA levels who were newly diagnosed with colorectal cancer, three had FIT-positive results and one had FIT-negative results.
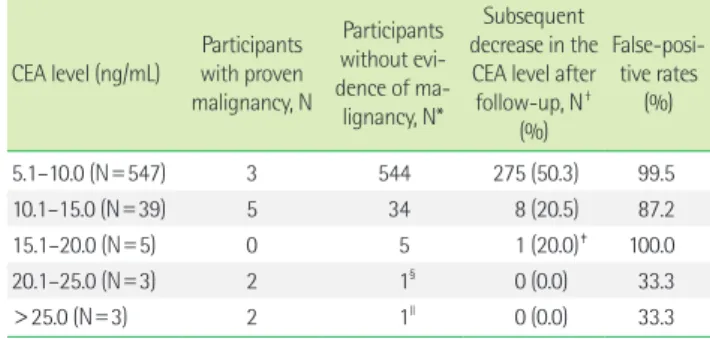
Among 585 participants who had elevated CEA levels and no evidence of malignancy, 544 (93.0%) had a CEA level of 5.1–10.0 ng/mL, 34 (5.7%) had 10.1–15.0 ng/mL, 5 (0.9%) had 15.1–20.0 ng/
mL, 1 (0.2%) had 20.1–25.0 ng/mL, and 1 (0.2%) had 25.1–30.0 ng/
mL (Table 4). In 544 participants with CEA levels of 5.1–10.0 ng/mL with no malignancy, 275 (50.6%) had a subsequent decrease in the CEA level at 1-month follow-up. Among 34 participants with CEA levels of 10.1–15.0 ng/mL with no malignancy, 8 (20.5%) had a subsequent decrease in the CEA level at 1-month follow-up. A follow-up test was performed in two participants after smoking cessation, in one participant after removal of colorectal adenoma- tous polyps, and two participants after discontinuing herbal med- icine. Five (20.0%) participants with CEA levels between 15.1 and 20.0 ng/mL and no malignancy were identified as current smok- ers. Only 1 (20.0%) participant were able to quit smoking and show ed a decrease in CEA levels (9.9 ng/mL) at 1-month follow-up. Two participants with a CEA level ≥20.1 ng/mL and without malig- nancy did not show a decrease in the CEA level at follow-up. Of Table 4. False-positive rates of CEA according to level (N=597)
CEA level (ng/mL) Participants with proven malignancy, N
Participants without evi- dence of ma-
lignancy, N*
Subsequent decrease in the CEA level after follow-up, N†
(%)
False-posi- tive rates
(%)
5.1–10.0 (N=547) 3 544 275 (50.3) 99.5
10.1–15.0 (N=39) 5 34 8 (20.5) 87.2
15.1–20.0 (N=5) 0 5 1 (20.0)‡ 100.0
20.1–25.0 (N=3) 2 1§ 0 (0.0) 33.3
>25.0 (N=3) 2 1ll 0 (0.0) 33.3
*No evidence of cancer on low-dose chest computed tomography (CT), abdomen CT, thyroid ultrasonography, colonoscopy, and esophagogastroduodenoscopy; †The percentage of decrease in the CEA level after follow-up according to each CEA level group; ‡The initial and follow-up levels of CEA were 19.6 and 9.9 ng/mL, re- spectively; §The participant’s CEA level was 20.8 ng/mL; llThe participant’s CEA level was 30.4 ng/mL.
Abbreviation: CEA, carcinoembryonic antigen.
Table 2. Diagnosis of patients with elevated carcinoembryonic antigen levels
Diagnosis No. of participants
(%) CEA
(ng/mL)
Colorectal cancer 5 (0.8) 11.8 (9.8–17.0)
Lung cancer 4 (0.7) 16.9 (11.1–24.2)
Breast cancer 1 (0.2) N/A
Pancreatobiliary cancer 2 (0.3) N/A
Colonic polyp 223 (37.4) 6.0 (5.3–6.9)
Diabetes 38 (6.4) 6.3 (5.4–7.6)
Diabetes and colonic polyp 10 (1.7) 7.5 (5.8–11.5)
Diabetes and smoking 22 (3.7) 6.6 (5.7–8.5)
Diabetes, smoking, and colonic polyp 24 (4.0) 6.0 (5.3–6.7) COPD or inflammatory lesion in the lung 40 (6.6) 5.7 (5.5–7.0) No specific clinical condition 228* (38.2) 5.9 (5.3–7.4)
Total 597 (100.0) 6.1 (5.4–7.3)
*The carcinoembryonic antigen level of 122 out of 228 participants (53.5%) nor- malized in a follow-up test.
CEA levels were presented as median (interquartile ranges).
Abbreviations: CEA, carcinoembryonic antigen; COPD, chronic obstructive pulmo- nary disease; N/A, not applicable.
Table 3. Case reviews for elevated carcinoembryonic antigen levels with malignancy
No. Sex Age CEA (ng/mL) Diagnosis FIT History of smoking
38062 M 54 21.8 Colorectal cancer, newly diagnosed Positive Ex-smoker
21494 M 86 9.9 Colorectal cancer, newly diagnosed Positive Non-smoker
8052 F 73 11.8 Colorectal cancer, newly diagnosed Positive Non-smoker
31435 M 65 12.1 Colorectal cancer, newly diagnosed Negative Ex-smoker
41541 M 77 25.5 Lung cancer, newly diagnosed N/A Current smoker
48991 M 65 10.3 Lung cancer, newly diagnosed N/A Non-smoker
13491 F 61 8.3 Breast cancer, newly diagnosed N/A Non-smoker
18613 M 77 155.3 Cholangiocarcinoma, newly diagnosed N/A Ex-smoker
10798 F 76 9.6 Colorectal cancer, on monitoring N/A Non-smoker
40687 M 45 13.5 Lung cancer, disease progression N/A Ex-smoker
27469 F 71 20.3 Lung cancer, disease progression N/A Non-smoker
35923 M 61 12.7 Pancreatic cancer, disease progression N/A Non-smoker
Abbreviations: CEA, carcinoembryonic antigen; FIT, fecal immunochemical test; N/A, not applicable.
these two participants, one had patchy ground-glass opacities on LDCT, suggesting inflammation, while no specific conditions were detected in the other patient on esophagogastroduodenoscopy, colonoscopy, LDCT, abdominal CT, or thyroid USG that may ex- plain the elevated CEA levels.
Further follow-up CEA test were performed in participants who did not show a decrease in CEA levels at 1-month follow-up. The proportions of participants who showed a decrease in CEA levels in further follow-up were analyzed according to their clinical con- ditions: colonic polyp, 19/35 (54.3%); smoking, 22/41 (53.7%); CO- PD or inflammatory lesion in lung 30/58 (51.7%); diabetes, 12/28 (42.9%); diabetes and colonic polyp, 3/10 (33.3%); diabetes and smoking; 15/25 (60.0%); and diabetes, smoking, and colonic polyp, 14/24 (58.3%).
The false-positive rates of CEA according to their levels were as follows: 5.1–10.0 ng/mL, 99.5%; 10.1–15.0 ng/mL, 87.2%; 15.1–20.0 ng/mL, 100.0%; 20.1–25.0 ng/mL, 33.3%; and >25.0 ng/mL, 33.3%.
Using a CEA cut-off value of 20.0 ng/mL, the negative predictive value and positive predictive value for detecting malignancy were 100.0% and 66.7%, respectively.
DISCUSSION
We investigated the causative clinical conditions for elevated CEA in a health screening center. Although the limited value of CEA in cancer screening is well understood, 4 of the 25,786 par- ticipants were diagnosed with colorectal cancer after detection of elevated CEA level. Of the four newly diagnosed colorectal cancer patients, only one showed negative FIT results, which indicated low sensitivity for advanced colorectal cancer [8].
Although false-positive CEA levels frequently occur, their fre- quency and range have not been previously well characterized in a health screening context. Indeed, CEA for cancer screening is included in nearly all Korean opportunistic health checkups; how- ever, there is no specific clinical guideline recommending the performance of follow-up test or further work-up for elevated CEA in apparently healthy people. One report by Litvak et al. de- scribed false-positive elevations in 728 patients who underwent resection of locoregional colorectal cancer and who had an in- crease in CEA level during follow-up [7]. This could not be directly applied since the subject population was different from that of a health screening setting. The present study provides the first large,
modern data set for determining the frequency and range of false- positive CEA measurements in a health screening setting.
In our study, false-positive rates of CEA in the screening of can- cer were much higher when CEA levels were ≤20.0 ng/mL. Most of the false-positive elevations in CEA levels were below 10.0 ng/
mL. Approximately 50.6% of falsely elevated CEA at the ≤10.0 ng/mL level showed a subsequent decrease in CEA levels on fol- low-up test. Persistent CEA levels over 31.0 ng/mL were all true positive.
Several clinical conditions have been reported to be related to CEA elevation, including COPD [9], pneumonia [10], and colonic polyps [11], as observed in our study. In our study, diabetes was present in 15.7% of participants with elevated CEA levels. Further- more, the FBS and HbA1c levels were higher in the elevated CEA group than in the normal CEA group. Similarly, a previous study showed that subjects with type 2 diabetes mellitus had a higher CEA level than healthy controls [12]. Furthermore, HbA1c posi- tively correlated with CEA in patients with diabetes [13]. The patho- physiologic explanation for the association between elevated CEA levels and glycemic control is unknown. It has been hypothesized to be an increased cancer risk in patients with diabetes either due to tumor cell proliferation or to inflammatory changes associated with diabetes [12].
False elevation of CEA caused by smoking in our study popula- tion showed levels up to 19.6 ng/mL. A previous study showed in- creases in CEA mRNA expression and protein expression in the lung tissue of smokers compared with those in non-smokers and ex-smokers [14], and this result supports our finding of elevated CEA levels in smokers. In addition, smoking cessation was shown to decrease serum CEA levels [15], which was also observed in our study.
The mechanism for increase in CEA levels in participants with colonic polyp has not been elucidated yet. However, previous study by Tong et al. [16] reported that the recurrence of colorectal polyp was related to serum CEA levels. Since colorectal cancer primarily arises from the polyps of the colon and CEA is a product of columnar and goblet cells in the normal colon and colonic can- cer, the serum levels of CEA might increase 4.5 to 8 months before the development of cancer symptoms.
The false-positive rate of CEA for detecting cancer was only 33.3% when the CEA levels were above 20 ng/mL by the ARCHI- TECT i2000sr. There was no false-positive elevation of CEA levels
over 30.4 ng/mL. In particular, 47.6% of patients with elevated CEA levels showed a decrease in CEA levels at 1-month follow-up.
This phenomenon was much more prevalent for CEA levels of 5.1–10.0 ng/mL (50.3%). Therefore, follow-up testing instead of initial extensive workup for elevated CEA could be an alternative method of excluding malignancy. Particularly in smokers, follow- up testing after smoking cessation would prevent further unnec- essary CT or endoscopic examinations.
Although only 2.0% of participants with elevated CEA had ma- lignancy, 4 (33.3%) colorectal cancer patients were newly diag- nosed on further workup. Among these patients, one colorectal cancer patient showed a negative FIT result; therefore, additional colonoscopy was performed solely due to elevated CEA levels and detected colorectal cancer.
A limitation of this study was that the measurement method for CEA is not yet standardized [17]; therefore, the cut-off value de- scribed in this study cannot be universally utilized. It could only be utilized in a center using the ARCHITECT i2000sr. Further- more, there was no standardized work up protocol for elevated CEA. Therefore, further follow-up or investigations were often de- cided by the attending physician.
Our data suggested that slight elevation in the CEA level (≤20.0 ng/mL) has a substantial likelihood of representing a false-posi- tive elevation using i2000sr as a measurement method in an ap- parently healthy person in a health screening center. However, serum CEA levels greater than 20.0 ng/mL are predictive of malig- nancy; therefore, diagnostic procedures should be performed im- mediately. These data could provide a guide for the interpretation of elevated CEA levels detected at a health screening center.
요 약
배경: 대장암의 조기진단을 위해 암태아성 항원(carcinoembry- onic antigen, CEA)을 선별검사로 사용하는 것은 추천되지 않으나, 실제 진료실 및 일반 건강검진 프로그램에서 CEA 수치를 빈번히 측정하고 있다. 본 연구에서는 건강검진 기관에서 관찰되는 CEA 위양성 빈도를 CEA 수치에 따라 분석하였다.
방법: 2015년 3월부터 2016년 2월까지 서울대학교병원 강남센터에 서 건강검진을 받은 25,786명을 대상으로 의무기록을 분석하였다.
CEA는 ARCHITECT i2000sr (Abbott Laboratories, USA)로 측정하 였다. CEA 상승 기준은 5.0 ng/mL를 초과하는 경우로 정하였다.
결과: 25,786명 중 597명(2.3%)이 CEA 수치가 5.0 ng/mL를 초과하
였다. 이 중, 12명(2.0%)은 악성종양이 있었으며 CEA 수치 분포는 8.3-155.3 ng/mL이었다. 당뇨병, 흡연, 만성폐쇄성폐질환, 대장 용종 이 거짓 상승의 요인으로 추정되었다. CEA 수치에 따른 위양성률 은 다음과 같다: 5.1–10.0 ng/mL, 99.5%; 10.1–15.0 ng/mL, 87.2%;
15.1–20.0 ng/mL, 100.0%; >20.0 ng/mL, 33.3%. CEA가 상승한 사 람들 중 47.6%는 1개월 후 추적 시 그 수치가 감소하였다.
결론: 건강검진 수진자에서 CEA 수치는 5.0–20.0 ng/mL까지 거짓 상승되는 경우가 흔하며, 20.0 ng/mL를 초과하는 위양성은 덜 흔 하게 관찰된다. 본 연구의 결과는 건강검진 수진자에서 CEA 수치 가 상승된 경우의 해석에 참고할 수 있겠다.
AUTHORS’ DISCLOSURES OF POTENTIAL CONFLICTS OF INTEREST
No potential conflicts of interest relevant to this article were re- ported.
REFERENCES
1. Fenton JJ, Cai Y, Weiss NS, Elmore JG, Pardee RE, Reid RJ, et al. Deliv- ery of cancer screening: how important is the preventive health exam- ination? Arch Intern Med 2007;167:580-5.
2. Lee TW, Lee CY, Kim HS, Ham OK. Health promotion health center project. Public Health Nurs 2007;24:529-37.
3. Lee JH, Hong SP, Jeon TJ, Kang GH, Choi WC, Jeon SM, et al. Should a colonoscopy be recommended for healthy individuals with increased carcinoembryonic antigen levels? A case-control study. Dig Dis Sci 2011;
56:2396-403.
4. Lim YK, Kam MH, Eu KW. Carcinoembryonic antigen screening: how far should we go? Singapore Med J 2009;50:862-5.
5. Sturgeon CM, Diamandis EP, et al. eds. Use of tumor markers in testic- ular, prostate, colorectal, breast, and ovarian cancers. Washington, D.C.:
American Association for Clinical Chemistry, 2009:27-36.
6. Lee C, Choe EK, Choi JM, Hwang Y, Lee Y, Park B, et al. Health and Prevention Enhancement (H-PEACE): a retrospective, population-based cohort study conducted at the Seoul National University Hospital Gang- nam Center, Korea. BMJ Open 2018;8:e019327.
7. Litvak A, Cercek A, Segal N, Reidy-Lagunes D, Stadler ZK, Yaeger RD, et al. False-positive elevations of carcinoembryonic antigen in patients with a history of resected colorectal cancer. J Natl Compr Canc Netw 2014;12:907-13.
8. Jung YS, Park CH, Kim NH, Park JH, Park DI, Sohn CI. Clinical risk
stratification model for advanced colorectal neoplasia in persons with negative fecal immunochemical test results. PLoS One 2018;13:e0191125.
9. Sanguinetti CM, Riccioni G, Marchesani F, Pela R, Cecarini L. Broncho- alveolar lavage fluid level of carcinoembryonic antigen in the diagno- sis of peripheral lung cancer. Monaldi Arch Chest Dis 1995;50:177-82.
10. Weber TH and Kerttula Y. Carcinoembryonic antigen (CEA) in blood in cases of pneumonia. Scand J Infect Dis 1986;18:547-50.
11. Tong J, Wang Y, Chang B, Zhang D, Wang B. Associations between tu- mor markers and the risk of colorectal polyp recurrence in Chinese people. Int J Clin Exp Med 2015;8:6397-405.
12. Zayed AA, Beano AM, Amer FN, Maslamani JM, Zmaili MA, Al-Khudary TH, et al. Serum levels of carcinoembryonic antigen in patients with type 2 diabetes. Endocr Pract 2016;22:1310-8.
13. Lu J, Wang H, Zhang X, Yu X. HbA1c is positively associated with se- rum carcinoembryonic antigen (CEA) in patients with diabetes: A cross-
sectional study. Diabetes Ther 2018;9:209-17.
14. Ohwada A, Takahashi H, Nagaoka I, Iwabuchi K, Mikami O, Kira S.
Effect of cigarette smoke on the mRNA and protein expression of car- cinoembryonic antigen (CEA), a possible chemoattractant for neutro- phils in human bronchioloalveolar tissues. Thorax 1995;50:651-7.
15. Pezzuto A, Spoto C, Vincenzi B, Tonini G. Short-term effectiveness of smoking-cessation treatment on respiratory function and CEA level. J Comp Eff Res 2013;2:335-43.
16. Tong J, Wang Y, Chang B, Zhang D, Wang B. Associations between tu- mor markers and the risk of colorectal polyp recurrence in Chinese people. Int J Clin Exp Med 2015;8:6397-405.
17. Park J, Lee S, Kim Y, Choi A, Lee H, Lim J, et al. Comparison of four automated carcinoembryonic antigen immunoassays: ADVIA Centaur XP, ARCHITECT I2000sr, Elecsys E170, and Unicel Dxi800. Ann Lab Med 2018;38:355-61.