pISSN 2383-899X eISSN 2234-7631
Introduction
Obesity is a major public health burden in developed countries
1-3and is also a well-known risk factor of cardiovascular disease (CVD).
Short sleep duration is associated not only with obesity
4, but also with diabetes mellitus
5, heart disease
6-8, and death.
9An inverse rela- tionship between inadequate sleep duration and obesity has been shown in young adults
10, specifically in young women.
11Associa- tions between sleep duration and health indicators differ according to factors such as race, culture, and sex.
12Koreans, in particular, are known to have relatively few sleep hours compared with those in other Organization for Economic Cooperation and Development (OECD) countries.
13However, few studies have focused on the asso- ciation between sleep duration and obesity in the Korean population.
Therefore, we investigated the association between sleep duration
and obesity after adjusting for socioeconomic position, health be- haviors, and other clinical factors.
Methods
1. Study population
Data were collected from the 2007-2009 Korea National Health and Nutrition Examination Survey (KNHANES) conducted by the Ministry of Health and Welfare of Korea.
14The survey applied a stratified, multistage probability sampling design to the South Kore- an population using a three-stage, stratified, systematic sampling method. The KNHANES included three questionnaires: a health in- terview survey, a health behavior survey, and a health examination.
The health interview survey sample included 13,800 households and 31,705 household members from 600 districts. One of every three
Association between Sleep Duration and Obesity in Young Korean Adults
Shin Yi Jang
1, Eun Young Ju
2, Kyung Min Park
3, Sura Seo
4, Su Jung Choi
5, Chang Kwan Lee
6, Heeran Chun
7, Seung Woo Park
1,*
1
Division of Cardiology, Department of Medicine, Heart Vascular Stroke Institute, Samsung Medical Center, Sungkyunkwan University School of Medicine, Seoul;
2
Graduate School of Public Health, Seoul National University, Seoul;
3College of Liberal Studies, Seoul National University, Seoul;
4The National Health Insurance Service, Seoul;
5Department of Nursing, Samsung Medical Center, Seoul;
6Department of Nursing, Korean Christian University, Seoul;
7Department of Health Administration, Jungwon University, Goesan, Korea
Background: The purpose of this study was to investigate the association between number of sleep hours and obesity based on body mass index (BMI) after adjusting for socioeconomic position, health behaviors, and clinical factors.
Methods: Data from subjects aged 20-64 years (n=12,688) in the Korea National Health and Nutrition Examination Survey in 2007-2009 was analyzed. Subjects were divided into two groups according to age: 20-44 (young adults) and 45-64 years (middle-aged adults). With respect to sleep time, subjects were classified as short sleepers (<6 hr/day), long sleepers (≥9 hr/day), and normal sleepers (6-8.9 hr/day). Obesity was defined as a BMI ≥25.
Results: The proportion of patients who were obese was 27.8%. The distribution of short sleepers, long sleepers, and normal sleepers was 6.4%, 13.7%, and 79.9%, respectively. The adjusted short sleeper and long sleeper odds ratios (OR) for obesity in young adults were significantly dif- ferent from that in middle-aged adults after adjustment for confounding factors. In women, the adjusted short sleeper OR for obesity was 1.56 (95% CI, 1.02-2.37).
Conclusion: This community-based random sample of Korean adults showed that women with short sleep duration may be at significant risk of obesity.
Key words: Short sleepers, Obesity, Body mass index, Young adult, Sex
*Corresponding author Seung Woo Park http://orcid.org/0000-0002-2941-515X Division of Cardiology, Department of Medicine, Heart Vascular Stroke Institute, Samsung Medical Center, Sungkyunkwan University School of Medicine, 81 Irwon-ro, Gangnam-gu, Seoul 06351, Korea
Tel +82-2-3410-3419 Fax +82-2-2148-7973 E-mail [email protected] Received Oct. 12, 2015 Reviewed Nov. 24, 2015 Accepted Dec. 28, 2015
Copyright © 2016 Korean Society for the Study of Obesity
This is an Open Access article distributed under the terms of the Creative Commons Attribution
Non-Commercial License (http://creativecommons.org/licenses/by-nc/4.0/) which permits
unrestricted non-commercial use, distribution, and reproduction in any medium, provided the
original work is properly cited.
health interview survey participants was selected for further partici- pation in the health behavior survey and health examination. From the 2007-2009 KNHANES, 24,871 people aged one year and older were interviewed of the 31,705-person sample (response rate: 78.4%).
We analyzed data from subjects aged 20-64 years with weighted variables (n=12,688; 6,495 men and 6,193 women). The sample in- cluded 7,775 people aged 20-44 years (young adults; male 4,030 and female 3,745) and 4,913 people aged 45-64 years (middle-aged adults;
male 2,465 and female 2,448).
The health interview questionnaire and health examination in- cluded several variables. Patients were divided in two groups accord- ing to age: 20-44 years and 45-64 years. Systolic blood pressure (SBP) and diastolic blood pressure (DBP) were measured after the subject had rested for five minutes in a sitting position. An average of three blood pressure measurements was used for data analysis. Blood samples were collected from the antecubital vein after overnight nil per os (NPO). Fasting plasma glucose, total cholesterol (TC), triglyc- eride (TG), and high density lipoprotein (HDL) levels were measured using enzymatic or colorimetric methods. Self-reported information on stress/depression status was obtained from the interviews, includ- ing usual stress perception and persistent depression for at least two weeks. Information on education level, monthly household income, family size, dietary consumption, regular physical activity, smoking status, alcohol consumption, employment status, hours worked per week, and sleep time in hours was also collected. A food frequency questionnaire (FFQ) consisting of 63 food items and the 24-hour re- call method were used to document dietary consumption. Nutrient intake was calculated as a percentage of total daily energy consump- tion and the energy obtained from protein, fat, and carbohydrates.
The study received ethical approval from the Institutional Review Board of Korea Centers for Disease Control and Prevention in Os- ong, Korea. Written informed consent was obtained from all partici- pants in the study.
2. Sleep duration
Self-reported sleep duration was grouped according to number of sleep hours. Patients were classified into three categories: short sleep- ers (<6 hours (h)/day), long sleepers (≥9 h/day), and normal sleepers (6-8.9 h/day).
15-18The sleep duration question was phrased as “How many hours do you usually sleep per day?”
3. Obesity
Body mass index (BMI) was calculated as weight in kilograms di- vided by the square of height in meters. Obesity was defined as a BMI ≥ 25.
19,204. Standing height measurement
We measured subjects’ standing height using anthropometry (SECA225, Germany SECA). First, they stood with heels together and toes apart. The subjects were checked to confirm that the back of the head, buttocks, and heels made contact with the backboard. Sec- ond, the head was aligned in the Frankfort horizontal plane. We used an anthropometric bar on the subjects’ heads and measured the result to the nearest centimeter.
5. Weight measurement
Subjects were weighed in kilograms using a scale (GL-6000-20, CAS Korea), and the results was determined when gradation was stabilized after a set zero on the scale with no load.
6. Socioeconomic factors
The socioeconomic factors used in this study were education level and equivalent household monthly income. Education level was clas- sified into three categories: 1) elementary school; six years or less of schooling, 2) middle/high school; 7-12 years of schooling, and 3) col- lege, university; >12 years of schooling. Equivalent household monthly income (equivalent income) was calculated using the fol- lowing formula created by the OECD
21: W
ij= Y
i/ S
iε, where Y
iis the i
-thhousehold income, S
iis the i
-thhousehold family size, and W
ijis the equivalent income of the j
-thmember in the i
-thhousehold. Equiv- alent elasticity, ε, which is an equivalency of household size, was set to 0.5. Equivalent income was then calculated by dividing the ob- tained monthly household income by the square root of family size.
Equivalent income was categorized into three levels: low (<130), middle (130-849), and high (≥849). Employment status consisted of currently working or not working and included full-time and part- time positions. Finally, the number of hours worked per week in- cluded full- and part-time work.
7. Health behavior factors
A subject was identified as a current smoker if he or she had
smoked within one year of the survey date. A subject was defined as
a current drinker if he or she had consumed an alcoholic beverage within one year of the survey date. Regular physical activity was de- fined as having walked 30 minutes at a time, more than five days a week.
8. Statistical analyses
Differences in general characteristics, socioeconomic factors, health behaviors, and clinical data between non-obese and obese groups were analyzed using Student’s t-tests for continuous variables and χ
2-tests for categorical variables. The mean (±standard error) of BMI by sleep duration (from less 5 to over 10) was determined for all groups, including by sex, and the 20-44 years and 45-64 years groups were analyzed using one-way analysis of variance. Multiple logistic regression analysis was used to determine the association between sleep duration (<6 hours vs ≥9 hours vs 6-8.9 hours) as the indepen- dent variable and obesity as the dependent variable after adjusting for age, sex, socioeconomic position, health behaviors, and other clinical factors. The sample weights proposed by the Korea Institute of Health and Social Affairs to estimate nationwide prevalence were applied for all analyses.
22P values less than 0.05 were reported as sta- tistically significant. Data were analyzed with Statistical Analysis System (SAS) software, version 9.3 (SAS Inc., Cary, NC, USA).
Results
Of our total sample, 31.6% were obese. A significantly higher pro- portion of obese people had short sleep hours compared with normal sleep hours in the young adult group (P<0.001). Generally, obese people were more likely to be male, under stress, less educated, and currently employed compared to non-obese people (P<0.05). In contrast, the proportion of people who regularly engaged in regular physical activity was higher among non-obese people than obese people (P<0.001). TG levels in the obese group were higher than those of the non-obese group (P<0.01) (Table 1).
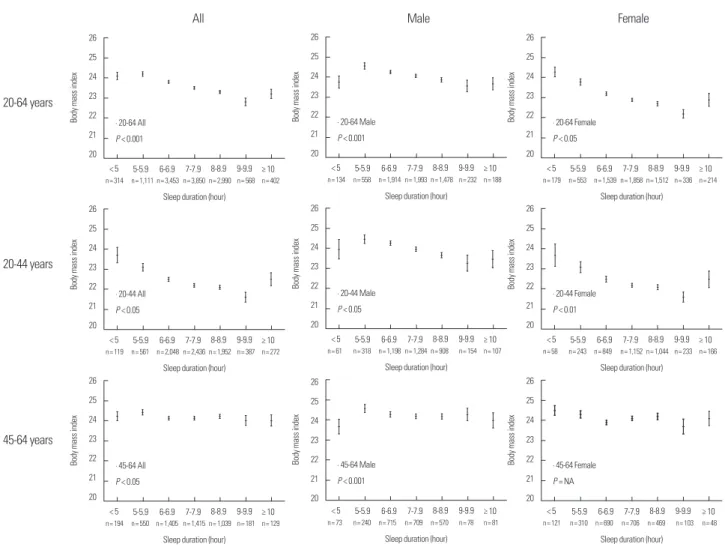
The adjusted odds ratios (OR) of short sleep hours [1.56 (95% Con- fidence Interval (CI), 1.02-2.37)] and long sleep hours [2.41 (95% CI, 1.28-4.54)] were statistically significant in young women after adjust- ing for potential confounders (Table 2). Furthermore, in young wom- en, shorter the sleep duration was associated with higher BMI (Fig. 1).
Discussion
Although long sleep duration was found to be associated with obesity in both sexes in the young age group in this study, obesity was associated with short sleep duration in the 20-44 years group in women. The results of this present study are similar to those of an earlier study. The United States (US) civilian noninstitutionalized population study that used the National Health and Nutrition Ex- amination Survey I showed an association between short sleep dura- tion and obesity in women.
23Additionally, an internal medicine clinic patient study showed that short sleep time predicted obesity in women aged 18 to 49 years in the US.
24Multiple studies have been conducted in various countries and have indicated that there is an association between obesity and sleep duration. For example, adults in Australia
17and the US
25showed an association between obesity and short/long sleep duration. Addi- tionally, studies of young Swedish women
11, a community prospec- tive cohort study in Zurich
26, Brazilian adults
27, and a population- based study in the US
28showed that obesity was associated with short sleep duration. The Insulin Resistance Atherosclerosis Study Family Study, which measured abdominal fat using computed to- mography
29, showed an association between short sleep duration and obesity in adults younger than 40 years. Short sleep duration has been shown to be associated with reduced leptin, elevated ghrelin, and increased BMI.
30,31Furthermore, sex hormones and reproduc- tive events may explain the differences between men and women.
32Decreases in sleep duration and quality of sleep were observed in postpartum women. In a Korean study, Park et al.
33determined that short and long sleep durations were associated with psychiatric dis- orders and obesity. Unfortunately, they did not analyze their data ac- cording to age or sex. However, the Penn State Cohort
34and the White Hall II Study
12did not show a significant association between short sleep duration and obesity. Although a causal effect between long sleep hours and obesity has not be established, a previous study showed that long sleepers were more likely to experience obesity, de- pression, lower SEP, and social isolation.
35In the present study, obesity was associated with short sleep dura-
tion only in women, although longer sleep duration was associated
with obesity in both sexes in the young age group. The association
between sleep duration and BMI in women is not in accordance with
the large epidemiologic study by Kripke et al.
9, which reported a U-
shaped relationship between sleep duration and BMI in women.
However, the distribution of sleep duration and obesity in the pres- ent study corresponds with the data from a Detroit population tele- phone interview self-reported sleep hour study
28and the Penn State Cohort results.
36The present study assessed the impact of carbohydrate overeating to determine if it is associated with obesity, using the 24-hour recall method. Young obese women did not report a higher carbohydrate
intake, although there was a significantly higher carbohydrate intake in young obese people overall (Online Appendix 1). Therefore, the association between obesity in young women with short sleep dura- tion could be attributable to other factors, which could not be identi- fied in this study.
There were several limitations to our study. First, it is difficult to show causality between obesity and short sleep duration using a cross-sectional study design, although this study does demonstrate Table 1. Distribution of general characteristics, sleep hours, mental stress, socioeconomic position, health behaviors, and clinical factors by age group and body mass index
Variables
20-64 years (n= 12,688) 20-44 years (n= 7,775) 45-64 years (n= 4,913)
Non-obese
(n= 8,679) Obese
(n= 4,009) P value* Non-obese
(n= 5,648) Obese
(n= 2,127) P value* Non-obese
(n= 3,031) Obese
(n= 1,882) P value*
Percentages
Age, years, mean (SD) 39.3 (16.7) 42.9 (14.5) 0.334 32.1 (10.5) 33.8 (8.76) 0.077 52.7 (6.06) 53.2 (6.07) 0.889
Sex, female 53.4 38.5 < 0.001 54.1 32.3 < 0.001 52.1 46.0 < 0.001
Sleep hours, mean (SD) 6.95 (1.49) 6.77 (1.46) 0.925 7.07 (1.50) 6.84 (1.38) 0. 699 6.74 (1.10) 6.70 (1.30) 0.846
Sleep hours < 0.001 < 0.001 0.132
≥ 9 8.2 6.4 9.1 6.7 6.5 6.1
6-9 82.2 79.9 83.0 82.1 79.2 77.3
< 6 9.6 13.7 7.9 11.2 14.3 16.6
Perceived stress 29.2 31.6 0.025 31.6 35.7 0.004 24.5 27.0 0.080
Perceived depression 13.1 13.2 0.937 11.7 11.2 0.594 15.7 15.3 0.721
Education level < 0.001 0.003 0.001
College, University 46.8 39.4 61.4 57.3 24.4 29.4
Middle/High school 44.2 46.1 37.8 41.5 56.0 51.2
Elementary school 9.0 14.5 0.8 1.2 19.6 19.4
Income level
†0.053 0.151 0.522
High 29.7 25.0 32.2 31.3 25.0 25.2
Middle 33.3 31.7 32.6 30.6 34.0 32.4
Lower 40.5 43.3 35.2 38.1 41.0 42.4
Walking practice, Yes 82.3 79.1 < 0.001 83.0 77.8 < 0.001 81.0 80.7 0.766
Current smoker, Yes 4.7 3.9 0.212 5.6 3.0 0.494 3.1 2.7 0.806
Current drinker, Yes 91.5 91.2 0.579 94.6 95.2 0.396 85.8 86.8 0.339
Employment status, Yes 64.7 71.0 < 0.001 63.7 71.6 < 0.001 66.4 70.6 0.004
Hours worked per week, mean (SD) 45.9 (22.5) 48.8 (21.2) 0.081 45.1 (21.6) 48.9 (20.6) 0.088 47.5 (22.7) 48.7 (23.7) 0.288 Mean (SD)
Systolic blood pressure (mmHg) 112.2 (24.2) 120.8 (21.1) 0.442 108.4 (19.5) 117.2 (17.5) 0.639 119.1 (20.9) 124.9 (19.9) 0.445 Diastolic blood pressure (mmHg) 74.7 (18.6) 81.0 (15.2) 0.101 72.8 (16.5) 79.6 (13.8) 0.083 78.3 (14.3) 82.5 (13.4) 0.564 Fasting plasma glucose (mg/dL) 93.0 (23.2) 100.9 (29.1) 0.068 90.2 (20.2) 95. (22.6) 0.325 98.2 (23.6) 106.7 (32.9) 0.059 Total cholesterol (mg/dL) 180.5 (42.8) 195.2 (44.3) 0.446 174.2 (40.5) 192.6 (44.2) 0.249 192.2 (36.8) 198.1 (42.9) 0.346 Triglyceride (mg/dL) 115.5 (114.5) 173.5 (165.8) 0.003 104.2 (103.7) 171.7 (163.7) 0.030 136.5 (118.3) 175.5 (166.1) 0.028 High density lipoprotein (mg/dL) 49.2 (17.7) 43.5 (12.6) 0.509 49.9 (17.2) 43.3 (11.9) 0.805 48.0 (12.6) 43.8 (12.1) 0.918 Body mass index 21.8 (1.86) 27.4 (2.53) < 0.001 21.5 (2.25) 27.6 (2.77) < 0.001 22.3 (1.65) 27.1 (2.17) < 0.001
Waist circumference (cm) 76.2 (11.1) 90.6 (9.50) 0.052 74.8 (10.5) 90.4 (9.69) 0.295 78.8 (8.26) 90.7 (7.81) 0.058
Energy (kcal/day) 1,930.7 (1,101.7) 2,036.7 (1,149.0) 0.634 1,966.8 (1,062.7) 2,113.5 (1,150.6) 0.197 1,865.4 (959.8) 1,954.7 (1,069.7) 0.518
Protein (g/day) 70.0 (49.5) 73.6 (50.1) 0.806 72.0 (50.4) 77.6 (50.5) 0.818 66.4 (38.5) 69.2 (44.3) 0.877
Fat (g/day) 40.3 (40.7) 40.8 (40.8) 0.585 44.8 (39.8) 47.4 (38.8) 0.299 32.1 (33.4) 33.6 (37.4) 0.776
Carbohydrates (g/day) 308.0 (169.1) 318.4 (163.3) 0.191 304.7 (159.4) 313.0 (160.9) 0.029 314.0 (157.9) 324.0 (153.9) 0.709 Regular physical activity: if subject had walked 30 minutes at a time, more than five days a week; Current smoker: if subject had smoked within one year of the survey date; Current drinker: if subject had consumed an alcoholic beverage within one year of the survey date; Employment status: if subject is currently working.
*Student’s t-test or χ
2-test;
†Equivalent household monthly income.
Table 2. Association between number of sleep hours and obesity after adjustment for age, sex, stress, socioeconomic position, health behaviors, and other clinical factors
Variables Obesity (BMI > 25)
Model 1 Model 2 Model 3 Model 4
20-64 years All
≥ 9 hours 1.71 (1.38-2.12) 1.45 (1.17-1.81) 1.47 (1.13-1.92) 1.59 (1.20-2.12)
6-8.9 hours 1.0 1.0 1.0 1.0
< 6 hours 1.38 (1.20-1.58) 1.26 (1.09-1.45) 1.19 (1.01-1.41) 1.26 (1.05-1.52)
Male
≥ 9 hours 1.44 (1.06-1.96) 1.38 (1.01-1.88) 1.37 (0.98-1.91) 1.43 (0.99-2.05)
6-8.9 hours 1.0 1.0 1.0 1.0
< 6 hours 1.14 (0.94-1.40) 1.11 (0.91-1.36) 1.12 (0.91-1.39) 1.18 (0.94-1.49)
Female
≥ 9 hours 1.97 (1.51-2.56) 1.30 (0.98-1.71) 1.48 (0.98-2.21) 1.80 (1.17-2.75)
6-8.9 hours 1.0 1.0 1.0 1.0
< 6 hours 1.79 (1.50-2.13) 1.45 (1.21-1.73) 1.31 (1.01-1.70) 1.38 (1.03-1.84)
20-44 years All
≥ 9 hours 1.92 (1.42-2.58) 1.73 (1.28-2.34) 1.68 (1.16-2.41) 1.99 (1.32-2.99)
6-8.9 hours 1.0 1.0 1.0 1.0
< 6 hours 1.43 (1.16-1.75) 1.44 (1.17-1.77) 1.36 (1.07-1.73) 1.40 (1.08-1.82)
Male
≥ 9 hours 1.65 (1.06-2.57) 1.54 (0.98-2.41) 1.60 (0.99-2.58) 1.78 (1.04-3.04)
6-8.9 hours 1.0 1.0 1.0 1.0
< 6 hours 1.21 (0.90-1.61) 1.23 (0.92-1.65) 1.25 (0.92-1.70) 1.31 (0.95-1.81)
Female
≥ 9 hours 1.88 (1.27-2.77) 1.57 (1.06-2.33) 1.73 (1.02-2.96) 2.41 (1.28-4.54)
6-8.9 hours 1.0 1.0 1.0 1.0
< 6 hours 1.81 (1.37-2.40) 1.77 (1.34-2.35) 1.62 (1.12-2.34) 1.56 (1.02-2.37)
45-64 years All
≥ 9 hours 1.21 (0.91-1.61) 1.15 (0.97-1.37) 1.19 (0.84-1.69) 1.22 (0.85-1.74)
6-8.9 hours 1.0 1.0 1.0 1.0
< 6 hours 1.18 (1.00-1.40) 1.18 (0.89-1.57) 1.06 (0.85-1.33) 1.14 (0.89-1.45)
Male
≥ 9 hours 1.15 (0.76-1.74) 1.16 (0.77-1.75) 1.10 (0.71-1.70) 1.07 (0.68-1.68)
6-8.9 hours 1.0 1.0 1.0 1.0
< 6 hours 1.03 (0.80-1.34) 1.05 (0.81-1.36) 1.04 (0.79-1.37) 1.09 (0.81-1.46)
Female
≥ 9 hours 1.28 (0.86-1.89) 1.15 (0.77-1.72) 1.27 (0.72-2.24) 1.46 (0.81-2.64)
6-8.9 hours 1.0 1.0 1.0 1.0
< 6 hours 1.37 (1.17-1.70) 1.27 (1.02-1.59) 1.08 (0.76-1.54) 1.21 (0.84-1.75)
Model 1 is a crude odds ratio (OR).
Model 2 is adjusted for age.
Model 3 is adjusted for age, sex, mental stress, education level, equivalent household monthly income level, walking, smoking, and drinking. Statistical analysis was applied except in sex analysis.
Model 4 is adjusted for model 3+systolic blood pressure, diastolic blood pressure, fasting blood sugar, triglycerides, and high density lipoprotein levels.
that obesity is associated with short sleep duration in young Korean females. Second, KNHANES did not investigate the quality of sleep or conduct a quantitative assessment of regular physical activity, drink, and smoking. Third, this study utilized self-reported sleep duration instead of measured sleep duration. However, good agree-
ment between self-reported sleep durations and those obtained through actigraphic monitoring has been reported in previous stud- ies.
37Therefore, our study supports the hypothesis that there is an association between short sleep duration and obesity.
This study is highly representative of the Korean population since
it is a well-designed random sample study. Therefore, our results are applicable to the general Korean population.
This community-based random sample was drawn from a popu- lation of young Korean adults, especially women, and indicated that short sleep duration was significantly associated with obesity. These finding may have important clinical implications for the prevention of obesity, especially in young women, since sleep duration is a po- tentially modifiable risk factor.
Conflicts of Interest
None Declared.
References
1. Gehrman P, Stepnowsky C, Cohen-Zion M, Marler M, Kripke DF,
Figure 1. One-way analysis of variance of mean (standard error) body mass index (BMI) and sleep duration according to age and sex.
20-64 years
Female Male
All
20-44 years
45-64 years
∙ 20-64 All P < 0.001
Sleep duration (hour)
n= 3,850 n= 3,453 n= 1,111n= 314 n= 2,990 n= 568 n= 402
< 5 5-5.9 6-6.9 7-7.9 8-8.9 9-9.9 ≥ 10
Body mass index
26 25 24 23 22 21 20
∙ 20-64 Male P < 0.001
Sleep duration (hour)
n= 1,993 n= 1,914 n= 558n= 134 n= 1,478 n= 232 n= 188
< 5 5-5.9 6-6.9 7-7.9 8-8.9 9-9.9 ≥ 10
Body mass index
26 25 24 23 22 21 20
∙ 20-64 Female P < 0.05
Sleep duration (hour)
n= 1,858 n= 1,539 n= 553n= 179 n= 1,512 n= 336 n= 214
< 5 5-5.9 6-6.9 7-7.9 8-8.9 9-9.9 ≥ 10
Body mass index
26 25 24 23 22 21 20
∙ 20-44 All P < 0.05
Sleep duration (hour)
n= 2,436 n= 2,048 n= 561n= 119 n= 1,952 n= 387 n= 272
< 5 5-5.9 6-6.9 7-7.9 8-8.9 9-9.9 ≥ 10
Body mass index
26 25 24 23 22 21 20
∙ 20-44 Male P < 0.05
Sleep duration (hour)
n= 1,284 n= 1,198 n= 318n= 61 n= 908 n= 154 n= 107
< 5 5-5.9 6-6.9 7-7.9 8-8.9 9-9.9 ≥ 10
Body mass index
26 25 24 23 22 21 20
∙ 20-44 Female P < 0.01
Sleep duration (hour)
n= 1,152 n= 849 n= 243n= 58 n= 1,044 n= 233 n= 166
< 5 5-5.9 6-6.9 7-7.9 8-8.9 9-9.9 ≥ 10
Body mass index
26 25 24 23 22 21 20
∙ 45-64 All P < 0.05
Sleep duration (hour)
n= 1,415 n= 1,405 n= 550n= 194 n= 1,039 n= 181 n= 129
< 5 5-5.9 6-6.9 7-7.9 8-8.9 9-9.9 ≥ 10
Body mass index
26 25 24 23 22 21 20
∙ 45-64 Male P < 0.001
Sleep duration (hour)
n= 709 n= 715 n= 240n= 73 n= 570 n= 78 n= 81
< 5 5-5.9 6-6.9 7-7.9 8-8.9 9-9.9 ≥ 10
Body mass index
26 25 24 23 22 21 20
∙ 45-64 Female P = NA
Sleep duration (hour)
n= 706 n= 690 n= 310n= 121 n= 469 n= 103 n= 48