INTRODUCTION
Breast cancer is the most common cancer of women in Western Europe and North America, and the leading cause of cancer deaths [1]. There have been marked advances in understanding breast cancer carcinogenesis and cancer biology;
however, the specific problem of treatment persists. The prog- nostic factors related to breast cancer are age, nodal status, tumor size, histological tumor grade, steroid hormone (estro- gen and progesterone) receptor status, and HER2neu expres- sion. The above factors are currently accepted in clinical prac-
tice and have been shown to predict clinical outcome [1,2].
Cancer cell metabolism is characterized by high rates of glucose consumption and glycolysis compared with those of normal cells [3]. Glucose uptake seems to be critical in trig- gering cellular transformation. Cells that are able to take up glucose do not have to utilize it efficiently by oxidative phos- phorylation [1]. Glucose uptake in cancer cells is increased by activation of the oncogene Akt (protein kinase B), which in turn increases the transcription and plasma membrane local- ization of glucose transporter 1 (GLUT1), a glucose transporter expressed in most cell types [4].
GLUT1, the first member of the GLUT family to be identi- fied, is a high-affinity glucose transporter that regulates glucose uptake [5]. Its expression increases under hypoxia, which cre- ates greater dependence on glycolysis as an energy source [6].
Tumor hypoxia, which is due to proliferation outpacing the blood supply and leads to activation of hypoxia inducible fac- tor (HIF), is certainly responsible for some of the increased glycolysis and glucose consumption observed in cancer cells since HIF activates the transcription of a number of glycolytic genes as well as GLUT1 [7,8]. Increases in glucose consump-
The Glycolytic Phenotype is Correlated with Aggressiveness and Poor Prognosis in Invasive Ductal Carcinomas
Se Min Jang*, Hulin Han, Ki-Seok Jang, Young Jin Jun, Si-Hyong Jang, Kyueng-Whan Min, Min Sung Chung1,*, Seung Sam Paik
Departments of Pathology and 1Surgery, Hanyang University College of Medicine, Seoul, Korea ORIGINAL ARTICLE
Purpose: Glucose uptake and glycolytic metabolism are enhanced in cancer cells, and increased expression of glucose transporter 1 (GLUT1) has also been reported. The aim of this study was to investigate GLUT1 expression in human breast tissues and inva- sive ductal carcinomas. Methods: We used tissue microarrays consisting of normal breast tissue, ductal hyperplasia, ductal carcinoma in situ, invasive ductal carcinoma, and lymph node metastases. We examined GLUT1 expression in the microarrays by immunohistochemistry, reviewed the medical records and performed a clinicopathological analysis. Results: Membranous GLUT1 expression was observed in normal and tumor cells. GLUT1 expression was higher in ductal carcinoma in situ, invasive duct- al carcinoma, and lymph node metastasis than in normal tissue and ductal hyperplasia (p=0.002). Of 276 invasive ductal carci- nomas, 106 (38.4%) showed GLUT1 expression. GLUT1 expres-
sion was correlated with higher histologic grade (p<0.001), larger tumor size (p=0.025), absence of estrogen receptor (p<0.001), absence of progesterone receptor (p<0.001), and triple-negative phenotype (p<0.001). In univariate survival analysis, patients with GLUT1 expression had poorer overall survival and disease-free survival (p=0.017 and p=0.021, respectively, log-rank test). In multivariate survival analysis with the Cox proportional hazards model, GLUT1 expression was an independent prognostic factor of poorer overall survival and disease-free survival (p=0.017 and p=0.019, respectively). Conclusion: GLUT1 expression seems to play an important role in malignant transformation, and the glyco- lytic phenotype in invasive ductal carcinoma may indicate aggres- sive biological behavior and a worse prognosis.
Key Words: Breast, Glucose transporter 1, Invasive ductal carcinoma, Prognosis
Correspondence: Seung Sam Paik
Department of Pathology, Hanyang University College of Medicine, 222 Wangsimni-ro, Seongdong-gu, Seoul 133-792, Korea Tel: +82-2-2290-8252, Fax: +82-2-2296-7502
E-mail: [email protected]
*These authors contributed equally to this work.
This work was supported by the research fund of Hanyang University (HY-2009-N) to Min Sung Chung.
Received: November 29, 2011 Accepted: February 4, 2012
Cancer
tion help supply the energy that is necessary for tumor cell proliferation and reflect adaptation to the adverse conditions of the tumor environment. The metabolic changes occurring in tumor cells may have prognostic and diagnostic value;
although, the metabolic consequences of increased glucose transport are not well understood: GLUT1 expression appears to have clinical significance in several types of tumor [9].
In this study, we examined GLUT1 expression immunohis- tochemically in a large series of invasive ductal carcinomas, to evaluate the relation between GLUT1 expression and clinico- pathological parameters, as well as the impact of GLUT1 ex- pression on survival. In addition, we investigated the correla- tions between GLUT1 expression and expression of the estro- gen receptor (ER), progesterone receptor (PR), and c-erbB-2.
METHODS
Patients and tissue samples
We enrolled a consecutive series of 276 patients with invasive ductal carcinoma. All were diagnosed and treated in Hanyang University Hospital between August 2000 and January 2009.
The mean age was 50 years. The patients were followed up for a mean period of 60 months. Of the tumors, 45 were histolo- gic grade 1, 156 were histologic grade 2, and 75 were histologic grade 3. In addition, 18 samples of normal breast tissue, 14 of ductal hyperplasia, 55 of ductal carcinoma in situ, and 58 of lymph node metastasis, were randomly selected to examine the evolution of GLUT1 expression in multistep carcinogenesis.
All tissue samples were formalin-fixed and paraffin embedded.
Hematoxylin-eosin (H&E) slides, pathology reports, and other medical records were reviewed to confirm the diagnoses as well as to establish the clinicopathologic parameters of the tumors, such as age, tumor size, histological grade, lymphatic invasion, perineural invasion, lymph node metastasis, perinodal tumor extension, and patient survival.
Ethics approval
The materials in our study are human breast cancer samples, which are products of surgical operation for cancer treatment.
Moreover, our study contains no private information on pa- tients. Therefore, our study has no problems in causing any ethical issue or encroachment of human rights.
Tissue microarray construction
Tissue microarrays (TMA) were constructed from archival formalin-fixed, paraffin-embedded tissue blocks using a man- ual tissue arrayer (Quick-Ray Manual Tissue Microarrayer;
Unitma Co., Ltd., Seoul, Korea). As described [10], areas of each sample rich in tumor cells were identified by light micros-
copy of H&E stained sections for use in the tissue microarrays.
Tissue cylinders with a diameter of 2 mm were punched from a previously marked area of each block (donor block) and trans- ferred to a recipient block. This resulted in 6×10 arrays for sets of 60 cases.
Immunohistochemical staining
For immunohistochemical staining, serial 4 µm sections were cut with a Leica microtome and transferred to adhesive- coated slides. The TMA slides were dewaxed by heating at 55°C for 30 minutes, followed by three washes of 5 minutes each with xylene. The sections were rehydrated by a series of 5 minutes washes in 100%, 90%, 70% ethanol and phosphate buffered saline (PBS). Antigen was retrieved by heating the samples in a microwave for 4 minutes 20 seconds at full power in 250 mL of 10 mM sodium citrate (pH 6.0), and endogenous peroxidase activity was blocked with 0.3% hydrogen peroxide for 20 minutes. Primary mouse monoclonal anti-GLUT1 anti- body (ab40084; Abcam, Cambridge, UK) was diluted 1:250 with goat serum. Primary mouse monoclonal anti-ER anti- body (Novocastra Laboratories, Newcastle, UK) was diluted 1:50 with goat serum. Primary mouse monoclonal anti-PR antibody (Novocastra Laboratories) was diluted 1:100 with goat serum. Primary mouse monoclonal anti-c-erbB-2 anti- body (Novocastra Laboratories) was diluted 1:800 with goat serum. After incubation with the primary antibodies at room temperature for 1 hour, the sections were washed with PBS three times for 2 minutes each, and incubated with biotinylated goat anti-mouse secondary antibody for 30 minutes (DAKO, Carpinteria, USA). After three more washes, horseradish per- oxidase-streptavidin (DAKO) was added to the sections for 30 minutes, followed by another three washes. The samples were developed with 3,3´-diaminobenzidine substrate (Vector Laboratories, Burlington, Canada) for 1 minute and counter- stained with Mayer’s hematoxylin. They were then dehydrated and sealed with cover slips. Negative controls were performed by omitting primary antibodies.
Interpretation of immunohistochemical staining
GLUT1 expression was evaluated semi-quantitatively by two independent pathologists (Han H and Paik SS) without knowledge of clinical outcomes. The GLUT1 immunostaining was semiquantified by grading the proportion of cells that were GLUT1-positive, as described previously [11]: grade 0, nega- tive (no positive cells); grade 1, low positive (less than 10% are);
grade 2, moderate positive (10-50% positive cells); and grade 3, high positive (more than 50% positive cells). For purposes of statistical analysis, a cut-off value of 10% was adopted. If the proportion of GLUT1 positive cells was <10%, the sample was
classified as GLUT1 negative, and if it was >10%, it was clas- sified as GLUT1 positive.
Hormone receptor status (ER and PR) was decided on the basis of American Society of Clinical Oncology/College of American Pathologists (ASCO/CAP) guidelines for ER/PR testing in breast cancer [12]. If ≥1% of tumor cell nuclei were immunoreactive, it was classified as ER/PR positive.
We classified c-erbB-2 expression into four levels according to the ASCO/CAP guidelines for c-erbB-2 testing in breast cancer [13]. Briefly, a score of 0 was given to those specimens showing no staining. A score of 1+ was given to specimens with weak, incomplete membrane staining in any proportion of tumor cells. A score of 2+ was given to specimens showing complete membrane staining that is either non-uniform or weak in intensity but with obvious circumferential distribution in at least 10% of tumor cells. Finally, a score of 3+ was given to specimens showing uniform intense membrane staining of
>30% of invasive tumor cells. Only c-erbB-2 staining evaluated as 3+ was rated positive. Where assessments disagreed, the relevant slides were reinvestigated by the two pathologists with a multi-head microscope, and agreement was reached.
Statistical analysis
Statistical analysis was performed with SPSS software ver- sion 15.0 (SPSS Inc., Chicago, USA). The chi-square test for linear trend and Fisher’s exact test were used to examine the association between GLUT1 expression and clinicopathologi- cal parameters including age, histologic grade, T category, N category, American Joint Committee on Cancer (AJCC: 7th edition, 2002) stage, lymphatic invasion, perinodal tumor extension, and expression of ER, PR, and c-erbB-2. The Kaplan- Meier method was used to calculate overall survival and disease- free survival. Univariate survival analysis with the log-rank test was used to compare the survival rates of the patient sub- groups. Multivariate survival analysis with the Cox proportional hazards regression model was used to evaluate independent
prognostic factors: p<0.05 was considered significant.
RESULTS
Patterns of GLUT1 expression in breast tissues
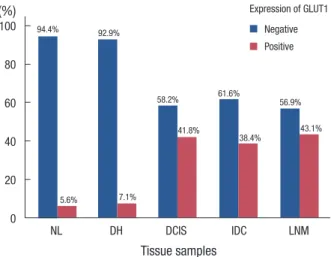
GLUT1 expression was evaluated in 18 cases of normal breast tissue, 14 cases of ductal hyperplasia, 55 cases of ductal carcinoma in situ, 276 cases of invasive ductal carcinoma, and 58 cases of lymph node metastasis. As expected, erythrocyte membranes were strongly GLUT1-positive. Various grades of membrane GLUT1 expression were observed, some with and some without cytoplasmic expression. GLUT1 expression was significantly higher in ductal carcinoma in situ, invasive ductal carcinoma, and lymph node metastasis than in normal breast tissue and ductal hyperplasia (p=0.002) (Table 1, Figure 1).
Representative photomicrographs of GLUT1 immunostaining in the invasive ductal carcinomas are shown in Figure 2.
Correlations between GLUT1 expression and
clinicopathologic parameters in invasive ductal carcinoma To assess the clinicopathologic significance of the GLUT1 expression, we evaluated the correlation between GLUT1 expression and clinicopathologic parameters in the 276 invasive ductal carcinomas. We found that positive GLUT1 expression was correlated with more aggressive behavior: it was associated with higher histologic grade (p<0.001), larger tumor size (p=0.025), absence of ER (p<0.001), absence of PR (p<0.001), and triple-negative phenotype (p<0.001) (Table 2).
Correlations between GLUT1 expression and overall survival and disease-free survival
We examined the impact of GLUT1 expression on patient
Table 1. GLUT1 expression in various breast tissues (n = 421) Tissue sample No.
Expression of GLUT1 Negative (n=265)
No. (%)
Positive (n=156) No. (%) p-value*
NL 18 17 (94.4) 1 (5.6) 0.002
DH 14 13 (92.9) 1 (7.1)
DCIS 55 32 (58.2) 23 (41.8)
IDC 276 170 (61.6) 106 (38.4)
LNM 58 33 (56.9) 25 (43.1)
GLUT1=glucose transporter 1; NL=normal breast tissue; DH=ductal hyper- plasia; DCIS=ductal carcinoma in situ; IDC=invasive ductal carcinoma; LNM=
lymph node metastasis.
*Chi-square test for linear trend.
100
80
60
40
20
0 (%)
NL DH DCIS IDC LNM
Tissue samples
Expression of GLUT1 Negative Positive 94.4%
5.6%
92.9%
7.1%
58.2%
41.8%
61.6%
38.4%
56.9%
43.1%
Figure 1. Glucose transporter 1 (GLUT1) expression in normal breast (NL), ductal hyperplasia (DH), ductal carcinoma in situ (DCIS), invasive ductal carcinoma (IDC), and lymph node metastasis (LNM).
survival. As we anticipated, we found that GLUT1 expression, AJCC stage, lymphatic invasion, and perinodal tumor exten- sion had significant impacts on overall and disease-free sur- vival in univariate and/or multivariate analyses (Table 3). Thus, GLUT1 expression was significantly correlated with poor over- all survival (p=0.017, log-rank test) and lower disease-free survival (p=0.021, log-rank test) in univariate analysis. In mul- tivariate survival analysis with the Cox proportional hazards model, GLUT1 expression was an independent prognostic factor of overall survival and disease-free survival (p=0.017 and p=0.019, respectively). Kaplan-Meier survival curves re- vealed significant differences in patient survival according to GLUT1 expression, AJCC stage, lymphatic invasion, and peri- nodal tumor extension (Figures 3, 4).
DISCUSSION
In the present study we investigated the expression of GLUT1
in 18 normal breast tissues, 14 ductal hyperplasias, 55 ductal carcinomas in situ, 276 invasive ductal carcinomas, and 58 lymph node metastases, and evaluated the correlations be- tween clinicopathologic parameters and patient survival in the patients with invasive ductal carcinomas. GLUT1 expres- sion was markedly higher in ductal carcinoma in situ, invasive ductal carcinoma, and lymph node metastasis than in normal breast tissue and ductal hyperplasia. It was correlated with high- er histologic grade, larger tumor size, absence of ER, absence of PR, and triple-negative phenotype. In addition, there were significant associations between GLUT1 expression and over- all survival and disease-free survival in patients with invasive ductal carcinomas.
Glucose metabolism and utilization is increased in many malignant tumors [14-16]. The increased GLUT1 expression in neoplastic tissue reflects increased glycolytic metabolism and is also observed under conditions that induce greater dependence on glycolysis as an energy source, such as ischemia
A
C
B
D Figure 2. Representative photomicrographs of glucose transporter 1 (GLUT1) immunostaining in invasive ductal carcinomas (×200). (A) Negative (arrows: RBCs as internal control), (B) low expression (<10%), (C) moderate expression (10-50%), and (D) high expression (>50%).
or hypoxia [17,18]. Constitutive upregulation of glycolysis requires additional adaptations, resistance to apoptosis and upregulation of certain membrane transporters [19]. The need for increased glucose uptake is achieved by upregulation of glucose transporters in the plasma [20]. Activation of GLUT1 expression is a feature of the malignant phenotypes of a variety of cancers, and has been shown to be associated with malig- nant transformation [14]. GLUT1 is widely distributed in both fetal and adult tissues and its expression is altered in human breast carcinomas [21].
Recently, Chen et al. [22] described the GLUT1 expression patterns in various breast tissues including normal, ductal hyperplasia, atypical ductal hyperplasia, ductal carcinoma in situ, and invasive ductal carcinoma. They demonstrated that GLUT1 expression was completely absent in normal breast tissue, ductal hyperplasia, and atypical ductal hyperplasia, but was expressed in 56.8% (25/44) of ductal carcinomas in situ and 44.1% (26/59) of invasive ductal carcinomas. Hao et al.
[23] had also shown the GLUT1 expression in the breast malignancies. In their immunohistochemical study, 58.8%
(47/80) of the breast carcinoma cases including ductal carci- noma in situ and invasive carcinoma displayed the GLUT1 expression; whereas, benign lesions consisting of 20 cases of fibroadenoma and 20 cases of usual ductal hyperplasia exhib- ited no immunoreactivity for GLUT1. In the present work, we demonstrated GLUT1 expression in 5.6% (1/18) of normal breast tissue samples and 7.1% (1/14) of ductal hyperplasias, 41.8% (23/55) of ductal carcinomas in situ, and 38.4% (106/
276) of invasive ductal carcinomas. We also assessed GLUT1 expression in 58 lymph node metastases, 43.1% (25/58) of which were GLUT1 positivity. The slight differences in frequen- cies of GLUT1 expression in the studies may be due to differ- ences in the numbers of cases examined and the cut-off values employed. For instance, in the report of Chen et al. [22], stain- ing of GLUT1 was scored as positive when membrane stain- Table 2. Correlations between GLUT1 expression and clinicopathologi-
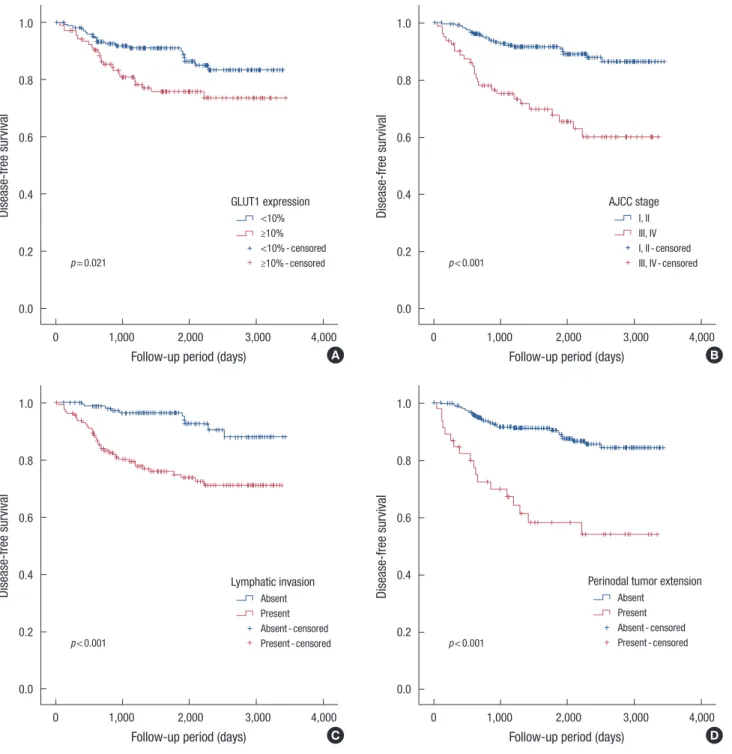
cal factors in invasive ductal carcinomas
Factor No.
Expression of GLUT1 Negative
No. (%) Positive
No. (%) p-value Age (yr)
<50 141 86 (61.0) 55 (39.0) 0.466*
≥50 135 84 (62.2) 51 (37.8)
Histological grade
1 45 37 (82.2) 8 (17.8) <0.001†
2 156 106 (67.9) 50 (32.1)
3 75 27 (36.0) 48 (64.0)
T category
T1 126 86 (68.3) 40 (31.7) 0.025*
T2, T3, T4 150 84 (56.0) 66 (44.0)
N category
N0 143 92 (64.3) 51 (35.7) 0.198*
N1, N2, N3 133 78 (58.6) 55 (41.4)
AJCC stage
I, II 202 128 (63.4) 74 (36.6) 0.194*
III, IV 74 42 (56.8) 32 (43.2)
Lymphatic invasion
Absent 129 84 (65.1) 45 (34.9) 0.158*
Present 147 86 (58.5) 61 (41.5)
Perinodal tumor extension
Absent 86 48 (55.8) 38 (44.2) 0.378*
Present 43 26 (60.5) 17 (39.5)
ER expression
Negative 125 60 (48.0) 65 (52.0) <0.001*
Positive 147 108 (73.5) 39 (26.5)
PR expression
Negative 138 66 (47.8) 72 (52.2) <0.001*
Positive 122 93 (76.2) 29 (23.8)
c-erbB-2 expression
Negative 206 131 (63.6) 75 (36.4) 0.233*
Positive 56 32 (57.1) 24 (42.9)
Triple negativity
Triple negative 60 23 (38.3) 37 (61.7) <0.001*
Non-triple negative 190 132 (69.5) 58 (30.5)
GLUT1=glucose transporter 1; AJCC=American Joint Committee on Cancer;
ER=estrogen receptor; PR=progesterone receptor.
*Fisher’s exact test; †Chi-square test for linear trend.
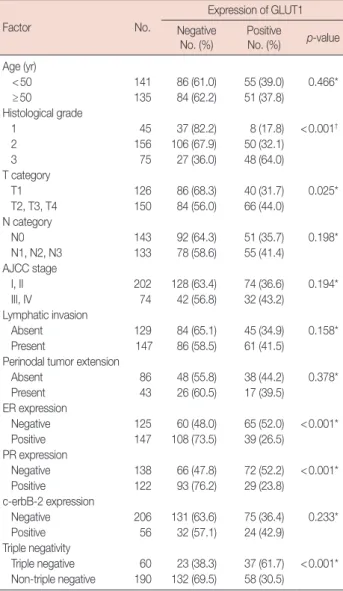
Table 3. Variables affecting risks of death and recurrence in invasive ductal carcinomas
Variable Significance univariate* Significance multivariate† HR 95% CI
Overall survival
GLUT1 expression (negative vs. positive) 0.017 0.017 2.845 1.204-6.724
AJCC stage (I, II vs. III, IV) 0.002 0.677 1.262 0.421-3.784
Lymphatic invasion (absent vs. present) 0.021 0.695 1.247 0.413-3.765
Perinodal tumor extension (absent vs. present) 0.001 0.112 2.400 0.816-7.057
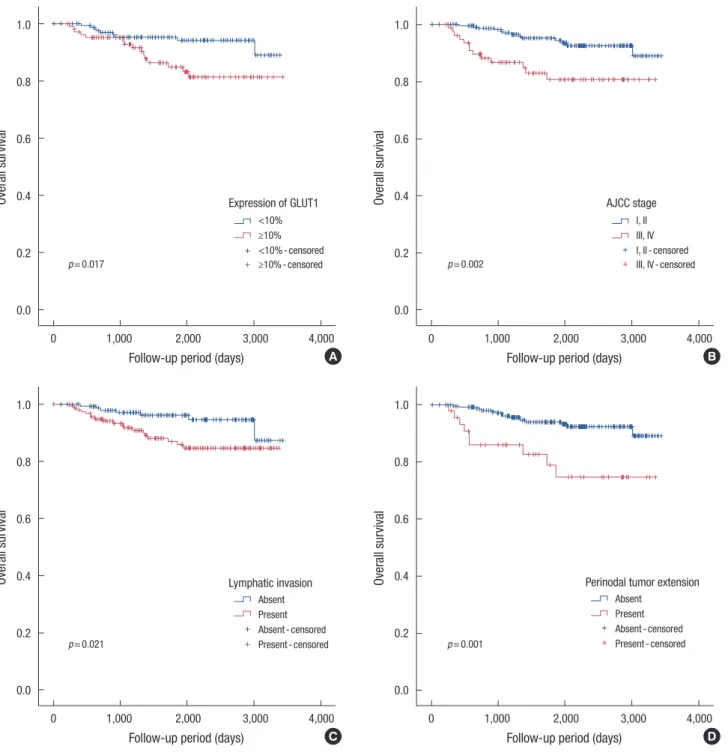
Disease-free survival
GLUT1 expression (negative vs. positive) 0.021 0.019 2.057 1.124-3.764
AJCC stage (I, II vs. III, IV) <0.001 0.330 1.454 0.684-3.091
Lymphatic invasion (absent vs. present) <0.001 0.095 2.106 0.880-5.040
Perinodal tumor extension (absent vs. present) <0.001 0.014 2.493 1.199-5.181
HR=hazard ratio; CI=confidence interval; GLUT1=glucose transporter 1; AJCC=American Joint Committee on Cancer.
*Log-rank test; †Cox proportional hazards model.
Figure 3. Cumulative overall survival curves according to glucose transporter 1 (GLUT1) expression (A), American Joint Committee on Cancer (AJCC) stage (B), lymphatic invasion (C), and perinodal tumor extension (D) (Kaplan-Meier method with log-rank test).
1.0
0.8
0.6
0.4
0.2
0.0
Overall survival
0 1,000 2,000 3,000 4,000
Follow-up period (days)
Expression of GLUT1
<10%
≥10%
<10% - censored
≥10% - censored p=0.017
1.0
0.8
0.6
0.4
0.2
0.0
Overall survival
0 1,000 2,000 3,000 4,000
Follow-up period (days) AJCC stage
I, II III, IV I, II - censored III, IV- censored p=0.002
A B
1.0
0.8
0.6
0.4
0.2
0.0
Overall survival
0 1,000 2,000 3,000 4,000
Follow-up period (days)
p=0.001
Perinodal tumor extension Absent
Present Absent - censored Present - censored
D 1.0
0.8
0.6
0.4
0.2
0.0
Overall survival
0 1,000 2,000 3,000 4,000
Follow-up period (days)
Lymphatic invasion Absent Present Absent - censored Present - censored p=0.021
C
ing was seen in >1% of tumor cells; whereas, we used a cut-off value of >10%. In these studies, GLUT1 expression was signif- icantly higher in ductal carcinoma in situ, invasive ductal car- cinoma, and lymph node metastasis than in normal tissue and ductal hyperplasia. This suggests that GLUT1 expression plays an important role in malignant transformation of the breast.
GLUT1, as a prognostic marker, has been explored somewhat
in breast cancer [22-30]. Some studies have reported correla- tions between GLUT1 expression and clinicopathological pa- rameters of breast cancers. Kang et al. [24] demonstrated that the frequency of GLUT1 expression was correlated with high- er nuclear grade (p<0.001), absence of ER (p=0.002), and absence of PR (p=0.001). Pinheiro et al. [25] reported signifi- cant associations between GLUT1 expression and high grade
Figure 4. Cumulative disease-free survival curves according to glucose transporter 1 (GLUT1) expression (A), American Joint Committee on Cancer (AJCC) stage (B), lymphatic invasion (C), and perinodal tumor extension (D) (Kaplan-Meier method with log-rank test).
1.0
0.8
0.6
0.4
0.2
0.0
Disease-free survival
0 1,000 2,000 3,000 4,000
Follow-up period (days)
GLUT1 expression
<10%
≥10%
<10% - censored
≥10% - censored p=0.021
1.0
0.8
0.6
0.4
0.2
0.0
Disease-free survival
0 1,000 2,000 3,000 4,000
Follow-up period (days) AJCC stage
I, II III, IV I, II - censored III, IV- censored p<0.001
A B
1.0
0.8
0.6
0.4
0.2
0.0
Disease-free survival
0 1,000 2,000 3,000 4,000
Follow-up period (days)
p<0.001
Perinodal tumor extension Absent
Present Absent - censored Present - censored
D 1.0
0.8
0.6
0.4
0.2
0.0
Disease-free survival
0 1,000 2,000 3,000 4,000
Follow-up period (days)
Lymphatic invasion Absent Present Absent - censored Present - censored p<0.001
C
of tumors (p=0.0014), basal-like subtype (p=0.0008), absence of PR (p=0.0162), presence of vimentin (p=0.0033), and Ki- 67 expression (p=0.0339). Ravazoula et al. [26] and Kim et al.
[27] showed that the increase of GLUT1 expression rates was correlated to the high histological grade of the breast carcino- mas. Similarly, Ahn et al. [28] found that the positive GLUT1 expression was significantly related to tumor size (p=0.003)
and histological grade (p<0.001) of the invasive breast carci- nomas. In contrast, Kuo et al. [29] found that there was no sig- nificance between GLUT1 expression and clinicopathological characteristics including patients’ age, tumor size, nuclear grade of tumor cells, lymph node metastasis, and ER and PR status.
They concluded that their exceptional results were probably caused by the small number of the population, no more than
39 cases of breast malignancies. In our study, GLUT1 expres- sion was positively correlated with higher histologic grade (p<
0.001), greater tumor size (p=0.025), absence of ER (p<0.001), absence of PR (p<0.001), and triple-negative phenotype (p<
0.001). These results suggest that breast tumors with glycolytic phenotypes are more aggressive.
The correlation between GLUT1 expression and survival in breast cancer has been little explored. Kang et al. [24] found that the mean overall survival times of GLUT1-positive and -negative patients were 48.7±2.2 and 56.1±1.3 months, respec- tively (p=0.043) and that their mean disease-free survival times were 47±2.4 and 54.3±1.3 months, respectively (p=
0.017). Ahn et al. [28] suggested that the expression of GLUT1 has a significant relationship with the patients’ survival. In their study, the mean overall survival time of the GLUT1-positive group was 115 months, and that of the GLUT1-negative group was 149 months (p=0.006). On the contrary, Pinheiro et al. [25]
found no significant difference in patients’ survival between the positive and negative patients. In our case, patients with GLUT1 expression had poorer overall survival and disease- free survival (p=0.017 and p=0.021, respectively, log-rank test) in univariate survival analysis, and GLUT1 expression was an independent prognostic factor of overall survival and disease-free survival (p=0.017 and p=0.019, respectively) in multivariate survival analysis with the Cox proportional haz- ards model. Further, we found close correlations between patients’ survival and AJCC stage, lymphatic invasion, and perinodal tumor extension in univariate and multivariate anal- yses. Interestingly, perinodal tumor extension was associated with poorer overall survival and disease-free survival (p=0.001 and p<0.001, respectively, log-rank test) in univariate survival analysis.
In conclusion, our findings indicate that GLUT1 expression plays an important role in malignant transformation in breast cancer, and may be a predictor of aggressive phenotype and poor prognosis.
CONFLICT OF INTEREST
The authors declare that they have no competing interests.
REFERENCES
1. Schmidt M, Voelker HU, Kapp M, Krockenberger M, Dietl J, Kammer- er U. Glycolytic phenotype in breast cancer: activation of Akt, up-regu- lation of GLUT1, TKTL1 and down-regulation of M2PK. J Cancer Res Clin Oncol 2010;136:219-25.
2. Singletary SE, Connolly JL. Breast cancer staging: working with the sixth edition of the AJCC Cancer Staging Manual. CA Cancer J Clin 2006;56:
37-47.
3. Warburg O. On the origin of cancer cells. Science 1956;123:309-14.
4. Rathmell JC, Fox CJ, Plas DR, Hammerman PS, Cinalli RM, Thomp- son CB. Akt-directed glucose metabolism can prevent Bax conforma- tion change and promote growth factor-independent survival. Mol Cell Biol 2003;23:7315-28.
5. Young CD, Lewis AS, Rudolph MC, Ruehle MD, Jackman MR, Yun UJ, et al. Modulation of glucose transporter 1 (GLUT1) expression levels alters mouse mammary tumor cell growth in vitro and in vivo. PLoS One 2011;6:e23205.
6. Chen C, Pore N, Behrooz A, Ismail-Beigi F, Maity A. Regulation of glut1 mRNA by hypoxia-inducible factor-1. Interaction between H-ras and hypoxia. J Biol Chem 2001;276:9519-25.
7. Semenza GL. Regulation of cancer cell metabolism by hypoxia-induc- ible factor 1. Semin Cancer Biol 2009;19:12-6.
8. Gordan JD, Simon MC. Hypoxia-inducible factors: central regulators of the tumor phenotype. Curr Opin Genet Dev 2007;17:71-7.
9. Carvalho KC, Cunha IW, Rocha RM, Ayala FR, Cajaíba MM, Begnami MD, et al. GLUT1 expression in malignant tumors and its use as an im- munodiagnostic marker. Clinics (Sao Paulo) 2011;66:965-72.
10. Park JM, Jung CK, Choi YJ, Lee KY, Kang JH, Kim MS, et al. The use of an immunohistochemical diagnostic panel to determine the primary site of cervical lymph node metastases of occult squamous cell carcino- ma. Hum Pathol 2010;41:431-7.
11. Sakashita M, Aoyama N, Minami R, Maekawa S, Kuroda K, Shirasaka D, et al. Glut1 expression in T1 and T2 stage colorectal carcinomas: its relationship to clinicopathological features. Eur J Cancer 2001;37:204-9.
12. Hammond ME, Hayes DF, Dowsett M, Allred DC, Hagerty KL, Badve S, et al. American Society of Clinical Oncology/College of American Pathologists guideline recommendations for immunohistochemical testing of estrogen and progesterone receptors in breast cancer. Arch Pathol Lab Med 2010;134:907-22.
13. Wolff AC, Hammond ME, Schwartz JN, Hagerty KL, Allred DC, Cote RJ, et al. American Society of Clinical Oncology/College of American Pathologists guideline recommendations for human epidermal growth factor receptor 2 testing in breast cancer. Arch Pathol Lab Med 2007;131:
18-43.
14. Brown RS, Wahl RL. Overexpression of Glut-1 glucose transporter in human breast cancer. An immunohistochemical study. Cancer 1993;
72:2979-85.
15. Mellanen P, Minn H, Grénman R, Härkönen P. Expression of glucose transporters in head-and-neck tumors. Int J Cancer 1994;56:622-9.
16. Nagase Y, Takata K, Moriyama N, Aso Y, Murakami T, Hirano H. Im- munohistochemical localization of glucose transporters in human renal cell carcinoma. J Urol 1995;153:798-801.
17. Merrall NW, Plevin R, Gould GW. Growth factors, mitogens, oncogenes and the regulation of glucose transport. Cell Signal 1993;5:667-75.
18. Clavo AC, Brown RS, Wahl RL. Fluorodeoxyglucose uptake in human cancer cell lines is increased by hypoxia. J Nucl Med 1995;36:1625-32.
19. Gatenby RA, Gillies RJ. Why do cancers have high aerobic glycolysis?
Nat Rev Cancer 2004;4:891-9.
20. Ganapathy V, Thangaraju M, Prasad PD. Nutrient transporters in cancer:
relevance to Warburg hypothesis and beyond. Pharmacol Ther 2009;
121:29-40.
21. Zamora-León SP, Golde DW, Concha II, Rivas CI, Delgado-López F,
Baselga J, et al. Expression of the fructose transporter GLUT5 in human breast cancer. Proc Natl Acad Sci U S A 1996;93:1847-52.
22. Chen CL, Chu JS, Su WC, Huang SC, Lee WY. Hypoxia and metabolic phenotypes during breast carcinogenesis: expression of HIF-1alpha, GLUT1, and CAIX. Virchows Arch 2010;457:53-61.
23. Hao LS, Ni Q, Jia GQ, Wang G, Qian K, Liu YJ, et al. Expression of glu- cose transporter 1 in human breast carcinoma and its clinical significance.
Sichuan Da Xue Xue Bao Yi Xue Ban 2009;40:44-7.
24. Kang SS, Chun YK, Hur MH, Lee HK, Kim YJ, Hong SR, et al. Clinical significance of glucose transporter 1 (GLUT1) expression in human breast carcinoma. Jpn J Cancer Res 2002;93:1123-8.
25. Pinheiro C, Sousa B, Albergaria A, Paredes J, Dufloth R, Vieira D, et al.
GLUT1 and CAIX expression profiles in breast cancer correlate with adverse prognostic factors and MCT1 overexpression. Histol Histo- pathol 2011;26:1279-86.
26. Ravazoula P, Batistatou A, Aletra C, Ladopoulos J, Kourounis G,
Tzigounis B. Immunohistochemical expression of glucose transporter Glut1 and cyclin D1 in breast carcinomas with negative lymph nodes.
Eur J Gynaecol Oncol 2003;24:544-6.
27. Kim BJ, Cho SH, Jung GJ, Kim SS, Hong SH, Roh MS. Expression pattern of glucose transporter GLUT1 protein & its correlation with prognostic factors in breast cancer. J Korean Breast Cancer Soc 2001;4:
161-6.
28. Ahn HJ, Lee KY, Lee SM, Koh SH, Hong SW, Oh SM, et al. Prognosis of GLUT1 expression in human breast carcinoma. J Korean Breast Cancer Soc 2001;4:167-71.
29. Kuo SJ, Wu YC, Chen CP, Tseng HS, Chen DR. Expression of glucose transporter-1 in Taiwanese patients with breast carcinoma: a prelimi- nary report. Kaohsiung J Med Sci 2006;22:339-45.
30. Younes M, Brown RW, Mody DR, Fernandez L, Laucirica R. GLUT1 expression in human breast carcinoma: correlation with known prog- nostic markers. Anticancer Res 1995;15(6B):2895-8.