Ann Lab Med 2012;32:23-30
http://dx.doi.org/10.3343/alm.2012.32.1.23
ISSN 2234-3806 • eISSN 2234-3814
Diagnostic Utility of Osteocalcin, Undercarboxylated Osteocalcin, and Alkaline Phosphatase for Osteoporosis in Premenopausal and Postmenopausal Women
Sacide Atalay, Ph.D.1, Abdullah Elci, M.D.2, Huseyin Kayadibi, M.D.3, Can B Onder, M.D.4, and Nurettin Aka, M.D.5
Department of Medical Biochemistry1, Haydarpasa Numune Teaching and Research Hospital, Istanbul; Department of Medical Biochemistry2, Acibadem Hospital, Istanbul; Department of Medical Biochemistry3, Iskenderun Military Hospital, Iskenderun, Hatay; Department of Physical Therapy and Rehabilitation4, Haydarpasa Numune Teaching and Research Hospital, Istanbul; Department of Gynecology and Obstetrics5, Haydarpasa Numune Teaching and Research Hospital, Istanbul, Turkey
Background: We aimed to investigate the diagnostic utility of osteocalcin (OC), undercar- boxylated osteocalcin (ucOC), and alkaline phosphatase (ALP) in pre- and postmenopausal women for femoral neck, L1-4, and L2-4 bone mineral density (BMD) values by taking into consideration their age, body mass index (BMI), and menopausal status.
Methods: Premenopausal (N=40) and postmenopausal cases (N=42) were classified as 25-34 or 35-45 yr of age and within the first 5 yr or 5 yr or more after the onset of meno- pause, respectively.
Results: Among the groups, statistical differences were found for age, BMI, OC, ucOC, ALP, femoral neck BMD, L1-4 BMD, and L2-4 BMD. The highest serum OC, ucOC, and ALP levels were observed in cases within the first 5 yr after the onset of menopause, prob- ably due to a more rapid bone turnover rate. The best predictors for the femoral neck os- teoporosis were ALP, OC, and calcium (areas under the ROC curve [AUC]=0.882, 0.829, and 0.761, respectively), and those for L1-4 and L2-4 osteoporosis were OC, ALP, and ucOC (AUC=0.949, 0.873, and 0.845; and 0.866, 0.819, and 0.814, respectively). Multiple logis- tic regression analysis revealed that the most discriminative parameter for osteoporosis was OC.
Conclusions: These results indicate that serum OC levels, with or without ucOC and ALP, may be useful to monitor follow-up changes that currently cannot be assessed with BMD and to diagnose femoral neck, L1-4 spine, and L2-4 spine osteoporosis.
Key Words: Bone mineral density, Menopause, Osteocalcin, Osteoporosis, Undercarboxyl- ated osteocalcin
Received: December 20, 2010 Revision received: August 23, 2011 Accepted: August 26, 2011 Corresponding author: Sacide Atalay Department of Medical Biochemistry, Haydarpasa Numune Teaching and Research Hospital, Istanbul 34700, Turkey Tel: +90-216-336-0620
Fax: +90-216-336-0620 E-mail: [email protected]
© The Korean Society for Laboratory Medicine.
This is an Open Access article distributed under the terms of the Creative Commons Attribution Non-Commercial License (http://creativecom- mons.org/licenses/by-nc/3.0) which permits un- restricted non-commercial use, distribution, and reproduction in any medium, provided the origi- nal work is properly cited.
INTRODUCTION
Osteoporosis (OP), a metabolic bone disease characterized by low bone mass and the deterioration of bone microarchitecture, has become more important as the average life span has in- creased [1]. OP occurs as a result of a pause in new bone for- mation and/or increased bone resorption. The imbalance be-
tween bone formation and resorption parallels the decreased estrogen production due to aging and/or menopause [2, 3]. Early diagnosis of OP by bone mineral density (BMD) is extremely im- portant since treatment in the advanced phase of OP is not suf- ficient to prevent bone fracture. Currently, dual energy X-ray ab- sorptiometry (DXA) is the gold standard diagnostic tool for BMD measurement [4, 5]. However, changes in BMD occur over a
long period, and it is generally not useful to repeat BMD mea- surement until the end of the first or second yr of therapy [1, 5].
Determination of the bone turnover rate using biochemical markers is used to differentiate primary OP from secondary OP, identify cases at high risk of bone fracture, select treatment type, and in particular, evaluate the effectiveness of antiresorptive therapy [6, 7].
Osteocalcin (OC), a bone-specific protein synthesized by the osteoblasts in bone, is the major non-collagen protein in the bone matrix. It has a molecular weight of 5,800 Da and contains 49 amino acids, including 3 gamma carboxyl glutamic acid resi- dues that facilitate the binding of OC to hydroxyapatite in bone [8]. The serum OC level, a sensitive marker of bone production, is associated with a high bone turnover rate and decreased BMD, and correlates well with histomorphometric indices of bone formation [9].
The fraction of OC that has undergone imperfect gamma-car- boxylation is referred to as undercarboxylated osteocalcin (ucOC).
Serum ucOC concentrations are a marker of both bone turnover and vitamin K status in bone [10]. Low dietary intake of vitamin K is related to elevated serum ucOC levels. Moreover, increased serum ucOC levels have been associated with an increased risk of hip fracture [11], and low BMD of the hip and spine in pre- and postmenopausal women [12].
Markers of bone turnover are considered useful diagnostic tools for the evaluation of bone formation and resorption. We measured serum OC and total serum alkaline phosphatase (ALP) activity as markers of bone formation. The objectives of this study were to determine the diagnostic utility of OC, ucOC, and ALP for predicting femoral neck, lumbar 1-4 (L1-4) spine, and lumbar 2-4 (L2-4) spine osteoporosis by taking into consider- ation age, body mass index (BMI), and menopausal status; in- vestigate the association between serum OC, ucOC, and ALP levels with femoral neck, L1-4 spine, and L2-4 spine BMD val- ues; determine the differences in serum OC, ucOC, and ALP concentrations between pre- and postmenopausal women of varying ages; and predict which patient group has the most rapid bone turnover rate.
METHODS
1. Study populationThis study was accepted by the local ethics committee of Hay- darpasa Numune Teaching and Research Hospital, and all in- vestigations were carried out in accordance with the criteria of Helsinki II Declaration. Postmenopausal volunteers were chosen
from the general ambulatory population of the surrounding com- munity. Participants were questioned about their medical history and were excluded if they were taking oral contraceptives, on any special diet, using any drug that affects bone metabolism, smoking, exercising regularly, or had any metabolic disease or nutritional disorder that could affect bone metabolism. A control group of 40 subjects was selected from the hospital staff and their relatives who had no known disease or complaint, and was divided into 2 groups, 25-34 yr of age (group I, N=20) and 35- 45 yr of age (group II, N=20). While 20 of the postmenopausal cases were within the first 5 yr after the onset of menopause (group III), the remaining cases (N=22) were 5 yr or more after the onset of menopause (group IV). Menopausal subjects were identified by a gynecologist based on the criteria described by WHO [13].
2. Biochemical parameters
Fasting blood samples were taken from all participants in plain tubes between 08:00 and 09:00 AM. Blood samples were centri- fuged for 30 min at 1,300×g to separate the serum. ALP, cal- cium, and phosphorus were immediately analyzed by standard laboratory methods. Serum samples were stored at -20°C, and then OC, ucOC, and total acid phosphatase activity were ana- lyzed on the same day that the samples were thawed at room temperature.
Osteocalcin was measured by an electrochemiluminescence immunoassay (E170 Modular System; Roche, Mannheim, Ger- many). OC and ucOC in serum were differentiated using BaSO4
powder as previously described by Sokoll et al. [14]. In this method, measurements were performed by incrementally in- creasing the amount of BaSO4 in the same serum pool in order to determine the optimum BaSO4 concentration that does not permit nonspecific binding, but binds all γ-carboxy glutamate residues. In an Eppendorf tube, 300 µL of serum was mixed with 100 mg of BaSO4 powder for 30 min at 4°C. It was then centri- fuged for 2 min at 10,000×g and OC precipitated. Using the su- pernatant, ucOC was determined by the OC measurement method. The lower limits of detection for OC and ucOC were 0.5 ng/mL and 0.09 ng/mL, respectively. To improve the sensitivity of ucOC, the ucOC/OC ratio was also assessed with intact OC level correction.
3. Bone mineral density measurement
BMD was measured in all individuals at the femoral neck of the left leg, L1-4 spine, and L2-4 spine using DXA (Lunar DPX-L;
Lunar, Madison, WI, USA). Osteoporosis and osteopenia were
established according to the T score; a T score above -1 was accepted as normal bone mass, between -1 and -2.5 was con- sidered osteopenia, and below -2.5 was considered osteoporosis [13]. BMD was measured on the same day that blood samples were taken for the biochemical parameters.
4. Statistical analysis
All of the statistical analyses were performed using the SPSS version 15 software package for Windows (SPSS Inc., Chicago, IL, USA) and MedCalc software for Windows (MedCalc Software Inc., Mariakerke, Belgium). Kolmogorov Smirnov analysis was performed to evaluate whether the distribution of values was normal or not. If distribution was normal, one-way ANOVA and Tukey’s HSD tests were used for intergroup comparison to de- termine the cause of the group difference. In contrast, Kruskal- Wallis Variance analysis was performed to demonstrate the dif- ferences among the 3 groups, and the Mann-Whitney U-test was used for pairwise comparison of the median values of groups to determine statistical significance. Pearson or Spearman correla- tion coefficients were preferred according to the distribution of variables to assess the association between parameters. The di- agnostic accuracy of the evaluated variables was assessed by calculating the areas under the ROC curves. We have performed the statistical analysis for the comparison of ROC curves using
MedCalc software. Multiple logistic regression analyses were carried out to determine which single parameter is most discrim- inative for OP. For each outcome, the models included terms for age, BMI, OC, ucOC, total acid phosphatase, ALP, calcium, and phosphorus. All of the reported P values were based on 2-sided tests, and those less than 0.05 were considered statistically sig- nificant.
RESULTS
Subject characteristics are summarized in Table 1. The ages of the postmenopausal women ranged from 43 to 74 yr old (mean
±SD: 58±8), while the premenopausal women’s ages ranged from 25 to 44 yr old (mean±SD: 35±6). Two and six osteopo- rotic women were observed in the first 5 yr after menopause group, and more than 5 yr after menopause group, respectively.
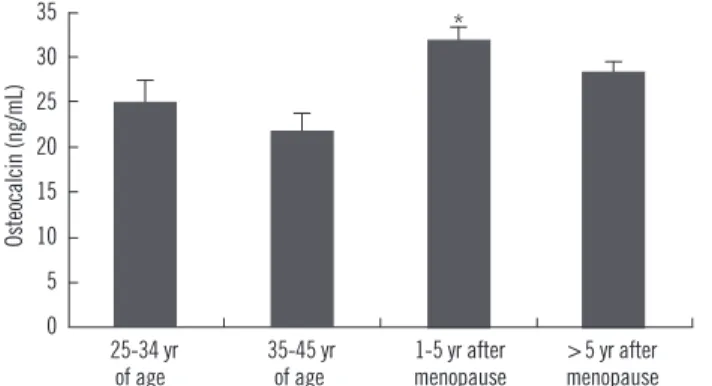
The mean serum OC, ucOC, and ALP concentrations were sig- nificantly higher in postmenopausal women than in premeno- pausal women (Table 1). Serum OC and ucOC concentrations differed significantly among the groups (P =0.012 and P =0.003, respectively). Significant difference was observed between group III and group II for OC (Fig. 1, P =0.001), and between group III and both group II (P =0.002) and group I (P =0.038) for ucOC.
The ucOC/OC ratio differed slightly, although it was not statisti- Table 1. Comparison of parameters according to menopausal status*
Variable
Premenopausal group (N=40) Postmenopausal group (N=42) Group I P
25-34 yr of age (N=20)
Group II 35-45 yr of age
(N=20)
Group III 1-5 yr after menopause
(N=20)
Group IV
≥5 yr after menopause (N=22)
Age (yr)† 30±4 40±3 53±7 63±7 <0.001
BMI 21.2±1.7‡ 24.6±2.9 28.9±4.1 28.5±4.0 <0.001
OC (ng/mL) 24.9±6.3 21.7±9.5 31.8±12.0§ 28.3±10.4 0.012
ucOC (ng/mL) 1.48±0.52 1.21±0.72 2.25±1.16II 1.71±0.92 0.003
ucOC/OC ratio (%) 5.9±1.3 5.5±1.5 7.0±2.7 5.9±2.0 0.072
TACP (IU/L) 2.42±0.58 2.69±0.76 2.86±0.51 2.66±0.44 0.129
ALP (IU/L) 56±13 65±13 92±18¶ 90±21** <0.001
Calcium (mg/dL) 9.7±0.3 9.5±0.3 9.7±0.4 9.7±0.4 0.089
Phosphorus (mg/dL) 3.6±0.4 3.6±0.4 3.5±0.4 3.5±0.3 0.838
BMD, Femoral neck (g/cm2) 0.957±0.115 0.950±0.136 0.880±0.122 0.810±0.110†† 0.002
BMD, L1-4 (g/cm2) 1.144±0.123 1.179±0.135 1.017±0.153‡‡ 0.982±0.132§§ <0.001
BMD, L2-4 (g/cm2) 1.205 + 0.131 1.214 + 0.147 1.043 + 0.155II II 0.989 +0.132¶¶ <0.001
*Variables are expressed as arithmetic mean±SD; †P values were <0.001 for all of the pairwise groups; ‡P =0.011 vs. group II, P =0.005 vs. group III, P <0.001 vs. group III and group IV; §P =0.001 vs. group II; IIP =0.038 vs. group I, P =0.002 vs. group II; ¶P <0.001 vs. group I and group II; **P < 0.001 vs. group I and group II; ††P =0.014 vs. group I, P =0.006 vs. group II; ‡‡P =0.02 vs. group I, P =0.002 vs. group II; §§P <0.001 vs. group I and group II; II IIP =0.03 vs.
group I, P =0.006 vs. group II; ¶¶P <0.001 vs. group I and group II.
Abbreviations: OC, osteocalcin; ucOC, undercarboxylated osteocalcin; TACP, total acid phosphatase; ALP, alkaline phosphatase; BMD, bone mineral density.
cally significant (P =0.072).
Comparison showed that the BMD values differed significantly among the groups (Table 1 and Fig. 2). Serum OC levels for the groups based on the T score of femoral neck, L1-4 spine, and L2-4 spine BMD are shown in Fig. 3. Comparisons of the evalu- ated parameters among the groups according to the BMD T score are shown in Table 2-4. Femoral neck BMD values were inversely correlated with age and serum OC level (r=-0.358, P = 0.004 and r=-0.296, P =0.016, respectively). Highly significant inverse correlations were observed between L1-4 spine BMD values and age, serum OC, ucOC, and ALP values (r=-0.425, P <0.001; r=-0.431, P <0.001; r=-0.349, P =0.001; and r=-0.393, P <0.001, respectively). In addition, L2-4 spine BMD values were inversely correlated with age, and serum OC, ucOC, and ALP levels (r =-0.459, P <0.001; r =-0.423, P <0.001; r =-0.299, P = Fig. 1. Distribution of serum osteocalcin levels in 4 different groups
of menopausal status. *, P =0.001 vs. the 35-45 yr age-group.
Osteocalcin (ng/mL)
35 30 25 20 15 10 5
0 25-34 yr 35-45 yr 1-5 yr after >5 yr after of age of age menopause menopause
*
Fig. 3. Distribution of serum osteocalcin levels in normal, osteope- nia and osteoporosis groups. *, P =0.017 vs. the normal group; †, P =0.029 vs. the normal group; ‡, P =0.001 vs. the normal group and P =0.011 vs. the osteopenia group; §, P <0.001 vs. the normal group and P =0.004 vs. the osteopenia group; *†, P <0.001 vs. the normal group and P =0.029 vs. the osteopenia group.
Femoral neck L 1-4 L 2-4
Osteocalcin (ng/mL)
50 45 40 35 30 25 20 15 10 5
0 Normal Osteopenia Osteoporosis
*
*†
‡
†
§
Fig. 2. Distribution of femoral neck, L1-4 spine, and L2-4 spine BMD values in 4 different groups of menopausal status. *, P =0.02 vs. the 25-34 yr age-group and P =0.002 vs. the 35-45 yr age- group; †, P =0.03 vs. the 25-34 yr age-group and P =0.006 vs. the 35-45 yr age-group; ‡, P =0.014 vs. the 25-34 yr age-group and P =0.006 vs. the 35-45 yr age-group; §, P <0.001 vs. the 25-34 yr age-group and the 35-45 yr age-group; *†, P <0.001 vs. the 25-34 yr age-group and the 35-45 yr age-group.
Femoral neck L 1-4 L 2-4
BMD (g/cm2) 1.4 1.2 1 0.8 0.6 0.4 0.2
0 25-34 yr 35-45 yr 1-5 yr after >5 yr after of age of age menopause menopause
*
‡
† § *†
Table 2. Comparison of parameters according to femoral neck BMD*
Variable Normal
(N=50) Osteopenia
(N=26) Osteoporosis
(N=6) P
Age (yr) 44 (38-56) 56 (42-65) 58 (52-66)† 0.037
BMI 26.2 (23.5-30.5) 25.6 (22.4-28.8) 25.8 (24.1-27.5) 0.587
OC (ng/mL) 23.9 (19.5-30.3) 26.9 (17.9-31.4) 43.5 (29.1-55.7)‡ 0.028
ucOC (ng/mL) 1.38 (0.97-2.16) 1.42 (1.00-1.71) 2.17 (1.41-4.12)§ 0.050
ucOC/OC ratio (%) 6.0 (5.0-6.8) 5.7 (4.4-6.7) 5.7 (4.6-7.0) 0.687
TACP (IU/L) 2.7 (2.4-3.0) 2.7 (2.1-3.0) 2.9 (2.4-3.4) 0.760
ALP (IU/L) 68 (55-88) 80 (62-89) 107 (94-129)II 0.005
Calcium (mg/dL) 9.7 (9.4-9.9) 9.5 (9.3-9.8) 10.0 (9.7-10.2) 0.080
Phosphorus (mg/dL) 3.6 (3.4-3.9) 3.5 (3.3-3.8) 3.6 (3.0-3.8) 0.818
*Variables are expressed as median (25th-75th interquartile range); †P =0.026 vs. the normal group; ‡P =0.001 vs. the normal group, P =0.011 vs. the os- teopenia group; §P =0.050 vs. the osteopenia group; IIP =0.002 vs. the normal group, P =0.004 vs. the osreopenia group.
Abbreviations: BMD, bone mineral density; BMI, body mass index; OC, osteocalcin; ucOC, undercarboxylated osteocalcin; TACP, total acid phosphatase; ALP, alkaline phosphatase.
0.015; and r=-0.393, P <0.001, respectively).
1. ROC analysis
ROC curve analysis was used to determine the discriminative power of each evaluated parameter for osteoporosis. The area under the ROC curves (AUC) based on femoral neck osteoporo- sis (AUC =0.882, P =0.002 for ALP; AUC =0.829, P =0.008 for OC; AUC=0.761, P =0.034 for calcium), L1-4 spine osteoporosis (AUC=0.949, P =0.003 for OC; AUC=0.873, P =0.012 for ALP;
AUC=0.845, P =0.021 for ucOC), and L2-4 spine osteoporosis (AUC=0.866, P =0.003 for OC; AUC=0.819, P =0.010 for ALP;
AUC=0.814, P =0.011 for ucOC) were calculated separately for
significant variables (Fig. 4). There were no statistically significant differences in comparison of the ROC curves between pairwise markers except for OC and ucOC to determine the OP. This sig- nificance was observed in L1-4 OP (P =0.007).
2. Predictors of osteoporosis
A multiple logistic regression analysis revealed that OC has the highest predictive value for OP (P =0.029, P <0.001, and P = 0.002 for femoral neck, L1-4 spine osteoporosis, and L2-4 spine osteoporosis, respectively) when all of the evaluated biochemi- cal parameters, age, BMI, and menopausal status of women were included in the equation.
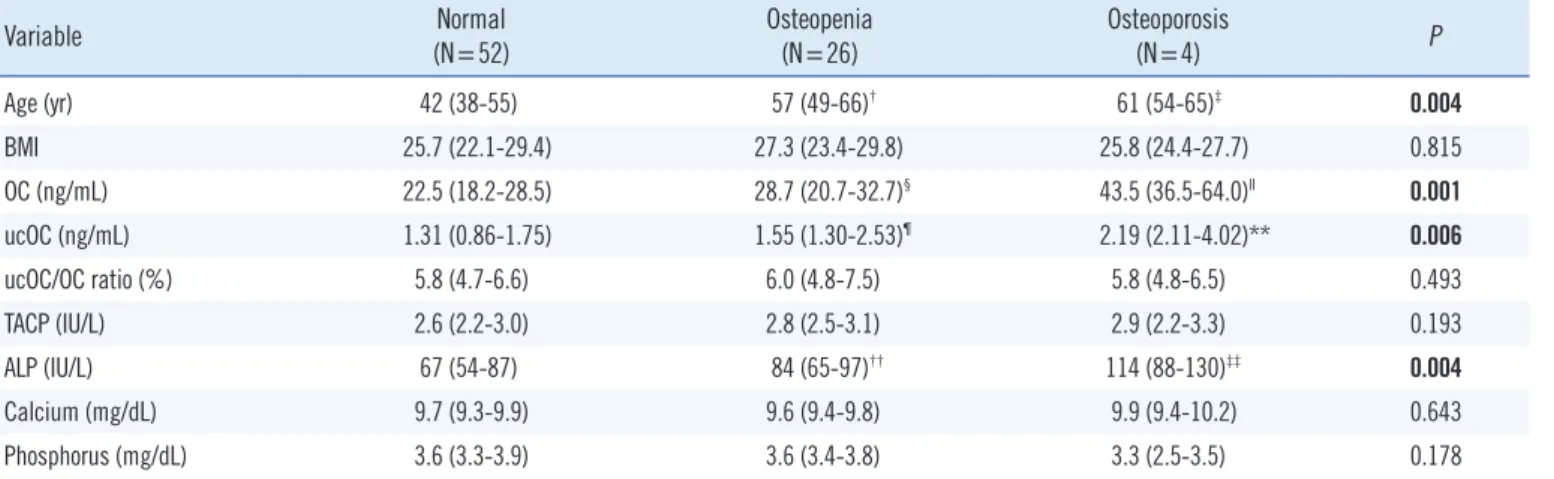
Table 3. Comparison of parameters according to L1-4 BMD*
Variable Normal
(N=52) Osteopenia
(N=26) Osteoporosis
(N=4) P
Age (yr) 42 (38-55) 57 (49-66)† 61 (54-65)‡ 0.004
BMI 25.7 (22.1-29.4) 27.3 (23.4-29.8) 25.8 (24.4-27.7) 0.815
OC (ng/mL) 22.5 (18.2-28.5) 28.7 (20.7-32.7)§ 43.5 (36.5-64.0)II 0.001
ucOC (ng/mL) 1.31 (0.86-1.75) 1.55 (1.30-2.53)¶ 2.19 (2.11-4.02)** 0.006
ucOC/OC ratio (%) 5.8 (4.7-6.6) 6.0 (4.8-7.5) 5.8 (4.8-6.5) 0.493
TACP (IU/L) 2.6 (2.2-3.0) 2.8 (2.5-3.1) 2.9 (2.2-3.3) 0.193
ALP (IU/L) 67 (54-87) 84 (65-97)†† 114 (88-130)‡‡ 0.004
Calcium (mg/dL) 9.7 (9.3-9.9) 9.6 (9.4-9.8) 9.9 (9.4-10.2) 0.643
Phosphorus (mg/dL) 3.6 (3.3-3.9) 3.6 (3.4-3.8) 3.3 (2.5-3.5) 0.178
*Variables are expressed as median (25-75th interquartile range); †P =0.004 vs. the normal group; ‡P =0.031 vs. the normal group; §P =0.017 vs. the normal group; IIP <0.001 vs. the normal group, P =0.004 vs. the osteopenia group; ¶P =0.021 vs. the normal group; **P =0.010 vs. the normal group; ††P =0.023 versus the normal group; ‡‡P =0.005 vs. the normal group, P =0.038 vs. the osteopenia group.
Abbreviations: BMD, bone mineral density; BMI, body mass index; OC, osteocalcin; ucOC, undercarboxylated osteocalcin; TACP, total acid phosphatase;
ALP, alkaline phosphatase.
Table 4. Comparison of parameters according to L2-4 BMD*
Variable Normal
(N=52) Osteopenia
(N=24) Osteoporosis
(N=6) P
Age (yr) 42 (38-55) 57 (49-68)† 59 (52-64)‡ 0.005
BMI 25.7 (22.1-29.4) 27.3 (23.1-30.0) 25.8 (24.4-28.4) 0.847
OC (ng/mL) 22.5 (18.2-28.5) 28.7 (20.0-33.5)§ 36.7 (30.9-54.6)II 0.001
ucOC (ng/mL) 1.31 (0.86-1.75) 1.55 (1.29-2.30)¶ 2.19 (1.95-3.20)** 0.005
ucOC/OC ratio (%) 5.8 (4.7-6.6) 6.0 (5.0-7.3) 5.8 (4.6-7.6) 0.561
TACP (IU/L) 2.6 (2.2-3.0) 2.8 (2.5-3.1) 3.1 (2.5-3.4) 0.128
ALP (IU/L) 67 (54-87) 84 (62-95)†† 104 (81-129)‡‡ 0.004
Calcium (mg/dL) 9.7 (9.3-9.9) 9.6 (9.4-9.8) 10.0 (9.5-10.2) 0.222
Phosphorus (mg/dL) 3.6 (3.3-3.9) 3.6 (3.4-3.8) 3.5 (3.0-3.8) 0.671
*Variables are expressed as median (25-75th interquartile range); †P =0.007 vs. the normal group; ‡P =0.014 vs. the normal group; §P =0.029 vs. the normal group; IIP <0.001 vs. the normal group, P =0.029 vs. the osteopenia group; ¶P =0.037 vs. the normal group; **P =0.004 vs. the normal group; ††P =0.034 vs.
the normal group; ‡‡P =0.004 vs. the normal group, P =0.050 vs. the osteopenias group.
Abbreviations: BMD, bone mineral density; BMI, body mass index; OC, osteocalcin; ucOC, undercarboxylated osteocalcin; TACP, total acid phosphatase;
ALP, alkaline phosphatase.
DISCUSSION
In the present study, serum OC, ucOC, and ALP concentrations were significantly higher in women in the postmenopausal group than in those in the premenopausal group. The highest serum OC, ucOC, and ALP concentrations were observed in patients within 1-5 yr after the onset of menopause, probably due to in- creased bone turnover rate. Osteocalcin, with or without ucOC and ALP, could be a useful diagnostic tool to select patients with probable femoral neck, L1-4 spine, or L2-4 spine osteoporosis for BMD measurement.
BMD is the most valuable diagnostic tool to differentiate pa- tients with OP from healthy individuals. However, only changes that take place over long periods of time can be measured by
BMD, and changes due to therapy cannot be immediately ob- served. Biochemical bone markers are non-invasive and less expensive diagnostic tools that are beneficial for diagnosis and treatment follow-up of metabolic bone diseases. In addition, while BMD measurements reflect the static status of bone tis- sue, biochemical bone markers show the dynamic status [1, 5, 14, 15]. Therefore, using BMD measurements together with these markers can make the diagnosis, risk evaluation, and therapy of OP more effective.
Osteocalcin is a product of osteoblasts that is considered a marker of bone formation [9]. However, osteocalcin is also re- leased from the bone matrix into blood during bone resorption, suggesting that osteocalcin is also a marker of bone turnover [16]. Therefore, the higher serum osteocalcin levels and ALP Fig. 4. ROC curve analysis of biochemical bone markers for osteo- porosis. (A) femoral neck osteoporosis (AUC=0.882, P =0.002 for ALP; AUC=0.829, P =0.008 for OC; AUC=0.761, P =0.034 for cal- cium), (B) L1-4 spine osteoporosis (AUC=0.949, P =0.003 for OC;
AUC=0.873, P =0.012 for ALP; AUC=0.845, P =0.021 for ucOC), and (C) L2-4 spine osteoporosis (AUC =0.866, P =0.003 for OC;
AUC=0.819, P =0.010 for ALP; AUC=0.814, P =0.011 for ucOC).
Abbreviations: AUC, area under the curve; ALP, alkaline phosphatase;
OC, osteocalcin; ucOC, undercarboxylated osteocalcin.
OC ALP Ca Reference Line
Sensitivity
1.0
0.8
0.6
0.4
0.2
0.0
1-Specificity
0.0 0.2 0.4 0.6 0.8 1.0 A
OC ucOC ALP Reference Line
Sensitivity
1.0
0.8
0.6
0.4
0.2
0.0
1-Specificity
0.0 0.2 0.4 0.6 0.8 1.0 B
OC ucOC ALP Reference Line
Sensitivity
1.0
0.8
0.6
0.4
0.2
0.0
1-Specificity
0.0 0.2 0.4 0.6 0.8 1.0 C
observed in women within the first 5 yr after the onset of meno- pause may reflect an increased bone turnover rate rather than simply increased bone formation, and thus may be associated with an increased risk of bone fracture and OP.
Although the amount of ucOC is considered a sensitive mea- sure of vitamin K status in bone, we did not measure the con- centration of vitamin K. However, according to the medical his- tory of our study population, they seemed to have healthy vita- min K statuses. In addition, vitamin K deficiency increases with age; but, in the present study, older (group IV) patients had lower ucOC levels than younger (group III) patients, although there was also no significant positive correlation between ucOC and age. Therefore, we did not consider vitamin K deficiency in our study population.
Within a woman’s life span, 75% of total bone loss is seen during the postmenopausal period due to estrogen deficiency (52-66%) and aging (34-48%). Bone loss in early postmeno- pausal women is more rapid due to more rapid osteoporosis, and 30% of total body bone mass is lost in the first 15-20 yr after the onset of menopause [13, 17, 18]. Based on our findings, the rate of bone loss in postmenopausal women seems to be greater within the first 5 yr after the onset of menopause. OC, ucOC, the ucOC/OC ratio, and ALP concentration were significantly higher in osteoporotic women compared with non-osteoporotic women.
Therefore, these results could influence their corresponding therapeutic strategies, by adding antiresorptive drugs for peri- and early postmenopausal women. In the current study, we per- formed a multiple logistic regression analysis to control for prob- able confounding variables such as BMD, age, and the meno- pausal status of women. According to the ROC and multiple lo- gistic regression analyses, OC may be a useful diagnostic tool to select patients with probable OP and to effectively personalize their therapy.
Plantalech et al. [19] reported that total OC and ucOC serum levels were significantly higher in postmenopausal women than in premenopausal women, as was observed in our study. We considered that while the bone turnover rate is steady in pre- menopausal women, it was induced during the postmenopausal period; thus, OC and ALP concentrations were elevated.
Serum ucOC is expressed as a percentage of total OC. This ratio seemed to be increased in postmenopausal women com- pared with premenopausal women; but, the increase was not statistically significant (P =0.072). Szulc et al. [20] stated that ucOC could be a predictor of hip fracture risk in elderly women, because serum ucOC levels were higher in 70-101-yr-old women than in a younger premenopausal control group, and 23% had
values greater than the normal premenopausal range. In a study of women aged 20-90 yr, Knapen et al. [21] observed a strong inverse relationship between serum ucOC/OC ratio and femoral neck BMD levels during the first 10 yr after the onset of meno- pause; however, we did not observe such a relationship. Yasui et al. [22] also did not find an association between serum ucOC and L1-4 spine BMD; however, they observed higher ucOC lev- els in perimenopausal women than in others. In the present study, the difference in this ratio among the groups was not sig- nificant, because there was a fewer number of patients in each subgroup.
The present study has some limitations. First, the number of the women with osteoporosis was low. Second, we did not mea- sure other specific bone turnover markers that could support the importance of the first 5 yr after the onset of menopause for OP and OP therapy.
In conclusion, the observations in this study suggest that mea- suring serum osteocalcin concentration may be helpful to moni- tor follow-up changes that currently cannot be assessed with BMD, and the elevation of osteocalcin levels could be a more efficient method to detect patients with fast bone turnover rates after the onset of menopause. Determination of osteocalcin lev- els in serum could be helpful to predict probable femoral neck, L1-4 spine, and L2-4 spine osteoporosis before performing BMD.
Authors’ Disclosures of Potential Conflicts of Interest
No potential conflict of interest relevant to this article was re- ported.
REFERENCES
1. NIH consensus development panel on osteoporosis prevention, diagno- sis, and therapy, March 7-29, 2000: highlights of the conference. South Med J 2001;94:569-73.
2. Garnero P, Sornay-Rendu E, Chapuy MC, Delmas PD. Increased bone turnover in late postmenopausal women is a major determinant of os- teoporosis. J Bone Miner Res 1996;3:337-49.
3. Christiansen C and Lindsay R. Estrogens, bone loss and preservation.
Osteoporos Int 1990;1:7-13.
4. Dalle Carbonare L, Giannini S. Bone microarchitecture as an important determinant of bone strength. J Endocrinol Invest 2004;27:99-105. 5. Kanis JA. Diagnosis of osteoporosis and assessment of fracture risk.
Lancet 2002;359:1929-36.
6. Sinaki M. Prevention and treatment of osteoporosis. In: Braddom RL.
Ed. Physical medicine and rehabilitation, 3rd ed. Elsevier, Philadelphia:
Elsevier, 2006:929-49.
7. Garnero P and Delmas PD. Biochemical markers of bone turnover. Ap- plications for osteoporosis. Endocrinol Metab Clin North Am 1998;27:
303-23.
8. Allison JL, Stephen H, Richard E. Measurement of osteocalcin. Ann Clin Biochem 2000;37:432-46.
9. Swaminathan R. Biochemical markers of bone turnover. Clin Chim Acta 2001;313:95-105.
10. Aonuma H, Miyakoshi N, Hongo M, Kasukawa Y, Shimada Y. Low se- rum levels of undercarboxylated osteocalcin in postmenopausal osteo- porotic women receiving an inhibitor of bone resorption. Tohoku J Exp Med 2009;218:201-5.
11. Vergnaud P, Garnero P, Meunier PJ, Bréart G, Kamihagi K, Delmas PD.
Undercarboxylated osteocalcin measured with a specific immunoassay predicts hip fracture in eldery women: the EPIDOS study. J Clin Endo- crinol Metab 1997;82:719-24.
12. Booth SL, Broe KE, Gagnon DR, Tucker KL, Hannan MT, McLean RR, et al. Vitamin K intake and bone mineral density in women and men.
Am J Clin Nutr 2003;77:512-6.
13. Assessment of fracture risk and its application to screening for post- menopausal osteoporosis. Report of a WHO study group. World Health Organ Tech Rep Ser 1994;943:1-129.
14. Sokoll LJ, O’Brien ME, Camilo ME, Sadowski JA. Undercarboxylated os- teocalcin and development of a method to determine vitamin K status.
Clin Chem 1995;41:1121-8.
15. Chailurkit LO, Ongphiphadhanakul B, Piaseu N, Saetung S, Rajatanavin R. Biochemical markers of bone turnover and response of bone mineral density to intervention in early postmenopausal women: an experience
in a clinical laboratory. Clin Chem 2001;47:1083-8.
16. Ivaska KK, Hentunen TA, Vääräniemi J, Ylipahkala H, Pettersson K, Väänänen HK. Release of intact and fragmented osteocalcin molecules from bone matrix during bone resorption in vitro. J Biol Chem 2004;279: 18361-9.
17. Lindsay R. The menopause and osteoporosis. Obstet Gynecol 1996;87 (S2):S16-9.
18. Gnudi S, Mongiorgi R, Figus E, Bertocchi G. Evaluation of the relative rates of bone mineral content loss in postmenopause due to both estro- gen deficiency and ageing. Boll Soc Ital Biol Sper 1990;66:1153-9. 19. Plantalech L, Guillaumont M, Vergnaud P, Leclercq M, Delmas PD. Im-
pairment of gamma carboxylation of circulating osteocalcin (bone gla protein) in elderly women. J Bone Miner Res 1991;6:1211-6.
20. Szulc P, Chapuy MC, Meunier PJ, Delmas PD. Serum undercarboxylat- ed osteocalcin is a marker of the risk of hip fracture in elderly women. J Clin Invest 1993;91:1769-74.
21. Knapen MH, Nieuwenhuijzen Kruseman AC, Wouters RS, Vermeer C.
Correlation of serum osteocalcin fractions with bone mineral density in women during the first 10 yr after menopause. Calcif Tissue Int 1998; 63:375-9.
22. Yasui T, Uemura H, Tomita J, Miyatani Y, Yamada M, Miura M, et al. As- sociation of serum undercarboxylated osteocalcin with serum estradiol in pre-, peri- and early post-menopausal women. J Endocrinol Invest 2006;29:913-8.