ISSN 2234-3806 • eISSN 2234-3814
238 www.annlabmed.org http://dx.doi.org/10.3343/alm.2015.35.2.238 Ann Lab Med 2015;35:238-241
http://dx.doi.org/10.3343/alm.2015.35.2.238
Brief Communication
Clinical Chemistry
Evaluation of Random Urine Sodium and Potassium Compensated by Creatinine as Possible Alternative Markers for 24 Hours Urinary Sodium and Potassium Excretion
Hyunmin Koo, M.D., Sang-Guk Lee, M.D., and Jeong-Ho Kim, M.D.
Department of Laboratory Medicine, Yonsei University College of Medicine, Seoul, Korea
Sodium and potassium intake was assessed on the basis of its respective excretion levels in 24 hr urine samples. However, owing to the inconvenience of collection, we evaluated random spot urine for alternative sodium and potassium excretion markers. We included 250 patients who submitted 24 hr- and spot urine for clinical tests. However, 22 patients who showed 24 hr urine creatinine excretion levels <500 mg/day were excluded, because these samples possibly resulted from incomplete urine collection. Moreover, 24 patients were excluded because of their use of diuretics during the urine collection period. We ob- served significant correlations between 24 hr urine sodium excretion and both the so- dium/creatinine (r =0.34, P <0.0001) and the sodium/specific gravity unit (SGU) ratios (r=0.19, P =0.007) in random urine samples. Similarly, 24 hr urine potassium excretion and both the spot urine potassium/creatinine (r=0.47, P <0.0001) and potassium/SGU ratios (r=0.28, P <0.0001) were significantly correlated. Although the estimated sodium/
creatinine and potassium/creatinine ratios showed a significant correlation with 24 hr urine sodium and potassium excretion, respectively, further studies are required to de- velop a spot urine test for individualized monitoring of sodium and potassium excretion.
Key Words: 24 hr urine, Sodium, Potassium, Excretion, Sodium/creatinine ratio, Potas- sium/creatinine ratio
Received: June 3, 2014
Revision received: September 19, 2014 Accepted: October 30, 2014
Corresponding author: Jeong-Ho Kim Department of Laboratory Medicine, Yonsei University College of Medicine, 50-1 Yonsei-ro, Seodaemun-gu, Seoul 120-752, Korea
Tel: +82-2-2228-2448 Fax: +82-2-364-1583 E-mail: [email protected]
© The Korean Society for Laboratory Medicine This is an Open Access article distributed under the terms of the Creative Commons Attribution Non-Commercial License (http://creativecom- mons.org/licenses/by-nc/3.0) which permits unrestricted non-commercial use, distribution, and reproduction in any medium, provided the original work is properly cited.
Hypertension is one of the most common causes of cardiovascu- lar disease and often results from excessive sodium intake [1].
Therefore, reduced sodium intake is widely recommended for the control of hypertension [2, 3]. To evaluate daily salt intake, researchers typically employ either a diet survey using a ques- tionnaire or direct measurement of 24 hr urine sodium excretion.
Diet surveys rely on the memories of patients and are, therefore, difficult to evaluate objectively. Moreover, a professional nutrition- ist is required to perform the analysis. Direct measurement of so- dium excretion in 24 hr urine samples is considered the most accurate method to date. However, this method is limited by the difficulty of urine collection and high error rate in specimen col-
lection [4]. Therefore, there is a clear need to identify and vali- date indicators that can be used to assess salt intake in random urine samples. Possible candidates include the sodium/creati- nine (Na+/Cr) ratio or the sodium/specific gravity unit (Na+/SGU) ratio, where SGU is calculated as (specific gravity-1)×100 [5].
However, sufficient verification of the accuracy of these markers as indicators of daily salt intake is required, before they can be employed in general clinical practice.
In this study, we performed a head-to-head comparison be- tween 24 hr urine sodium excretion and the random urine Na+/ Cr ratio or the random urine Na+/SGU ratio to evaluate whether random urine markers could be used as alternative markers for
Koo H, et al.
Alternative markers for 24 hr urinary Na+ and K+
http://dx.doi.org/10.3343/alm.2015.35.2.238 www.annlabmed.org 239
daily sodium intake. In addition, we analyzed the correlations between both the potassium/creatinine (K+/Cr) and potassium/
SGU (K+/SGU) ratios of random urine samples and potassium excretion levels in 24 hr urine samples. The correlation between the sodium/potassium (Na+/K+) ratios of random and 24 hr urine samples was also examined [6, 7].
This study was approved by the institutional review board of Severance Hospital (No. 4-2013-0252). We analyzed leftover 24 hr and random urine assay samples, which were collected on the same day from 250 patients visiting Severance Hospital between March and May 2013. Twenty-two patient samples whose total 24 hr creatinine mass <500 mg were excluded from the study, because these samples possibly resulted from insufficient collection [8]. In addition, we also excluded 24 pa- tients who were on diuretic medication at the time of the experi- ment [9]. Therefore, a total of 204 patients were evaluated. The sodium, potassium, and creatinine levels in random and 24 hr urine were measured by using an AU680 Chemistry Analyzer (Beckman Coulter, Brea, CA, USA). We used Spearman correla- tion analysis to evaluate the correlations between spot urine and 24 hr urine markers, and all analyses were performed by using Analyse-it software (Analyse-It Software, Leeds, UK).
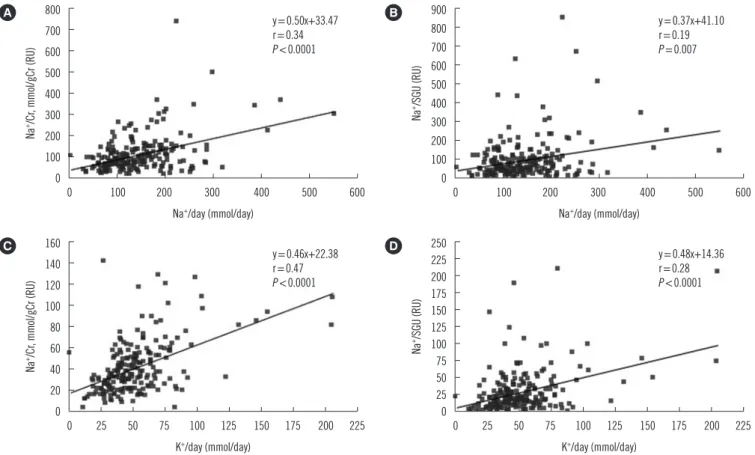
The median and interquartile ranges of measured values are presented in Table 1. We observed significant, though weak, cor- relations between 24 hr urine sodium excretion (mmol/day) and both the random urine Na+/Cr (mmol/gCr) (r=0.34, P <0.0001) and Na+/SGU ratios (r=0.19, P =0.0070) (Fig. 1). Similarly, we observed slightly better correlations between 24 hr urine potas- sium excretion (mmol/day) and both the random urine K+/Cr (mmol/gCr) (r =0.47, P <0.0001) and K+/SGU ratios (r =0.28,
P <0.0001) (Fig. 1). In addition, we found that the 24 hr urine Na+/K+ ratio correlated with that of random urine samples (r=0.47, P <0.0001) (Fig. 2).
Although some studies have reported that the Na+/Cr ratio is correlated to blood pressure [10-13], few studies have shown head-to-head comparisons between 24 hr sodium excretion and spot urine sample markers. Mann and Gerber reported that 24 hr sodium excretion could be predicted either from the spot urine Na+/Cr ratio (r =0.67, n =45, P <0.01) or from the spot urine Na+ (mEq/L)/Cr (mg/L) ratio and 24 hr creatinine excretion (mg) (r=0.86, n=45, P <0.01) [9]. Tanaka et al. [14] reported a correlation between measured 24 hr urine sodium or potas- sium excretion and expected 24 hr urine sodium or potassium excretion, which could be calculated by using spot urine so- dium or potassium, age, body weight, and height. The expected 24 hr urine sodium or potassium were calculated by using the following formulae: 21.98 ×[Na+ (mEq/L)/Cr (mg/L) × (-2.04 ×age+14.89 ×body weight (kg)+16.14 ×height (cm) -2,244.45)]0.392 for sodium, and 7.59×[K+ (mEq/L)/Cr (mg/L)×
(-2.04 ×age+14.89 ×body weight (kg)+16.14 ×height (cm)- 2,244.45)]0.431 for potassium. The correlation coefficient be- tween measured value and expected value was 0.53 for sodium and 0.54 for potassium. In addition, Kawano et al. [4] reported that the correlation coefficient between use of a questionnaire and 24 hr urinary sodium excretion for 467 outpatients was 0.35, which was similar to our result. The Working Group for Di- etary Salt Reduction of the Japanese Society of Hypertension (JSH) proposed guidelines for the evaluation of salt intake for the management of hypertension [4]. The guidelines stated that salt intake could be estimated from random urine Na+/Cr ratios in general medical facilities, as it is easy and practical to assess.
However, such estimates have shown limited reliability.
Our study provides evidence that weak but significant correla- tions exist between both 24 hr sodium and potassium excretion levels and spot urine sample levels, and, in turn, supports the use of spot urine markers as possible alternative markers to monitor daily sodium intake or potassium intake. However, our study had a few limitations. One of these was that our correlation coefficients for the results were relatively low. In a previous study regarding the correlation between 24 hr albumin excretion and the spot urine albumin/Cr ratio, the correlation coefficient was 0.81 (n=2579, P <0.001) [15]. The relatively weak correlation we observe using electrolytes may be due to a larger intra-indi- vidual biological variation of urine electrolytes compared to that of albumin [16]. Second, owing to circadian variation of sodium and potassium, late morning urine specimens or early evening Table 1. Measured and calculated values of each parameter in the
participants (n=204)
24-hr urine RU
Parameter Na+, mmol/24 hr Na+/Cr, mmol/gCr Na+/SGU
Median 132.96 83.52 64.09
Interquartile range 94.12-188.05 56.06-130.89 34.8-112.82 Parameter K+, mmol/24 hr K+/Cr, mmol/gCr K+/SGU
Median 47.59 39.58 29.34
Interquartile range 35.46-61.89 27.49-58.51 18.69-48.91
Parameter Na+/K+ Na+/K+
Median 3.02 2.08
Interquartile range 2.18-4.02 1.35-3.01
Abbreviations: RU, random urine; SGU, specific gravity unit, SGU is calcu- lated as “(specific gravity-1)×100”; Na+/Cr, sodium/creatinine ratio; K+/Cr, potassium/creatinine ratio.
Koo H, et al.
Alternative markers for 24 hr urinary Na+ and K+
240 www.annlabmed.org http://dx.doi.org/10.3343/alm.2015.35.2.238 urine specimens would generally be recommended for evalua-
tion of spot urine biomarkers [9, 17]. However, because our study was a retrospective one, controlling the timing of random urine collection was not possible. Finally, of the 204 patients enrolled
in this study, 120 (58.8%) had undergone kidney transplant sur- gery, and another 32 (15.7%) had chronic kidney disease, and these kidney disorders are known to significantly affect sodium, potassium, and creatinine excretion levels in the urine. For this reason, the Na+/Cr and K+/Cr ratio results were significantly dif- ferent from nationally representative results reported by the Ko- rean National Health and Nutrition Examination Survey [18], which included only small fractionof patients with chronic kidney disease.
Our results show that significant correlations exist between the markers of daily sodium and potassium intake in random urine samples and those from 24 hr urine samples. However, further study is required to effectively utilize these random urine markers for clinical monitoring. Furthermore, the threshold salt levels required to prevent hypertension need to be determined in order to help patients effectively track their daily sodium and potassium intake. A simple and objective test could motivate patients to reduce their salt intake and increase their potassium Fig. 1. Correlations between 24 hr urine sodium or potassium excretion and random urine markers. Significant correlations exist between 24 hr urine sodium excretion and both the (A) Na+/Cr ratio (r=0.34, P <0.0001) and the (B) Na+/SGU ratio (r=0.19, P =0.007), as well as between 24-hr urine potassium excretion and both the (C) random urine K+/Cr ratio (r=0.47, P <0.0001) and the (D) random urine K+/ SGU ratio (r=0.28, P <0.0001).
Abbreviations: RU, random urine; Na+/Cr, sodium/creatinine ratio; K+/Cr, potassium/creatinine ratio; r, spearman’s rank correlation coefficient; SGU, specific gravity unit, SGU is calculated as “(specific gravity-1)×100”.
800 700 600 500 400 300 200 100 0
160 140 120 100 80 60 40 20 0
900 800 700 600 500 400 300 200 100 0
250 225 200 175 150 125 100 75 50 25 0 0 100 200 300 400 500 600
0 25 50 75 100 125 150 175 200 225 0 25 50 75 100 125 150 175 200 225
0 100 200 300 400 500 600 Na+/day (mmol/day)
K+/day (mmol/day)
Na+/day (mmol/day)
K+/day (mmol/day)
Na+/Cr, mmol/gCr (RU)Na+/Cr, mmol/gCr (RU) Na+/SGU (RU)Na+/SGU (RU)
A
C
B
D y=0.50x+33.47
r=0.34 P <0.0001
y=0.46x+22.38 r=0.47 P <0.0001
y=0.37x+41.10 r=0.19 P =0.007
y=0.48x+14.36 r=0.28 P <0.0001
Fig. 2. Correlation between the Na+/K+ ratios of 24 hr and random urine. Significant correlations exist between 24 hr urine and ran- dom urine Na+/K+ (r=0.47, P <0.0001).
16 14 12 10 8 6 4 2 0
0 2 4 6 8 10 12 14 16 18 20 Na+/K+ (24 hr)
Na+/K+ (RU)
y=0.478x+0.9926 r=0.47 P <0.0001
Koo H, et al.
Alternative markers for 24 hr urinary Na+ and K+
http://dx.doi.org/10.3343/alm.2015.35.2.238 www.annlabmed.org 241
intake. Therefore, daily sodium and potassium intake monitor- ing within random urine samples could help patients improve their dietary habits and decrease their blood pressure.
Authors’ Disclosures of Potential Conflicts of Interest
No potential conflicts of interest relevant to this article were re- ported.
REFERENCES
1. Ezzati M, Lopez AD, Rodgers A, Vander Hoorn S, Murray CJ;Comparative Risk Assessment Collaborating Group. Selected major risk factors and global and regional burden of disease. Lancet 2002;360:1347-60.
2. Adrogué HJ and Madias NE. Sodium and potassium in the pathogene- sis of hypertension. N Engl J Med 2007;356:1966-78.
3. Adrogué HJ and Madias NE. Sodium surfeit and potassium deficit: keys to the pathogenesis of hypertension. J Am Soc Hypertens 2014;8:203- 13.
4. Kawano Y, Tsuchihashi T, Matsuura H, Ando K, Fujita T, Ueshima H, et al. Report of the working group for dietary salt reduction of the Japanese society of hypertension: (2) Assessment of salt intake in the manage- ment of hypertension. Hypertens Res 2007;30:887-93.
5. Newman DJ, Pugia MJ, Lott JA, Wallace JF, Hiar AM. Urinary protein and albumin excretion corrected by creatinine and specific gravity. Clin Chim Acta 2000;294:139-55.
6. Kihara M, Fujikawa J, Ohtaka M, Mano M, Nara Y, Horie R, et al. Inter- relationships between blood pressure, sodium, potassium, serum cho- lesterol, and protein intake in Japanese. Hypertension 1984;6:736-42.
7. Dahl LK, Leitl G, Heine M. Influence of dietary potassium and sodium/
potassium molar ratios on the development of salt hypertension. J Exp
Med 1972;136:318-30.
8. Oliver WJ, Cohen EL, Neel JV. Blood pressure, sodium intake, and sodi- um related hormones in the Yanomamo Indians, a “no-salt” culture. Cir- culation 1975;52:146-51.
9. Mann SJ and Gerber LM. Estimation of 24-hour sodium excretion from spot urine samples. J Clin Hypertens (Greenwich) 2010;12:174-80.
10. Kwok TC, Chan TY, Woo J. Relationship of urinary sodium/potassium excretion and calcium intake to blood pressure and prevalence of hyper- tension among older Chinese vegetarians. Eur J Clin Nutr 2003;57:299- 304.
11. Woo J, Ho SC, Donnan S, Swaminathan R. Nutritional correlates of blood pressure in elderly Chinese. J Hum Hypertens 1988;1:287-91.
12. Woo J, Lau E, Chan A, Cockram C, Swaminathan R. Blood pressure and urinary cations in a Chinese population. J Hum Hypertens 1992;6:299- 304.
13. Bruce NG, Cook DG, Shaper AG, Ratcliffe JG. Casual urine concentra- tions of sodium, potassium, and creatine in population studies of blood pressure. J Hum Hypertens 1990;4:597-602.
14. Tanaka T, Okamura T, Miura K, Kadowaki T, Ueshima H, Nakagawa H, et al. A simple method to estimate populational 24-h urinary sodium and potassium excretion using a casual urine specimen. J Hum Hyper- tens 2002;16:97-103.
15. Jensen JS, Clausen P, Borch-Johnsen K, Jensen G, Feldt-Rasmussen B.
Detecting microalbuminuria by urinary albumin/creatinine concentra- tion ratio. Nephrol Dial Transplant 1997;12(S2):S6-9.
16. Kawasaki T, Ueno M, Uezono K, Kawano Y, Abe I, Kawazoe N, et al. The renin-angiotensin-aldosterone system and circadian rhythm of urine variables in normotensive and hypertensive subjects. Jpn Circ J 1984;
48:168-72.
17. Kawasaki T, Itoh K, Uezono K, Sasaki H. A simple method for estimating 24 h urinary sodium and potassium excretion from second morning void- ing urine specimen in adults. Clin Exp Pharmacol Physiol 1993;20:7-14.
18. Lee SG, Lee W, Kwon OH, Kim JH. Association of urinary sodium/creati- nine ratio and urinary sodium/specific gravity unit ratio with blood pres- sure and hypertension: KNHANES 2009-2010. Clin Chim Acta 2013;
424:168-73.