Statistical notes for clinical researchers:
Nonparametric statistical methods: 1. Nonparametric methods for comparing two groups
http://dx.doi.org/10.5395/rde.2014.39.3.235
Nonparametric statistical methods
Parametric statistical methods are implemented based on definite assumptions. For example, an independent t-test requires conditions of normal distributions for each group. The normality of the population distribution from which the sample data was originated may be assessed by examining graphs, by formal normality test such as the Shapiro-Wilk test or Kolmogorov-Smirnov test, or by assessment using skewness and kurtosis, as discussed in a previous session. When a substantial departure is found in data with continuous outcomes, we may consider transformation of data, e.g., by taking logarithms. If transformed data satisfy the assumptions, usual parametric methods, such as t-test, ANOVA, or linear regression may be applied. However if transformed data do not satisfy the assumptions, we need to choose nonparametric methods.
Nonparametric methods are called as ‘distribution-free tests’ because generally they don’t require any assumptions about underlying population distribution. Nonparametric methods may be applied when the data do not satisfy the distributional requirements of parametric methods. In nonparametric methods, ranks of observations are used instead of the measurements themselves, which may cause somewhat loss of information. While parametric methods estimate the key parameters of the distribution such as population means, nonparametric methods mainly test the pre-set hypothesis, e.g., whether two data differ or not. As the result, nonparametric methods usually don’t provide any useful parameter estimates.
Nonparametric methods may be applied on a wide range of data which is not suitable for the parametric analysis. Severely skewed continuous data or continuous data with definite outliers may be analyzed using nonparametric methods. Small-sized samples which don’t guarantee the exact normality need nonparametric methods. Also data with ordinal outcomes are often analyzed using nonparametric methods.
Advantages of nonparametric methods are as follows:
1) Wider range of data are applicable because of no or limited assumptions.
2) Useful in analyzing ordered data or categorical data Disadvantages of nonparametric methods are as follows:
1) Applying nonparametric methods on data satisfying assumptions of parametric methods may result in less power. However loss of power may be little or none for analysis of data which cannot satisfy the assumptions.
2) Tied values can be problematic and appropriate adjustment may be required.
3) Limited flexibility in generalizing to more complex analytic methods compared to
Hae-Young Kim
Department of Dental Laboratory Science and Engineering, College of Health Science & Department of Public Health Science, Graduate School, Korea University, Seoul, Korea
*Correspondence to Hae-Young Kim, DDS, PhD.
Associate Professor, Department of Dental Laboratory Science &
Engineering, Korea University College of Health Science, San 1 Jeongneung 3-dong, Seongbuk-gu, Seoul, Korea 136-703
TEL, +82-2-940-2845; FAX, +82-2-
Nonparametric methods for comparing two groups
Table 1 shows parametric methods and nonparametric methods for comparing independent two groups and correlated two groups. The Wincoxon rank-sum test (or the Mann-Whitney U test) is comparable to the independent t-test as the Wilcoxon signed-rank test is to the paired t-test.
Table 1. Parametric methods and nonparametric methods for comparing two or more groups
Comparison Parametric method
(normal distribution assumed) Nonparametric method (distribution-free method) Independent two groups Independent t-test Wilcoxon rank-sum test
(or Mann-Whitney U test)
Correlated two groups Paired t-test Wilcoxon signed-rank test
Independent three or more groups One-way ANOVA Kruskal-Wallis test
Correlated three or more groups Repeated measures one-way ANOVA Friedman test
1. Wilcoxon rank-sum test (or Mann-Whitney U test)
The Wilcoxon rank-sum test (or the Mann-Whitney U test) is applied to the comparison of two independent data whose measurements are at least ordinal. The null hypothesis is that two sets of scores are samples from the same population;
therefore they do not differ systematically. Steps of the test are as follows:
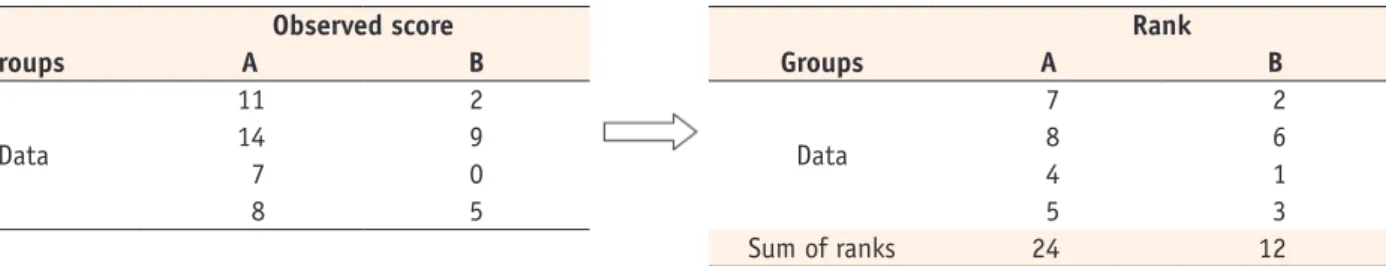
1st step: Transformation of observed scores into ranks
Observed score
Groups A B
Data
11 2
14 9
7 0
8 5
Rank
Groups A B
Data
7 2
8 6
4 1
5 3
Sum of ranks 24 12
2nd step: W (Difference from the rank sum of A group to the rank sum of B group) = 24 - 12 = 12 3rd step: Calculation of the probability of the observed case or more extreme cases
a) Number of all possible cases when 4 observations were selected from the set with 8 observations:
8! / (4! * 4!) = 70
b) Number of cases with larger difference of rank sum from A group to B group = 4 cases Rank combinations of A group with (5, 6, 7, 8), (4, 6, 7, 8), (3, 6, 7, 8), and (4, 5, 7, 8).
4th step: Calculation of probability
a) p value for one-sided test = 4 / 70 = 0.057
b) p value for two-sided test = 2 * (4 / 70) = 0.114 (exact p value)
If sample size is large (> 20), asymptotic p value (below e) is used for the statistical determination.
Kim HY
(a) data (b) Analyze - Nonparametric tests
- 2 Independent samples (c) Define test variable and grouping variable
(d) Sum of ranks (e) Wilcoxon W and p values
2. Wilcoxon signed-rank test
The Wilcoxon signed-rank test is applied to the comparison of two repeated or correlated data whose measurements are at least ordinal. The null hypothesis is that there is no difference in two paired scores. Steps of the test are as follows:
1st step: Compute difference scores between two paired values
2nd step: Assign ranks from the smallest absolute difference to the largest one
3rd step: Provide signs, + or –, according to the direction of the differences and compute sum of positive and negative ranks, respectively.
4th step: Set T = Smaller absolute value of positive or negative rank sum. T = 4 (negative rank sum)
Table 2. Procedures from 1st step to 3rd step of the Wilcoxon signed-rank test
No Before After Difference Ranks Positive Negative
1 36 21 15 11 11
2 23 24 -1 -1 1
3 48 36 12 10 10
4 54 30 24 12 12
5 40 32 8 7 7
6 32 35 -3 -3 3
7 50 43 7 6 6
8 44 40 4 4 4
9 36 30 6 5 5
10 29 27 2 2 2
11 33 22 11 9 9
12 45 36 9 8 8
Sum 74 4 (= T)
5th step: Wilcoxon signed rank test
a) Small sample size (N < 20): find the p value for T value and sample size n in the table for the Wilcoxon signed- rank test.
For this example, p value = 0.0017 for T = 4 when sample size = 12.
b) Larger ample size (N > 20): use z distribution approximation.
T - N(N - 1) 4 Z =
N(N + 1)(2N + 1) 24
Statistical decision: reject null hypothesis if |z| > 1.96 at the significance level α = 0.05. If the sample size was larger than 20, the asymptotic p value 0.006 (below e) could be used.
An example of calculating sum of positive and negative ranks is shown in the Table 2.
Kim HY
(a) data (b) Analyze - Nonparametric tests
- 2 Related samples (c) Define test pair list
(d) Mean ranks (positive, negative) (e) Z-value and p values