Change in Body Compositions of Asian Recipients after Kidney Transplantation
Kidney transplantation and accompanying medical conditions may result in changes in body composition. Such changes have been evaluated in Caucasian recipients, but not in Asian recipients. Herein, we conducted a study on Asian recipients because Asians have a different body composition from Caucasians. A total of 50 Asian recipients was enrolled as a prospective cohort. Using bioelectrical impedance analysis, body composition (muscle and fat mass) was assessed after 2 weeks (baseline), and at 1, 3, 6, 9, and 12 months following kidney transplantation. To find predictors related to changes, the data were analyzed by multivariate analysis using forward selection. All of the patients had good graft function during the study period. Patients gained approximately 3 kg within 1 yr of kidney transplantation. The proportion of muscle mass significantly decreased
(Ptrend= 0.001) and the proportion of fat mass significantly increased over time (Ptrend= 0.002). The multivariate results revealed that male recipients, deceased donor type, and low protein intake were associated with an increase in fat mass and a decrease in muscle mass. The results from this study may help to investigate differences in body composition changes between races, as well as the factors related to these changes.
Key Words: Asian; Body Composition; Fat; Kidney Transplantation; Muscle Seung Seok Han1, Jin Ho Hwang1,
Yoon Jung Oh1, Ran-hui Cha2, Curie Ahn1, and Yon Su Kim1,3
1Department of Internal Medicine, Seoul National University College of Medicine, Seoul; 2Department of Internal Medicine, National Medical Center, Seoul; 3Kidney Research Institute, Seoul National University, Seoul, Korea
Received: 1 May 2012 Accepted: 30 July 2012 Address for Correspondence:
Yon Su Kim, MD
Department of Internal Medicine, Seoul National University College of Medicine, 101 Daehak-ro, Jongno-gu, Seoul 110-744, Korea
Tel: +82.2-2072-2264, Fax: +82.2-745-2264 E-mail: [email protected]
This work was supported by a grant from the Korean Healthcare Technology R&D Project, Ministry for Health and Welfare, Republic of Korea (A084001).
http://dx.doi.org/10.3346/jkms.2012.27.10.1182 • J Korean Med Sci 2012; 27: 1182-1187 Nephrology
INTRODUCTION
Obesity is a medical condition in which excess body fat accu- mulates. This important condition has been linked to several comorbidities such as diabetes mellitus, cardiovascular disease, chronic kidney disease and a higher incidence of mortality (1-3).
Body mass index (BMI), which is defined as body weight (kg) divided by the square of body height (m), is used as a marker of obesity worldwide, and a BMI ≥ 30.0 kg/m2 is considered obese (4). Epidemiological studies have demonstrated that a high BMI, consistent with being either overweight or obese, is associated with an earlier death than a low BMI (5, 6). However, this rela- tionship is not evident in patients with chronic disease states, including chronic kidney disease and end-stage renal disease (7, 8). A high BMI appears to be correlated with a lower risk of mortality in these subjects in what is known as the ‘obesity par- adox’. A recent study on kidney transplant recipients also re- vealed no correlation between high BMI and low mortality (9).
A possible explanation for these conflicting findings is the lack of sensitivity of BMI. BMI does not differentiate muscle from fat tissue (10). Because a higher BMI could reflect a lack of malnutri- tion and a high proportion of muscle mass, it is not always asso- ciated with an increased death rate, especially in patients with
chronic disease. Therefore, in these subjects, body composition might be a factor of greater importance in relation to mortality.
Changes in body composition (fat and muscle mass) after kidney transplantation have been evaluated in some studies (11- 13). This issue is important because the change in body compo- sition in kidney recipients influences graft failure, as well as well- known adverse effects (13, 14). However, previous studies have dealt mainly with Caucasian recipients, not Asians. Asians have a different body composition for a given BMI from Caucasians (15). Accordingly, in the present study, we prospectively evalu- ated the change in body composition of Asian kidney transplant recipients and the factors related to the changes in muscle and fat mass.
MATERIALS AND METHODS Study population
Patients over 20 yr old were included. We excluded patients who had the following histories: multi-organ transplantation or a previous history of kidney transplantation, and taking drugs for diet problems such as anorexia nervosa and bulimia. Between September 2009 and August 2010, 52 patients were enrolled in this study. Because 2 patients were lost to follow-up, 50 patients
were included in the final analysis. All patients were of Asian origin. We recorded clinical parameters, including age at trans- plantation, sex, the cause of end-stage renal disease and the use of dialysis before transplantation. Donor factors, including age at transplantation, sex, and donor source (living relative, living non-relative, or deceased), were also evaluated.
All the tests were performed at 2 weeks, and 1, 3, 6, 9, and 12 months after kidney transplantation. Numerous serum mea- surements were included such as the concentrations of creati- nine, total cholesterol, triglycerides, high-density lipoprotein (HDL) cholesterol, low-density lipoprotein (LDL) cholesterol and C-reactive protein. The blood samples were taken in the fasting state. Body compositions, including muscle mass (kg) and fat mass (kg), were measured using bioelectrical impedance analysis (BIA, Inbody 720; Biospace company, Ltd., Seoul, Korea).
We also measured weight (kg), height (cm), and circumferences (cm) of the waist, hip, mid-arm and arm muscle. BMI was cal- culated as body weight (kg) divided by the square of body height (m). According to the guideline (16), patients were recommend- ed to intake 1.0-1.2 g/kg/d of protein and a suitable amount of calories at 2 weeks of transplantation. One month after kidney transplantation, patients kept a log of the food that they con- sumed for three days per week (2 weekdays and 1 weekend day).
Thereafter, we assessed mean daily total energy and protein in- take using a nutrient analysis program (CAN-Pro 3.0, Korean Nutrition Society, Seoul, Korea).
Steroids, calcineurin inhibitors (cyclosporine or tacrolimus), and inhibitors of purine synthesis (mycophenolate mofetil) were the baseline immunosuppressive agents used in the majority of patients. All the patients used steroids during the study period.
Either everolimus or mizoribine was also used instead of myco- phenolate mofetil in some patients. The dose regimen of the immunosuppressive agents was changed according to the pa- tient’s status. The cumulative steroid dose was calculated and converted to the dose of prednisone. Major complications, such as acute rejection, were evaluated by kidney biopsy. When acute cellular rejection developed, the patients were treated with in- travenous methylprednisolone pulse therapy.
Statistical analysis
All analyses and calculations were performed using SPSS soft- ware (SPSS version 16.0, Chicago, IL, USA). Data are presented as the mean ± standard deviation (SD) for continuous variables and as proportions for categorical variables. Baseline body com- position measurements were taken 2 weeks following transplan- tation to reduce the effect of excessive water accumulation after the operation. To identify the changes in parameters, repeated measure analysis of variance was used. The predictors related to these changes were detected using the mixed model method.
Then, multivariate analysis with forward selection was used to find the factor with the highest impact and to avoid multicol-
linearity between predictors. A P value of less than 0.05 was con- sidered significant.
Ethics statement
The institutional review board at the Seoul National University Hospital reviewed and approved this study (No. H-0906-037-283).
Informed consent was obtained from all study participants.
RESULTS
Baseline characteristics
Of the 50 recipients, 24 were male, and 26 were female (Table 1).
The mean ages of the recipients and donors were 47 and 42 yr, respectively. Before kidney transplantation, 43 subjects had re- ceived dialysis modalities. In 60% of the cases, the recipients re- ceived grafts from living donors. The causes of end-stage renal disease included diabetes mellitus (18%), glomerulonephritis (24%), and a number of other diseases (autosomal dominant polycystic kidney disease, 8%; reflux nephropathy, 2%; and other known causes, 4%). Forty-four per cent of the patients did not know the origin of their end-stage renal disease. During the fol- low-up period, acute rejection developed in 18 patients. None of the patients had graft failure.
Body compositions
The mean BMI of the patients was 21.8 kg/m2. BMIs less than 20.0 kg/m2 and higher than 25.0 kg/m2 were found in 15 and 6
Table 1. Baseline characteristics of recipients and donors
Parameters Total (n = 50)
Recipient age (yr) 46.9 ± 11.2
Recipient sex ratio (male:female) 24:26
Origin of end-stage renal disease Diabetic nephropathy (%)
Biopsy-proven primary glomerulonephritis (%) Unknown origin (%)
18.0 24.0 44.0 Dialysis before transplantation (HD:PD) 32:11
Donor age (yr) 42.1 ± 14.6
Donor sex ratio (male:female) 28:22
Living donor (%) 60.0
HLA mismatching 2.8 ± 1.9
Baseline immunosuppressant regimen Mycophenolate mofetil:others Tacrolimus:cyclosporine
43:7 39:11 Serum findings
Creatinine (mg/dL) Total cholesterol (mg/dL) Triglyceride (mg/dL) HDL cholesterol (mg/dL) LDL cholesterol (mg/dL) C-reactive protein (mg/dL)
1.08 ± 0.28 163.2 ± 31.3 122.1 ± 48.4 47.7 ± 11.9 91.5 ± 23.0 0.31 ± 0.65
Energy intake (kcal/kg/d) 33.6 ± 10.1
Protein intake (g/kg/d) 1.57 ± 0.51
Values are expressed as the mean (± standard deviation) or the percentage. HD, he- modialysis; PD, peritoneal dialysis; HLA, human leukocyte antigen; HDL, high-density lipoprotein; LDL, low-density lipoprotein.
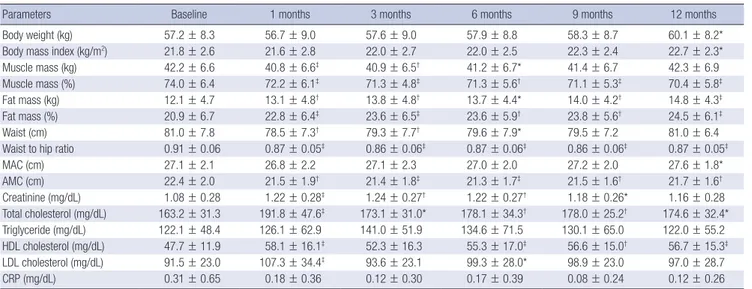
patients, respectively. The change in the body composition pa- rameter is shown in Table 2. Patients gained approximately 3 kg within 1 yr of kidney transplantation. Muscle mass decreased early after transplantation, and then the patients slowly regained muscle mass. Fat mass increased continuously after transplan- tation. Over time, the proportion of muscle mass significantly decreased (Ptrend= 0.001), and the proportion of fat mass signif- icantly increased over time (Ptrend= 0.002). The trend for muscle mass change was similar to the change in anthropometric pa- rameters such as arm and arm muscle circumferences. Howev- er, the trend for fat mass change was not similar to the change in waist circumference. Although patients had a reduction in waist circumference early after transplantation, the circumfer- ences increased over time to measurements similar to those at baseline.
Predictors of body composition change
We evaluated the factors related to the change in muscle and fat mass (Table 3). In univariate analysis, several factors such as the recipient’s age and sex were associated with body composi- tion change. In the forward selection step, the recipient’s sex had the highest impact of these factors (Fig. 1). During the study period, male recipients lost 4.0% of their muscle mass, and fe- male recipients lost 3.4% of their muscle mass. Conversely, male and female recipients gained 4.0% and 3.4% in fat mass, respec- tively. After multivariate analysis, the recipient’s sex, donor type, and the mean daily protein intake had a significant effect on body composition; male recipients, deceased donor type, and low protein intake were associated with an increase in fat mass and a decrease in muscle mass.
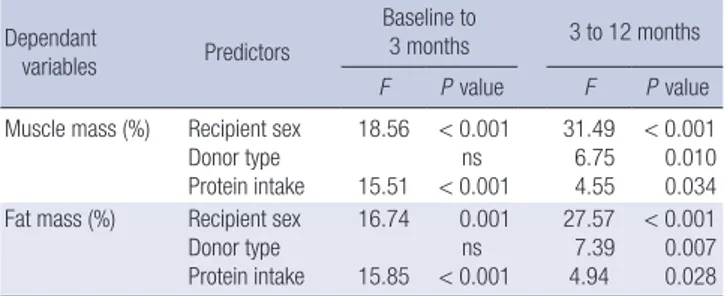
We further evaluated the predictors after stratifying the peri- od into two groups (baseline to 3 months and 3 to 12 months), because the changes of body composition seemed to be larger Table 2. Change of body composition and biochemical parameters over time after kidney transplantation
Parameters Baseline 1 months 3 months 6 months 9 months 12 months
Body weight (kg) 57.2 ± 8.3 56.7 ± 9.0 57.6 ± 9.0 57.9 ± 8.8 58.3 ± 8.7 60.1 ± 8.2*
Body mass index (kg/m2) 21.8 ± 2.6 21.6 ± 2.8 22.0 ± 2.7 22.0 ± 2.5 22.3 ± 2.4 22.7 ± 2.3*
Muscle mass (kg) 42.2 ± 6.6 40.8 ± 6.6‡ 40.9 ± 6.5† 41.2 ± 6.7* 41.4 ± 6.7 42.3 ± 6.9
Muscle mass (%) 74.0 ± 6.4 72.2 ± 6.1‡ 71.3 ± 4.8‡ 71.3 ± 5.6† 71.1 ± 5.3‡ 70.4 ± 5.8‡
Fat mass (kg) 12.1 ± 4.7 13.1 ± 4.8† 13.8 ± 4.8† 13.7 ± 4.4* 14.0 ± 4.2† 14.8 ± 4.3‡
Fat mass (%) 20.9 ± 6.7 22.8 ± 6.4‡ 23.6 ± 6.5‡ 23.6 ± 5.9† 23.8 ± 5.6† 24.5 ± 6.1‡
Waist (cm) 81.0 ± 7.8 78.5 ± 7.3† 79.3 ± 7.7† 79.6 ± 7.9* 79.5 ± 7.2 81.0 ± 6.4
Waist to hip ratio 0.91 ± 0.06 0.87 ± 0.05‡ 0.86 ± 0.06‡ 0.87 ± 0.06‡ 0.86 ± 0.06‡ 0.87 ± 0.05‡
MAC (cm) 27.1 ± 2.1 26.8 ± 2.2 27.1 ± 2.3 27.0 ± 2.0 27.2 ± 2.0 27.6 ± 1.8*
AMC (cm) 22.4 ± 2.0 21.5 ± 1.9† 21.4 ± 1.8‡ 21.3 ± 1.7‡ 21.5 ± 1.6† 21.7 ± 1.6†
Creatinine (mg/dL) 1.08 ± 0.28 1.22 ± 0.28‡ 1.24 ± 0.27† 1.22 ± 0.27† 1.18 ± 0.26* 1.16 ± 0.28
Total cholesterol (mg/dL) 163.2 ± 31.3 191.8 ± 47.6‡ 173.1 ± 31.0* 178.1 ± 34.3† 178.0 ± 25.2† 174.6 ± 32.4*
Triglyceride (mg/dL) 122.1 ± 48.4 126.1 ± 62.9 141.0 ± 51.9 134.6 ± 71.5 130.1 ± 65.0 122.0 ± 55.2
HDL cholesterol (mg/dL) 47.7 ± 11.9 58.1 ± 16.1‡ 52.3 ± 16.3 55.3 ± 17.0‡ 56.6 ± 15.0† 56.7 ± 15.3‡
LDL cholesterol (mg/dL) 91.5 ± 23.0 107.3 ± 34.4‡ 93.6 ± 23.1 99.3 ± 28.0* 98.9 ± 23.0 97.0 ± 28.7
CRP (mg/dL) 0.31 ± 0.65 0.18 ± 0.36 0.12 ± 0.30 0.17 ± 0.39 0.08 ± 0.24 0.12 ± 0.26
*P < 0.05, †P < 0.01, ‡P < 0.001 (versus baseline). MAC, mid-arm circumference; AMC, mid-arm muscle circumference; HDL, high-density lipoprotein; LDL, low-density lipo- protein; CRP, C-reactive protein.
Fig. 1. Changes in the proportion of muscle (A) and fat mass (B) according to sex. Symbols and error bars indicate the mean and standard deviation, respectively.
Muscle mass (%) Fat mass (%)
Time (months) Time (months)
0 1 3 6 9 12 0 1 3 6 9 12
85
80
75
70
65
60
35
30
25
20
15
10
A B
Female Female
Male Male
before 3 months than after 3 months. As Table 4 shows, recipi- ent’s sex and protein intake were independent predictors relat- ed to the changes in muscle and fat mass throughout the whole study period. However, deceased donor type was correlated with these changes only after 3 months, but not within 3 months.
DISCUSSION
The present study shows that recipients had a weight gain of approximately 3 kg within 1 yr of kidney transplantation. This change was primarily due to an increase in fat mass. Muscle mass decreased soon after transplantation, but patients regained muscle mass over time. The muscle change was similar to the change in anthropometric parameters, but the total fat change
differed from the trend for waist circumference. Of the patient characteristics, the recipient’s sex, donor type, and mean daily protein intake were the main predictors of changes in muscle and fat mass. The following points of the present study may be helpful to clinical practice. First, we assessed Asian kidney re- cipients, unlike previous studies, which have dealt mostly with Caucasian recipients. Second, we assessed the predictors relat- ed to changes in body composition by using appropriate ana- lytical methods.
Obesity is an important global issue. Therefore, the World Health Organization (WHO) grades obesity according to BMI:
underweight < 18.5 kg/m2, normal range 18.5-24.9 kg/m2, over- weight 25.0-29.9 kg/m2, and obese ≥ 30.0 kg/m2 (4). This sys- tem is convenient and reliable because a high BMI represents a high fat mass. However, BMI is a less useful measure in Asians and in chronic disease patients than in Caucasians and healthy subjects. Although Asian populations are not homogeneous, the body fat per given BMI differs between Asians and Cauca- sians (15). Accordingly, a different cut-off for BMI categories has been proposed for the Asian population (17). The phenom- enon of a high BMI being associated with a good survival out- come is another important issue. This association is often shown for patients with chronic diseases and in elderly subjects (6-8).
The main reason for unexpected associations with BMI in Asians and chronic disease patients is the lack of sensitivity of BMI.
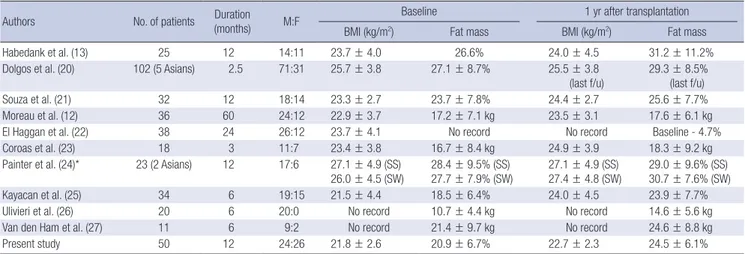
Transplant recipients are also in a chronic disease state rather than a generally healthy state (18). For these reasons, a direct measurement of body fat mass is more reliable in these subjects than is BMI. Previous studies have observed a change in body composition in kidney recipients, and this change affects the overall mortality rate of the recipients (9, 19). However, until now, there have been no studies on Asian kidney recipients. We have listed recently published studies on the change in body composition in kidney transplant recipients in Table 5. Most studies assessed Caucasian subjects and revealed that the pro- portion of fat mass increased by approximately 2% to 5% within 1 yr of kidney transplantation. The present study results are not largely different from the results of other studies.
We tried to detect which factor could best predict the change in body composition. In univariate analysis, several factors were Table 3. Univariate and multivariate mixed model results of different factors predict-
ing the change of body composition Dependant
variables Predictors Univariate Multivariate
F P value F P value
Muscle mass (%) Recipient age Recipient sex Origin of ESRD Dialysis before TPL Donor age Donor sex Donor type HLA mismatching Cumulative dose of Pd Use of MMF Use of tacrolimus Acute rejection Creatinine Total cholesterol Triglyceride HDL cholesterol LDL cholesterol C-reactive protein Energy intake Protein intake
3.32 99.88 2.39 1.88 3.54 7.97 3.99 0.15 1.57 2.88 1.82 1.14 9.18 0.10 0.73 1.17 3.14 0.23 60.02 58.59
0.070
< 0.001 0.069 0.154 0.061 0.005 0.047 0.700 0.211 0.091 0.178 0.287 0.003 0.756 0.393 0.280 0.078 0.635
< 0.001
< 0.001 46.71
5.63
13.03
< 0.001
0.018
< 0.001 Fat mass (%) Recipient age
Recipient sex Origin of ESRD Dialysis before TPL Donor age Donor sex Donor type HLA mismatching Cumulative dose of Pd Use of MMF Use of tacrolimus Acute rejection Creatinine Total cholesterol Triglyceride HDL cholesterol LDL cholesterol C-reactive protein Energy intake Protein intake
2.92 92.49 2.28 1.80 3.55 7.71 4.65 0.09 1.39 3.05 1.63 0.96 8.48 0.08 0.84 0.94 2.95 0.21 58.43 58.10
0.088
< 0.001 0.080 0.168 0.061 0.006 0.032 0.762 0.239 0.082 0.202 0.328 0.004 0.784 0.361 0.333 0.087 0.645
< 0.001
< 0.001 41.76
6.52
13.83
< 0.001
0.011
< 0.001 ESRD, end-stage renal disease; TPL, transplantation; HLA, human leukocyte antigen;
Pd, prednisone; MMF, mycophenolate mofetil; HDL, high-density lipoprotein; LDL, low-density lipoprotein.
Table 4. Results of multivariate analyses after stratifying the study period into two groups: baseline to 3 months and 3 to 12 months
Dependant
variables Predictors
Baseline to
3 months 3 to 12 months
F P value F P value
Muscle mass (%) Recipient sex Donor type Protein intake
18.56 15.51
< 0.001 ns
< 0.001
31.49 6.75 4.55
< 0.001 0.010 0.034 Fat mass (%) Recipient sex
Donor type Protein intake
16.74 15.85
0.001 ns
< 0.001
27.57 7.39 4.94
< 0.001 0.007 0.028 ns, not significant in univariate and multivariate analyses.
associated with the change in body composition. However, these factors may be correlated with each other (e.g., male subjects may have a tendency to consume a high calorie diet). There- fore, to avoid multicollinearity of the variables, we conducted multivariate analysis using forward selection. The results re- vealed the recipient’s sex as the most influential factor. Sex dif- ferences have also been documented in previous studies (11, 12, 21, 23, 28). However, the published trends were not identi- cal; some studies showed a high fat gain in female subjects (11, 28), whereas other studies showed the opposite (12, 21, 23).
Previous studies did not address possible multicollinearity of the variables, but groups of patients with different baseline char- acteristics may also contribute to the observed discrepancy.
Above all, it is well known that body fat accumulation and dis- tribution differ according to race (29, 30). The disadvantage of fat accumulation in Asian female recipients is an important is- sue in that an unhealthy body composition may lead to adverse transplant outcomes (31).
Even when differences due to sex were accounted for, donor type and protein intake remained significant predictors of body composition change. In the current study, deceased donor trans- plants had disadvantageous body compositions of high fat and low muscle compared with living donor transplants, particular- ly in the late posttransplant period. It is well known that living donor transplantation is associated with better graft and patient outcomes than deceased donor transplantation (32). This find- ing can be explained partly by a high inflammatory state in the deceased donor transplants compared with living donor trans- plants (33). The change in body composition in the present study was not related to C-reactive protein levels, which can indicate inflammatory stress. Therefore, the undesirable body composi- tion of deceased donors may be one of the causes of a worse outcome irrespective of inflammatory state. Nutritional advice is needed to maintain a healthy body composition (34), because kidney transplantation easily leads to a catabolic state. In the
present study, univariate analysis showed that both total caloric and protein intakes were important; however, in the multivari- ate analysis, protein intake was more attributable to the change in body composition than was total calorie intake. The effect of protein intake on body composition, especially on muscle mass, is well documented (35). However, a controlled intervention study is needed to address the clear relationship between pro- tein intake and body composition change.
High fat accumulation and sarcopenia are critically hazard- ous because they are associated with worse graft and patient survival (19, 31). Furthermore, visceral obesity has a greater im- pact on outcomes than does non-visceral fat distribution (9, 19).
Therefore, we examined the waist circumference and the waist to hip ratio for the index of visceral obesity. However, in the ear- ly phase of kidney transplantation, both the waist circumference and the waist to hip ratio did not increase but rather decreased significantly. The trend for visceral fat distribution may be dif- ferent in Caucasian recipients (20, 22). In view of this difference, the examination of the above indices is not sufficient to evalu- ate the body composition of Asian recipients within at least 1 yr of transplantation.
In summary, we are the first to address the body composi- tion change of Asian kidney recipients. Within 1 yr of transplan- tation, the trend for the body composition change was similar to that of Caucasian kidney recipients. Furthermore, we found that the recipient’s sex, donor type, and protein intake are pre- dictors of body composition change using appropriate statisti- cal methods. Some findings differed from the results of previ- ous studies, and these differences may be due to racial effects.
Because body composition is associated with transplant out- comes, the current findings may be helpful to clinical practice.
However, for clarity, large controlled studies with long-term fol- low up periods will be needed.
Table 5. Studies published after the year 2000 on the change in body composition in kidney transplant recipients
Authors No. of patients Duration
(months) M:F Baseline 1 yr after transplantation
BMI (kg/m2) Fat mass BMI (kg/m2) Fat mass
Habedank et al. (13) 25 12 14:11 23.7 ± 4.0 26.6% 24.0 ± 4.5 31.2 ± 11.2%
Dolgos et al. (20) 102 (5 Asians) 2.5 71:31 25.7 ± 3.8 27.1 ± 8.7% 25.5 ± 3.8
(last f/u) 29.3 ± 8.5%
(last f/u)
Souza et al. (21) 32 12 18:14 23.3 ± 2.7 23.7 ± 7.8% 24.4 ± 2.7 25.6 ± 7.7%
Moreau et al. (12) 36 60 24:12 22.9 ± 3.7 17.2 ± 7.1 kg 23.5 ± 3.1 17.6 ± 6.1 kg
El Haggan et al. (22) 38 24 26:12 23.7 ± 4.1 No record No record Baseline - 4.7%
Coroas et al. (23) 18 3 11:7 23.4 ± 3.8 16.7 ± 8.4 kg 24.9 ± 3.9 18.3 ± 9.2 kg
Painter et al. (24)* 23 (2 Asians) 12 17:6 27.1 ± 4.9 (SS) 26.0 ± 4.5 (SW)
28.4 ± 9.5% (SS) 27.7 ± 7.9% (SW)
27.1 ± 4.9 (SS) 27.4 ± 4.8 (SW)
29.0 ± 9.6% (SS) 30.7 ± 7.6% (SW)
Kayacan et al. (25) 34 6 19:15 21.5 ± 4.4 18.5 ± 6.4% 24.0 ± 4.5 23.9 ± 7.7%
Ulivieri et al. (26) 20 6 20:0 No record 10.7 ± 4.4 kg No record 14.6 ± 5.6 kg
Van den Ham et al. (27) 11 6 9:2 No record 21.4 ± 9.7 kg No record 24.6 ± 8.8 kg
Present study 50 12 24:26 21.8 ± 2.6 20.9 ± 6.7% 22.7 ± 2.3 24.5 ± 6.1%
*Baseline was tested at 3 months after transplantation. M, male; F, female; BMI, body mass index; f/u, follow-up; SS, standard use of steroid; SW, steroid withdrawal.
REFERENCES
1. Byers T. Body weight and mortality. N Engl J Med 1995; 333: 723-4.
2. Hsu CY, McCulloch CE, Iribarren C, Darbinian J, Go AS. Body mass in- dex and risk for end-stage renal disease. Ann Intern Med 2006; 144: 21-8.
3. Manson JE, Willett WC, Stampfer MJ, Colditz GA, Hunter DJ, Hankin- son SE, Hennekens CH, Speizer FE. Body weight and mortality among women. N Engl J Med 1995; 333: 677-85.
4. Obesity: preventing and managing the global epidemic. Report of a WHO consultation. World Health Organ Tech Rep Ser 2000; 894: i-xii, 1-253.
5. Calle EE, Thun MJ, Petrelli JM, Rodriguez C, Heath CW Jr. Body-mass index and mortality in a prospective cohort of U.S. adults. N Engl J Med 1999; 341: 1097-105.
6. Jee SH, Sull JW, Park J, Lee SY, Ohrr H, Guallar E, Samet JM. Body-mass index and mortality in Korean men and women. N Engl J Med 2006;
355: 779-87.
7. Kovesdy CP, Anderson JE, Kalantar-Zadeh K. Paradoxical association between body mass index and mortality in men with CKD not yet on di- alysis. Am J Kidney Dis 2007; 49: 581-91.
8. Leavey SF, McCullough K, Hecking E, Goodkin D, Port FK, Young EW.
Body mass index and mortality in ‘healthier’ as compared with ‘sicker’
haemodialysis patients: results from the Dialysis Outcomes and Practice Patterns Study (DOPPS). Nephrol Dial Transplant 2001; 16: 2386-94.
9. Kovesdy CP, Czira ME, Rudas A, Ujszaszi A, Rosivall L, Novak M, Kalan- tar-Zadeh K, Molnar MZ, Mucsi I. Body mass index, waist circumference and mortality in kidney transplant recipients. Am J Transplant 2010; 10:
2644-51.
10. Mafra D, Guebre-Egziabher F, Fouque D. Body mass index, muscle and fat in chronic kidney disease: questions about survival. Nephrol Dial Transplant 2008; 23: 2461-6.
11. El Haggan W, Vendrely B, Chauveau P, Barthe N, Castaing F, Berger F, de Precigout V, Potaux L, Aparicio M. Early evolution of nutritional sta- tus and body composition after kidney transplantation. Am J Kidney Dis 2002; 40: 629-37.
12. Moreau K, Chauveau P, Martin S, El-Haggan W, Barthe N, Merville P, Aparicio M. Long-term evolution of body composition after renal trans- plantation: 5-year survey. J Ren Nutr 2006; 16: 291-9.
13. Habedank D, Kung T, Karhausen T, von Haehling S, Doehner W, Sche- fold JC, Hasper D, Reinke S, Anker SD, Reinke P. Exercise capacity and body composition in living-donor renal transplant recipients over time.
Nephrol Dial Transplant 2009; 24: 3854-60.
14. Pirsch JD, Armbrust MJ, Knechtle SJ, D’Alessandro AM, Sollinger HW, Heisey DM, Belzer FO. Obesity as a risk factor following renal transplan- tation. Transplantation 1995; 59: 631-3.
15. Deurenberg P, Deurenberg-Yap M, Guricci S. Asians are different from Caucasians and from each other in their body mass index/body fat per cent relationship. Obes Rev 2002; 3: 141-6.
16. Wiggins KL. Guidelines for nutrition care of renal patients., 3rd ed. Chi- cago, IL: American Dietetic Association, 2002.
17. Weisell RC. Body mass index as an indicator of obesity. Asia Pac J Clin Nutr 2002; 11: S681-4.
18. Dimeny EM. Cardiovascular disease after renal transplantation. Kidney Int Suppl 2002; 78-84.
19. Streja E, Molnar MZ, Kovesdy CP, Bunnapradist S, Jing J, Nissenson AR, Mucsi I, Danovitch GM, Kalantar-Zadeh K. Associations of pretransplant
weight and muscle mass with mortality in renal transplant recipients.
Clin J Am Soc Nephrol 2011; 6: 1463-73.
20. Dolgos S, Hartmann A, Jenssen T, Isaksen GA, Pfeffer P, Bollerslev J.
Determinants of short-term changes in body composition following re- nal transplantation. Scand J Urol Nephrol 2009; 43: 76-83.
21. Souza GC, Costa C, Scalco R, Goncalves LF, Manfro RC. Serum leptin, insulin resistance, and body fat after renal transplantation. J Ren Nutr 2008; 18: 479-88.
22. El Haggan W, Hurault de Ligny B, Partiu A, Sabatier JP, Lobbedez T, Levaltier B, Ryckelynck JP. The evolution of weight and body composi- tion in renal transplant recipients: two-year longitudinal study. Trans- plant Proc 2006; 38: 3517-9.
23. Coroas A, Oliveira JG, Sampaio S, Borges C, Tavares I, Pestana M, Almeida MD. Nutritional status and body composition evolution in early post-re- nal transplantation: is there a female advantage? Transplant Proc 2005;
37: 2765-70.
24. Painter PL, Topp KS, Krasnoff JB, Adey D, Strasner A, Tomlanovich S, Stock P. Health-related fitness and quality of life following steroid with- drawal in renal transplant recipients. Kidney Int 2003; 63: 2309-16.
25. Kayacan SM, Yildiz A, Kazancioglu R, Sahin S, Sever MS, Ark E. The changes in serum leptin, body fat mass and insulin resistance after renal transplantation. Clin Transplant 2003; 17: 63-8.
26. Ulivieri FM, Piodi LP, Aroldi A, Cesana BM. Effect of kidney transplan- tation on bone mass and body composition in males. Transplantation 2002; 73: 612-5.
27. van den Ham EC, Kooman JP, Christiaans MH, Leunissen KM, van Hooff JP. Posttransplantation weight gain is predominantly due to an increase in body fat mass. Transplantation 2000; 70: 241-2.
28. Lopes I, Martin M, Errasti P, Martinez JA. Changes in the post-kidney transplantation body composition: different behavior between men and women. Nutr Hosp 1998; 13: 28-32.
29. Raji A, Seely EW, Arky RA, Simonson DC. Body fat distribution and in- sulin resistance in healthy Asian Indians and Caucasians. J Clin Endo- crinol Metab 2001; 86: 5366-71.
30. He Q, Horlick M, Thornton J, Wang J, Pierson RN Jr, Heshka S, Gallagher D. Sex and race differences in fat distribution among Asian, African- American, and Caucasian prepubertal children. J Clin Endocrinol Metab 2002; 87: 2164-70.
31. Hoogeveen EK, Aalten J, Rothman KJ, Roodnat JI, Mallat MJ, Borm G, Weimar W, Hoitsma AJ, de Fijter JW. Effect of obesity on the outcome of kidney transplantation: a 20-year follow-up. Transplantation 2011; 91:
869-74.
32. Terasaki PI, Cecka JM, Gjertson DW, Takemoto S. High survival rates of kidney transplants from spousal and living unrelated donors. N Engl J Med 1995; 333: 333-6.
33. Koo DD, Welsh KI, McLaren AJ, Roake JA, Morris PJ, Fuggle SV. Cadav- er versus living donor kidneys: impact of donor factors on antigen induc- tion before transplantation. Kidney Int 1999; 56: 1551-9.
34. Lopes IM, Martin M, Errasti P, Martinez JA. Benefits of a dietary inter- vention on weight loss, body composition, and lipid profile after renal transplantation. Nutrition 1999; 15: 7-10.
35. Krieger JW, Sitren HS, Daniels MJ, Langkamp-Henken B. Effects of vari- ation in protein and carbohydrate intake on body mass and composi- tion during energy restriction: a meta-regression 1. Am J Clin Nutr 2006;
83: 260-74.