INTRODUCTION
Uncoupling proteins (UCPs) are located within the inner mitochondrial membrane, and function as proton channels (1). Whereas mitochondria utilize energy derived from fuel combustion to create a proton electrochemical gradient across the mitochondrial inner membrane, UCPs uncouple proton gradient from ATP synthesis (2). The UCP family has been characterized in human, and most studies were conducted on three major members including UCP1 (MIM 113730), UCP2 (MIM 601693), and UCP3 (MIM 602044) (1). The expression and activation of UCPs is normally mediated by the sympathetic nervous system, and is controlled by nore- pinephrine. Due to their significant roles in energy meta- bolism, many association studies have been conducted regard- ing the associations of UCP polymorphisms with metabolic phenotypes, including metabolic rate, energy expenditure, exercise efficiency, body mass index (BMI) and diabetes (3- 7). Among UCP family members, UCP1 is expressed pri- marily in brown adipose tissue (BAT), and has been report- ed to be responsible for thermogenesis (2).
Recently, the results of some animal studies have provid- ed some clues regarding the relationship existing between respiratory uncoupling and blood pressure (8, 9). The uncou- pling agent, dinitrophenol, has been demonstrated to induce
smooth muscle contraction (10), a hallmark of blood pres- sure elevation. UCP1 is expressed primarily in brown adi- pose tissue, and periaotic brown adipose tissue is known to be present in both rodents and humans, in amounts sufficient to alter the temperature of the aortic blood (11, 12). Bernal- Mizrachi et al. demonstrated that UCP1 expression in the aortic smooth muscle cells of transgenic mice increased the generation of aortic superoxide, coupled with a 46 mmHg increase in tail cuff systolic blood pressure (SBP), and a 21 mmHg increase in diastolic blood pressure (DBP) (8). The relationship between UCP1 and blood pressure regulation was also suggested by the finding that blood pressure-regu- latory hormones also modulate the expression of UCP1. Kraus et al. reported that aldosterone, a mineralcorticoid hormone that regulates blood pressure, also modulated the expression of UCP1 in brown adipocytes (13). Porter et al. also deter- mined that angiotensin II, one of the principal regulators of blood pressure, increased UCP1 mRNA expression in brown adipose tissue (14).
Until now, however, the relationship of UCP1 with blood pressure in human is not clear. In this study, the effects of genetic polymorphisms of UCP1 on blood pressure were analyzed in a population consisting of 832 Korean female subjects.
776
Min Ho Cha, Byoung Kab Kang, Dongchul Suh*, Kil Soo Kim�, Young Yang�, and Yoosik Yoon* Department of Medical Research, Korea Institute of Oriental Medicine, Daejeon; Department of Microbiology*, College of Medicine, Chung-Ang University, Seoul; Kirin Medical Foundation�, Seoul;
Division of Biological Science�, Sookmyung Women’s University, Seoul, Korea
Address for correspondence Yoosik Yoon, Ph.D.
Department of Microbiology, College of Medicine, Chung-Ang University, 221 Dongjak-gu, Heukseok-dong, Seoul 156-756, Korea Tel : +82.2-820-5767, Fax : +82.2-823-5423 E-mail : [email protected]
DOI: 10.3346/jkms.2008.23.5.776
Association of UCP1 Genetic Polymorphisms with Blood Pressure among Korean Female Subjects
Recent studies have provided some clues with regard to the relationship existing between uncoupling protein 1 (UCP1) and blood pressure in animal experiments.
In an attempt to determine the genetic polymorphisms that are associated with blood pressure in humans, we have analyzed genetic polymorphisms in UCP1 gene. In this study, we assessed the association between UCP1 genotypes and systolic blood pressure (SBP) and diastolic blood pressure (DBP), in a population comprised of 832 Korean female subjects, using a general linear model, which was adjusted for age and body mass index (BMI). Among 4 genetic polymorphisms and the hap- lotypes constructed from them, haplotype3 of UCP1, UCP1-ht3[GAGA], evidenced significant associations with SBP (p=0.005) and DBP (p=0.013). However, this haplotype was not significantly associated with obesity phenotypes, including BMI or fat mass (p>0.05), thereby suggesting that its association with blood pressure was independent of obesity phenotypes.
Key Words : Mitochondrial Uncoupling Protein; Polymorphism, Genetic; Blood Pressure; Association
Received : 4 September 2007 Accepted : 19 January 2008
MATERIALS AND METHODS Subjects
The 832 female subjects who participated in this study were recruited from a women’s health and obesity clinic in the Kirin Medical Foundation (Seoul, Korea). Mean age and BMI were 27.9 yr and 25.9 kg/m2respectively. Female sub- jects over 50 yr old with high possibility of menopause were only 2.2% of the total subjects (n=18), and exclusion of them caused no significant effects on the results. Individuals who were taking anti-hypertensive, anti-hyperlipidemic or anti- diabetic medications were excluded from this study. Individ- uals with hypertension but were not taking medicines at the time of blood pressure measurement were included in the study, and then they were advised for appropriate medical care.
The general characteristics of the subjects are listed in Table 1. The SBP and DBP of each of the subjects were measured after at least 10 min of resting. Body fat mass was measured via bio-impedance analysis, using a commercial device (Inbody 2.0, Biospace Co., Seoul, Korea). Genomic DNA was obtained with the informed consent of all participants, and the proto-
cols of this study were approved by the Institutional Review Board. Genomic DNAs from each subject were extracted from whole blood, using the AccuprepTM Genomic DNA Extraction Kit (Bioneer Co., Daejeon, Korea), in accordance with the manufacturer’s instructions.
Genotyping
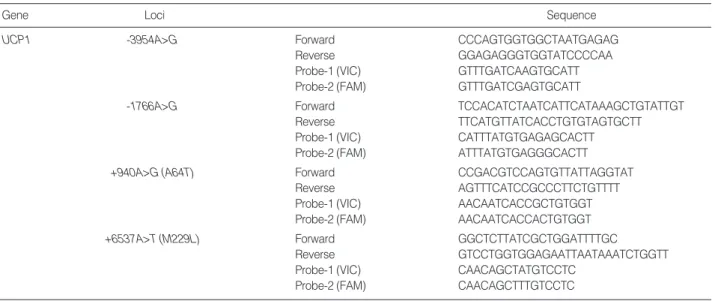
The genotyping of genetic polymorphisms was conduct- ed via the TaqMan method. Primer Express (Applied Biosys- tems, Foster City, CA, U.S.A.) was employed in the design of both the polymerase chain reaction (PCR) primers and the TaqMan probes. The relevant primer information was listed in Table 2. One allelic probe was labeled with FAM dye, and the other with VIC dye. PCRs were run in TaqMan Univer- sal Master Mix (Applied Biosystems) with PCR primer con- centrations of 900 nM and TaqMan probe concentrations of 200 nM. Reactions were conducted in a 384-well format, in a total reaction volume of 5 μL, using 20 ng of genomic DNA.
The plates then were positioned in a thermal cycler (PE 9700, Applied Biosystems) and heated for 2 min at 50℃and 10 min at 95℃, followed by 40 cycles of 95℃for 15 sec and 60℃ for 1 min. The assay mixtures were then transferred to a Prism 7900HT (Applied Biosystems), in which the fluorescence intensity in each well of the plate was determined.
Statistical analysis
Hardy-Weinberg equilibrium tests were utilized in order to determine whether or not individual genetic polymor- phisms were in equilibrium at each locus within the popu- lation. |D’| and r2were evaluated in order to measure link- age disequilibrium between all single nucleotide polymor- phism (SNP) loci (15), and haplotypes and their frequencies
Variables N Mean±SD
Age (yr) 832 27.88±7.80
Weight (kg) 832 66.86±11.74
BMI (kg/m2) 832 25.89±4.27
SBP 832 115.38±12.84
DBP 832 72.35±10.23
Table 1. General characteristics of study subjects
Gene Loci Sequence
UCP1 -3954A>G Forward CCCAGTGGTGGCTAATGAGAG
Reverse GGAGAGGGTGGTATCCCCAA
Probe-1 (VIC) GTTTGATCAAGTGCATT
Probe-2 (FAM) GTTTGATCGAGTGCATT
-1766A>G Forward TCCACATCTAATCATTCATAAAGCTGTATTGT
Reverse TTCATGTTATCACCTGTGTAGTGCTT
Probe-1 (VIC) CATTTATGTGAGAGCACTT
Probe-2 (FAM) ATTTATGTGAGGGCACTT
+940A>G (A64T) Forward CCGACGTCCAGTGTTATTAGGTAT
Reverse AGTTTCATCCGCCCTTCTGTTTT
Probe-1 (VIC) AACAATCACCGCTGTGGT
Probe-2 (FAM) AACAATCACCACTGTGGT
+6537A>T (M229L) Forward GGCTCTTATCGCTGGATTTTGC
Reverse GTCCTGGTGGAGAATTAATAAATCTGGTT
Probe-1 (VIC) CAACAGCTATGTCCTC
Probe-2 (FAM) CAACAGCTTTGTCCTC
Table 2. Amplifying primers and taqman probes for genotyping of UCP1 polymorphisms
UCP1, uncoupling protein 1.
BMI, body mass index; SBP, systolic blood pressure; DBP, diastolic blood pressure.
were inferred using the algorithm, HapAnalyzer (http://hap.
ngri.go.kr). Association analyses were performed using gen- eral linear model procedures, in which were included the effects of the UCP1 genetic polymorphism, age, and BMI.
Age and BMI-adjusted analysis of covariance (ANCOVA) was conducted in order to assess the independent effects of the UCP1 polymorphisms on blood pressure. Statistical sig- nificance was established at a level of p<0.05. All analyses were conducted using the SAS system for windows, version 8.2 (SAS Korea, Seoul, Korea).
RESULTS
In this study, genetic polymorphisms in UCP1 gene were evaluated with regard to their association with blood pres- sure in a population composed of 832 Korean women. Sixty five male subjects were also recruited, and their numbers were not enough for parametric statistical analyses. Because the number of male subjects was less than 8% of the num- ber of female subjects, the statistical analyses were confined to female subjects for the controlling of the sex-related phys-
iological factors. Inclusion of male subjects in statistical anal- yses showed similar results (data not shown).
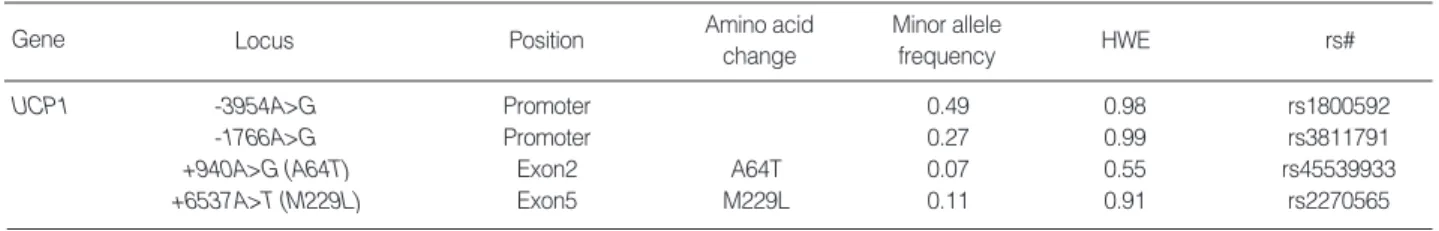
Among the 37 UCP1 polymorphisms listed in the NCBI database (http://www.ncbi.nlm.nih.gov/projects/SNP/), four SNP found in promoter and exon regions were selected for genotyping of all 832 subjects. The gene map of UCP1 and locations of the selected SNPs are shown in Fig. 1A, and char- acteristics of them were summarized in Table 3. The geno- typic distributions of four selected SNPs were all determined to be in Hardy-Weinberg equilibrium (HWE) (p>0.05). As shown in Fig. 1B, four common haplotypes with frequencies more than 0.05 were constructed from four selected SNPs of UCP1. Among them, UCP1-ht1[AAGA]was tagged by -3954A>G with a frequency in excess of 95%. Likewise, UCP1-ht2[GGGA] and UCP1-ht4[GAAT] were tagged almost completely by -1766A>G and +6537A>T, respec- tively. These tagged haplotypes were not analyzed further, as their effects were almost identical to their tagging SNPs.
Four SNPs and UCP1-ht3[GAGA]haplotype were further analyzed with regard to their association with SBP and DBP after adjusting for age and BMI in the 832 Korean female subjects. UCP1-ht3 evidenced a significant association with
Ex1+1 Ex2
Map of UCP1 on chromosome 4q28-q31
Haplotypes of UCP1 -3954A>G
(0.49) -1766A>G
(0.27)
+940A>G (A64T) (0.07)
+6537A>T (M229L) (0.11)
Ex3,4 Ex5 Ex6 A
B
Hap. Freq.
-3954A>G -1766A>G+940A>G (A64T)
+6537A>T (M 229L)
htl A A G A 0.480
ht2 G G G A 0.242
ht3 G A G A 0.166
ht4 G A A T 0.065
Other(1) - - - - 0.047
Linkage among UCP1 polymorphisms
C
r2 +6537A>T
(M229L) +940A>G
(A64T) -1766A>G -3954A>G
lD’l
-3954A>G - 0.91 0.66 0.74
-1766A>G 0.3 - 0.93 0.57
+940A>G (A64T) 0.03 0.02 - 1
+6537A>T (M229L) 0.06 0.01 0.72 -
Fig. 1. Genetic polymorphisms of the UCP1. (A) Gene map of UCP1 on chromosome 4q28-q31 (Ref. Genome Seq. NT_016354). Coding exons are marked by black blocks and 5’ UTRs are marked by white blocks. (B) Common haplotypes constructed from four SNPs. (C) Linkage disequilibrium coefficients among four SNPs.
Gene Locus Position Amino acid HWE rs#
change
Minor allele frequency
UCP1 -3954A>G Promoter 0.49 0.98 rs1800592
-1766A>G Promoter 0.27 0.99 rs3811791
+940A>G (A64T) Exon2 A64T 0.07 0.55 rs45539933
+6537A>T (M229L) Exon5 M229L 0.11 0.91 rs2270565
Table 3. Characteristic of polymorphisms used for genotyping of the whole subjects
HWE, Hardy-weinberg equilibrium; UCP1, uncoupling protein 1.
SBP (Table 4). The SBP distributions were as follows: 114.63
±0.50 mmHg (n=553) among UCP1-ht3 non-carriers;
117.36±0.75 mmHg (n=248) among heterozygotes; and 112.98±2.11 mmHg (n=31) among homozygote (p=0.005 in codominant model). Similar associations were determined to exist between UCP1-ht3 and DBP. The DBP distributions were as follows: 71.84±0.42 mmHg among UCP1-ht3 non- carriers; 73.80±0.62 mmHg among heterozygotes; and 69.98±1.77 mmHg among homozygote (p=0.013 in the codominant model) (Table 5). As five independent statisti- cal tests were conducted in Table 4, the significance level is 0.05/5=0.01 after Bonferroni correction, which is the most conservative method of multiple comparison correction (16).
The results showed that the association of UCP1-ht3 with SBP is highly significant: significant even after multiple com- parison correction (p<0.01).
As blood pressure was closely associated with obesity phe- notypes, the observed associations between UCP1-ht3 and blood pressure might have been mediated by its effects on obesity phenotypes, in spite of the fact that BMI had been adjusted for in the statistical analyses. In order to ascertain this, the BMI and body fat mass of all subjects were com- pared with regard to UCP1-ht3 (Table 6). Our findings indi- cated that UCP1-ht3 had no statistically significant effect on either BMI or fat mass among the subjects. This suggests that the association of the UCP1-ht3 with blood pressure may be independent on its effects on obesity phenotypes.
DISCUSSION
The association pattern of UCP1-ht3 with blood pressure
Gene Locus C/C C/R R/R
p
Co-dominant Dominant Recessive UCP1 -3954A>G 216 (71.55±0.67 ) 407 (73.25±0.49) 209 (71.40±0.68) 0.035 0.169 0.113
-1766A>G 458 (72.51±0.46) 308 (72.25±0.56) 63 (71.97±1.25) 0.885 0.654 0.733 +940A>G (A64T) 707 (72.43±0.37) 111 (71.42±0.94) 5 (70.84±4.41) 0.576 0.742 0.297 +6537A>T (M229L) 674 (72.59±0.38) 149 (71.59±0.81) 8 (69.75±3.50) 0.398 0.208 0.448 UCP1-ht3 553 (71.84±0.42) 248 (73.80±0.62) 31 (69.98±1.77) 0.013 0.033 0.173 Table 5. Analyses of covariance of UCP polymorphisms with DBP controlling for age and BMI among Korean female subjects
C/C, C/R, and R/R represent homozygotes for the common allele, and heterozygotes and homozygotes for the rare allele, respectively. Genotype and hap- lotype distributions (mean±SE), and p values of three alternative models (co-dominant, dominant, and recessive) of analysis of covariance (ANCOVA) are shown. p values less than 0.05 were marked by bold fonts.
UCP1, uncoupling protein; SBP, systolic blood pressure; BMI, body mass index.
Gene Locus C/C C/R R/R
p
Co-dominant Dominant Recessive UCP1 -3954A>G 216 (113.97±0.80) 406 (116.08±0.59) 209 (115.48±0.82) 0.058 0.042 0.883
-1766A>G 458 (115.27±0.56) 307 (115.73±0.68) 63 (114.77±1.49) 0.794 0.727 0.660 +940A>G (A64T) 706 (115.34±0.45) 111 (115.20±1.13) 5 (113.56±5.31) 0.940 0.740 0.856 +6537A>T (M229L) 673 (115.47±0.46) 149 (115.33±0.97) 8 (112.29±4.19) 0.749 0.773 0.454 UCP1-ht3 553 (114.63±0.50) 248 (117.36±0.75) 31 (112.98±2.11) 0.005 0.010 0.249 Table 4. Analyses of covariance of UCP1 polymorphisms with SBP controlling for age and BMI among Korean female subjects
C/C, C/R, and R/R represent homozygotes for the common allele, and heterozygotes and homozygotes for the rare allele, respectively. Genotype and hap- lotype distributions (mean±SE), and p values of three alternative models (co-dominant, dominant, and recessive) of analysis of covariance (ANCOVA) are shown. p values less than 0.05 were marked by bold fonts.
UCP1, uncoupling protein; SBP, systolic blood pressure; BMI, body mass index.
Gene Phenotype C/C C/R R/R
p
Co-dominant Dominant Recessive UCP1-ht3 BMI (kg/m2) 553 (26.04±0.17) 248 (25.64±0.24) 31 (25.16±0.77) 0.242 0.129 0.263
Fat mass (kg) 553 (23.72±0.33) 248 (22.87±0.45) 31 (22.24±1.47) 0.224 0.095 0.374 Table 6. Analyses of covariance of UCP1-ht3 with obesity phenotypes controlling for age among Korean female subjects
C/C, C/R, and R/R represent homozygotes for the common allele, and heterozygotes and homozygotes for the rare allele, respectively. Haplotype distribu- tions (mean±SE), and p values of three alternative models (co-dominant, dominant, and recessive) of analysis of covariance (ANCOVA) are shown.
BMI, body mass index; UCP1, uncoupling protein 1.
can not be explained by classical mendelian inheritance, because heterozyote showed higher blood pressure than UCP1-ht3 homozygote. Another form of inheritance was suggested which is neither dominant nor recessive and in which only heterozygote is affected (17). In this situation, homozygosity for the normal allele and the mutant allele give a normal phenotype. Only heterozygote produces an abnormal phenotype because the two alleles, when present together, interact to produce a harmful effect. Pedigree stud- ies provided possible evidences for the harmful interaction of two alleles in human diseases (18). UCP1 polymorphism study conducted on Japanese males suggested similar two allele interaction. It was reported that AG heterozygote of the A-3826G polymorphism of UCP1 has higher risk than AA and GG homozygote suggesting a harmful interaction of two alleles in UCP1 heterozygote (19). Even though more study should be conducted to get clear evidence of the two allele interaction, our results suggest that heterozygosity of UCP1-ht3 haplotype was associated with elevated blood pres- sure in Korea female subjects.
The findings of this study should be interpreted within the context of its limitations. The subjects of this study were young females, and our findings might not be appropriate for extrapolation to general population. However, the sig- nificant associations observed in this study provide some evidence of the involvement of UCP1 in the blood pressure of human.
ACKNOWLEDGMENTS
This research was supported by a grant from the Ministry of Science and Technology of Korea (M1052701000005N- 270100000) and a grant from Biogreen 21 project (20070- 301034031) of Rural Development Administration of Korea.
REFERENCES
1. Boss O, Muzzin P, Giacobino JP. The uncoupling proteins: a review.
Eur J Endocrinol 1998; 139: 1-9.
2. Boss O, Hagen T, Lowell BB. Uncoupling proteins 2 and: potential regulators of mitochondrial energy metabolism. Diabetes 2000; 49:
143-56.
3. Le Fur S, Le Stunff C, Dos Santos C, Bougneres P. The common -866 G/A polymorphism in the promoter of uncoupling protein 2 is asso- ciated with increased carbohydrate and decreased lipid oxidation in juvenile obesity. Diabetes 2004; 53: 235-9.
4. Esterbauer H, Schneitler C, Oberkofler H, Ebenbichler C, Paulwe- ber B, Sandhofer F, Ladurner G, Hell E, Strosberg AD, Patsch JR, Krempler F, Patsch W. A common polymorphism in the promoter of UCP2 is associated with decreased risk of obesity in middle-aged
humans. Nat Genet 2001; 28: 178-83.
5. Walder K, Norman RA, Hanson RL, Schrauwen P, Neverova M, Jenkinson CP, Easlick J, Warden CH, Pecqueur C, Raimbault S, Ricquier D, Silver MH, Shuldiner AR, Solanes G, Lowell BB, Chung WK, Leibel RL, Pratley R, Ravussin E. Association between uncou- pling protein polymorphisms (UCP2-UCP3) and energy metabolism/
obesity in Pima indians. Hum Mol Genet 1998; 7: 1431-5.
6. Lanouette CM, Giacobino JP, Perusse L, Lacaille M, Yvon C, Chag- non M, Kuhne F, Bouchard C, Muzzin P, Chagnon YC. Association between uncoupling protein 3 gene and obesity-related phenotypes in the Quebec Family Study. Mol Med 2001; 7: 433-41.
7. Wang H, Chu WS, Lu T, Hasstedt SJ, Kern PA, Elbein SC. Uncou- pling protein-2 polymorphisms in type 2 diabetes, obesity, and insulin secretion. Am J Physiol Endocrinol Metab 2004; 286: E1-7.
8. Bernal-Mizrachi C, Gates AC, Weng S, Imamura T, Knutsen RH, DeSantis P, Coleman T, Townsend RR, Muglia LJ, Semenkovich CF. Vascular respiratory uncoupling increases blood pressure and atherosclerosis. Nature 2005; 435: 502-6.
9. Bernal-Mizrachi C, Weng S, Li B, Nolte LA, Feng C, Coleman T, Holloszy JO, Semenkovich CF. Respiratory uncoupling lowers blood pressure through a leptin-dependent mechanism in genetically obese mice. Arterioscler Thromb Vasc Biol 2002; 22: 961-8.
10. Pettersson G. Effect of dinitrophenol and anoxia on isometric tension in rabbit colon smooth muscle. Acta Pharmacol Toxicol (Copenh) 1985; 57: 184-9.
11. Szekely M, Kellermayer M, Cholnoky G, Sumegi I. Thermoregula- tory heat production by periaortic brown adipose tissue in the non- cold-acclimatized rat. Experientia 1970; 26: 1314-5.
12. Heaton JM. The distribution of brown adipose tissue in the human.
J Anat 1972; 112: 35-9.
13. Kraus D, Jager J, Meier B, Fasshauer M, Klein J. Aldosterone inhibits uncoupling protien-1, induces insulin resistance, and stimulates proinflammatory adipokines in adipocytes. Horm Metab Res 2005;
37: 455-9.
14. Porter JP, Anderson JM, Robinson RJ, Phillips AC. Effect of central angiotensin II on body weight gain in young rats. Brain Res 2003;
959: 20-8.
15. Adams SH. Uncoupling protein homologs: emerging views of phys- iological function. J Nutr 2000; 130: 711-4.
16. Bland JM, Altman DG. Multiple significance tests: the Bonferroni method. BMJ 1995; 310: 170.
17. Johnson WG. Metabolic interference and the +- heterozygote. a hypothetical form of simple inheritance which is neither dominant nor recessive. Am J Hum Genet 1980; 32: 374-86.
18. Rollnick B, Day D, Tissot R, Kaye C. A pedigree: possible evidence for the metabolic interference hypothesis. Am J Hum Genet 1981;
33: 823-6.
19. Nakano T, Shinka T, Sei M, Sato Y, Umeno M, Sakamoto K, Nomu- ra I, Nakahori Y. A/G heterozygote of the A-3826G polymorphism in the UCP-1 gene has higher BMI than A/A and G/G homozygote in young Japanese males. J Med Invest 2006; 53: 218-22.