JESK
Express Train Seat Discomfort Evaluation using Body Pressure and Anthropometric Data
Se Jin Park1, Seung Nam Min2, Heeran Lee1, Murali Subramaniyam2, Woo Sung Suh3
1Korea Research Institute of Standards and Science; Division of Convergence Technology, Daejeon, 305-340
2Korea Research Institute of Standards and Science; Center for Medical Metrology, Division of Convergence Technology, Daejeon, 305-340
3DAEWON KANG UP CO., LTD, Design 1 Team of Seat Research & Development Center, Cheonan-si, 331-804
Corresponding Author Murali Subramaniyam
Korea Research Institute of Standards and Science, Center for Medical Metrology, Division of Convergence Technology, Daejeon, 305-340
Phone : +82-42-868-5646
Email : [email protected]
Received : February 12, 2014 Revised : June 10, 2014 Accepted : June 12, 2014
Objective: The purpose of this study was to evaluate Korea's Honam express train's first- and second-class seat discomfort by using pressure measurement, subjective discomfort rating, and physical compatibility.
Background: Over the years, the demand for an express train service is continually increasing. A comfortable ride is important to achieving passenger satisfaction. A train seat plays a significant role in fulfilling passenger seating comfort. With this in view, a field survey and pressure measurements were performed on the selected train seat.
Method: The pressure ratio at the body-seat interface (thigh and buttock regions) was measured by the pressure mat system. The interface pressure ratio was calculated and compared. The subjective discomfort rating scale was used to evaluate the subjects' overall feeling. The dimensions of train seats were analysed according to the anthropometric and demographic characteristics of the population data from Size Korea.
Results: The results highlighted that the interface pressure ratio was greater while participants sat on the second-class seat than the first-class seat in the left- and right-side thigh regions. Also the pressure ratio was greater for the participants in the 1st~25th percentile height groups (149.8~160.8cm). The subjects rated higher discomfort for the second-class seat than the first-class seat. The physical compatibility results showed that the second-class seat’s breadth was inadequate for the 95th and 99th percentile male.
Conclusion: Overall, interface pressure measurement, subjective discomfort score and physical compatibility results showed that the second-class seat was more uncomfortable for the passengers than the first-class seat.
Application: The adopted methodologies could be used to measure the seating comfort of the train seats.
Keywords: Train seat, Discomfort evaluation, Physical compatibility, Interface pressure Copyright@2014 by Ergonomics Society
of Korea. All right reserved.
○cc This is an open-access article distributed under the terms of the Creative Commons Attribution Non-Commercial License (http://
creativecommons.org/licenses/by-nc/3.0/), which permits unrestricted non-commercial use, distribution, and reproduction in any medium, provided the original work is properly cited.
1. Introduction
In April 2004, Korea has launched the next generation express train services and stepped into the era of high-speed railroad countries. Many countries have developed high-speed rail to connect their major cities, including Japan, Germany, China, France,
Spain and South Korea. The maximum commercial speed on most high-speed rail lines was about 300km/h. The era of the express train will bring a great transformation to people's lives by connecting them to anywhere in the whole of South Korea within two hours through high speed. With the continuously increasing number of express train users in South Korea, it is essential to study the seating comfort.
Along with subjective evaluation methods, there are several objective methods (e.g., posture analysis, pressure measurement, and electromyography) in use to evaluate seating comfort or discomfort. Seating comfort is strongly related to the physical comfort of an occupant. There are three factors associated with seating comfort: static, transient and dynamic comfort (Ebe and Griffin, 2000; Kolich, 2008). Comfort is experienced during a dynamic process rather than static. Dynamic comfort is mainly assessed through vibration measurement; there have been numerous studies (Code, 1995; Park et al., 1997, 1998, 2001, 2013; Kim et al., 2001; Nahvi et al., 2006; Hacaambwa and Giacomin, 2007), and standards (ISO 2631, BS 6841) exist regarding the vibration behaviour of a vehicle seat on its occupants. Discomfort can be static as long as the bodily balance is not assumed. Static comfort can be evaluated using many ergonomic techniques, including subjective assessment, postural assessment and interface pressure measurement.
The train seat can be evaluated by its relation to the body, its emblematic or communicative function and its design. The interface pressure between occupants and a seat can cause discomfort while sitting. Pressure distribution measurement of the seat-to- occupant interface is a primary tool for seating comfort evaluation (Dhingra et al., 2003; Kyung and Nussbaum, 2008). When designing for comfort, with regard to interface pressure distribution, there are two factors, average and concentrated pressure, applied. The average pressure is evenly distributed on the seat surface and concentrated pressure occurs more on rigid parts of the body, namely the ischial tuberosities (Seigler, 2002). The interface pressure measurement has generated considerable interest for predicting seat discomfort. Studies reported (Park et al., 1997; Wu et al., 1998; Dhingra et al., 2003; Dunk and Callaghan, 2005;
Kyung and Nussbaum, 2008) that the interface pressure measurement is an important factor to objectively evaluate seat comfort.
The main specification in seat design includes reducing the pressure magnitude and uniformly distributing pressure. Wu et al.
(1998) compared the interface pressure distribution characteristics between soft and rigid seats and reported that pressure was distributed more evenly throughout the contact area on the soft seat. The pressure tolerance varies from person to person.
Nevertheless, the threshold value of 32mmHg has been used in several studies (Stinson et al., 2003; Eitzen, 2004). Any load greater than the threshold value (32mmHg) is considered to be harmful because it exceeds the capillary pressure in the blood vessels.
Shen and Galer (1993) attempted to build a multifactor model of sitting discomfort using the interface pressure measurement.
Also, several other studies (Park et al., 1997; Mehta and Tewari, 2000; Na et al., 2005; Kyung and Nussbaum, 2008) were conducted to relate seat discomfort to interface pressure. The published studies on interface pressure measurement in sitting discomfort evaluation mostly focused on automobile seats, including cars, tractors, and trucks. However, studies on train seat sitting discomfort with pressure measurements are lacking.
The principle that the seat should accommodate the occupant is the most universally employed concept in seating ergonomics.
Seat dimension or size is one of the foremost basic and necessary factors when determining fit for the occupant (Ziolek and Wawrow, 2004). A commonly used design criterion is that the seat should accommodate the members of the population who lie between the 5th-percentile-female and 95th-percentile-male values on some anthropometric measures of interest. And also it is important to highlight the dimension that is accommodated. Therefore, anthropometric dimensions are an important factor for evaluating seat design criteria. With this in view, train seat design criteria, especially the dimensions of train seats, were analysed according to the anthropometric and demographic characteristics of the population data from Size Korea. This study evaluated first- and second-class express train seat discomfort by using subjective and objective methods. The subjective feeling of comfort or discomfort of the selected train seat was assessed. Also the objective pressure measurement at the body-seat interface (thigh and buttock region) was measured and compared.
2. Method
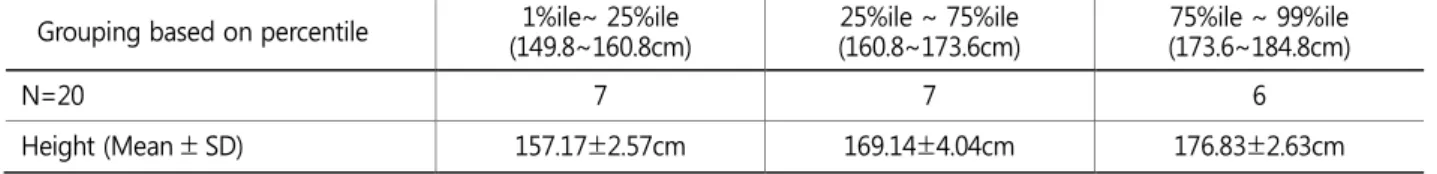
2.1 SubjectThe subjects considered were 20 individuals (10 men and 10 women) with sound health and who claimed to have no history of back pain. The subjects considered in this study were right-hand and right-foot dominant and they are grouped as a percentile (based on height) in Table 1.
2.2 Equipment
The first- and second-class seats used in this study were produced in Korea. The objective body pressure measurement (interface pressure) was performed by using a pressure mat system (maximum no. of sensing elements: 3,000 numbers; sensor size on one cell: 20 x 20mm; maximum size of sensing area: 64 x 2,000cm; actual size of the mat: 66 x 2,002 x 0.3cm) produced in Korea (Figure 1). The sensing was done with a film sensor.
2.3 Design
In this study, a 3 x 2 mixed-factor design was used with the following independent variables: height range (149.8~160.8cm, 160.8~173.6cm and 173.6~184.8cm) and type of train seat (first class and second class). Dependent variables consisted of subjective body discomfort and objective measures of interface pressure ratio.
Table 1. Mean (SD) demographic information of participants for height grouping from Size Korea Grouping based on percentile 1%ile~ 25%ile
(149.8~160.8cm)
25%ile ~ 75%ile (160.8~173.6cm)
75%ile ~ 99%ile (173.6~184.8cm)
N=20 7 7 6
Height (Mean ± SD) 157.17±2.57cm 169.14±4.04cm 176.83±2.63cm
2.4 Procedures
At the beginning of the experiment, the purpose and procedure of the experiment were explained to the subjects. Subjects wore comfortable pyjamas for the experiment. The pressure mat was placed on the chair. The subject was requested to sit on the seat carefully, being careful not to wrinkle or disrupt the placing of the pressure mat. The subject was asked to maintain a comfortable posture, with their hands on their laps and their feet flat on the floor. The backrest inclination angle was fixed throughout the experiment and without using a footplate. Backrest contact was required, therefore subjects were asked to ensure their upper back was in contact with the seat backrest, but not the head. The subject was seated for 10min to allow the foam of the seat pan to compress due to the weight of the subject (Vos et al., 2006) as shown in Figure 2. Then the interface pressure was recorded using the pressure mat system. After completion of the seated task, the subjective comfort rating was assessed by the subjects.
The objective body pressure measurements were also performed when subjects were seated on the train seat. A similar procedure was adopted for both seats. To avoid fatigue, a 5 min interval was given between each condition.
2.5 Analysis
2.5.1 Pressure ratio
A static test was carried out to measure the buttock-seat pressure ratio. The body pressure ratio in the seat pan region was measured by using a pressure mat system. The interface pressure was divided into four quarters: the right thigh, left thigh, right buttock, and left buttock, as shown in Figure 3. The body pressure ratio was calculated with Eq. 1 for the buttock and thigh regions.
2.5.2 Subjective discomfort
The subjective discomfort questionnaire consisted of subjects' demographic information and subjective discomfort rating of the train seats (Table 2). The seven-point discomfort rating scale was used to evaluate the overall discomfort with descriptor (1. Very comfortable; 2. Moderately comfortable; 3. Fairly comfortable; 4. A little comfortable; 5. Slightly uncomfortable; 6. Moderately uncomfortable; 7. Very uncomfortable).
Pressure ratio = pressureareai
(1) pressureTotal area
2.5.3 Physical compatibility
Physical compatibility for express train seats was evaluated with selected anthropometric dimensions ① elbow-to-elbow breadth
② Sitting hip breadth ③ buttock-popliteal length ④ popliteal height. The anthropometric dimensions were from the Size Korea database for male and female with age ranging from 20 to 40 years. The dimensions are categorized by percentiles in Table 3.
Both first- and second-class express train seat dimensions are presented in Table 4. The comparison between the seat dimensions Table 2. The anthropometric data (percentile) from Size Korea with age range from 20- to 40 years old
(unit: mm)
Dimensions Male Female
1%ile 5%ile 25%ile 50%ile 75%ile 95%ile 99%ile 1%ile 5%ile 25%ile 50%ile 75%ile 95%ile 99%ile
① elbow to elbow
breadth 403 426 461 488 516 565 600 346 365 396 424 448 489 518
② sitting hip
breadth 313 325 344 359 374 398 414 319 332 350 362 377 402 425
③ buttock-popliteal
length 415 433 456 473 491 515 536 393 411 436 452 468 490 509
④ popliteal height 358 372 392 407 421 441 458 325 341 360 374 388 409 431 Area for right thigh
Area for right buttock Area for left thigh
Area for left buttock
and the anthropometric dimensions were calculated using Eq. 2.
PC = chair dimensionse - anthropometric dimensionsi (2)
Where:
PC : physical compatibility
e : each dimension of the chair - refer to Table 4
i : anthropometric data on each body part - refer to Table 3
3. Results
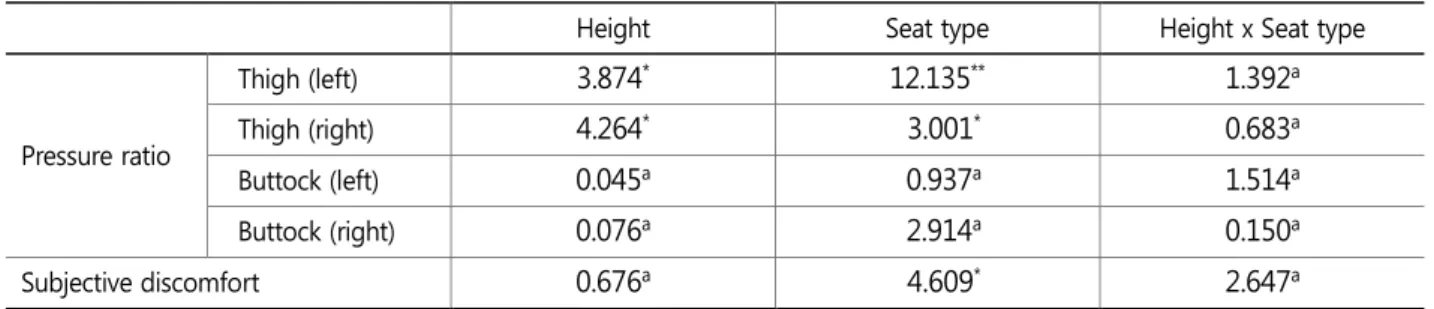
ANOVA for the body pressure ratio at the thigh and buttock regions, and subjective discomfort when testing the main and interaction effects of height and seat type are presented (Table 4).
Table 3. Specification for express train seats
Classification Second-class seat First-class seat
Seat breadth 550 660
Seat pan breadth 450 500
Seat pan depth 445 470
Seat pan height 420 400
Table 4. ANOVA (F-value) for objective and subjective discomfort
Height Seat type Height x Seat type
Pressure ratio
Thigh (left) 3.874* 12.135** 1.392a
Thigh (right) 4.264* 3.001* 0.683a
Buttock (left) 0.045a 0.937a 1.514a
Buttock (right) 0.076a 2.914a 0.150a
Subjective discomfort 0.676a 4.609* 2.647a
*p < 0.1; **p < 0.05; ***p < 0.01, a: Non-significant
3.1 Body pressure ratio
ANOVA revealed significant differences in the pressure ratio according to the main effect of height (p < 0.1) and seat type (p <
0.1). The average pressure ratio was significantly (p < 0.1) greater for 1st~25th percentile height groups than the other groups at the left- and right-thigh regions. The average pressure ratio was significantly greater for a second-class seat than a first-class seat at left (p < 0.05) and right (p < 0.1) -thigh regions (Table 4, Figure 4).
3.2 Subjective discomfort
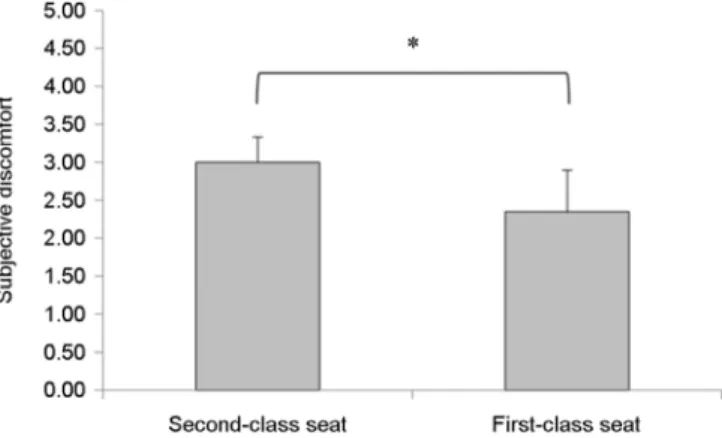
ANOVA revealed significant differences in the subjective discomfort according to the only main effect of the seat type (p < 0.1).
The overall discomfort was significantly greater for the second-class seat than a first-class (Table 4, Figure 5).
3.3 Physical compatibility for train seat
Physical compatibility was calculated by comparing seat dimensions and anthropometric dimensions with Eq. 2 and results are
Table 5. Comparison between seats dimensions and anthropometric dimensions for human body fit
Male Female
1%ile 5%ile 25%ile 50%ile 75%ile 95%ile 99%ile 1%ile 5%ile 25%ile 50%ile 75%ile 95%ile 99%ile
Second-class seat A - ① 147 124 89 62 34 -15 -50 204 185 154 126 102 61 32
B - ② 137 125 106 91 76 52 36 131 118 100 88 73 48 25
C - ③ 30 12 -11 -28 -46 -70 -91 52 34 9 -7 -23 -45 -64
D - ④ 62 48 28 13 -1 -21 -38 95 79 60 46 32 11 -11
First-class seat A - ① 257 234 199 172 144 95 60 314 295 264 236 212 171 142
B - ② 187 175 156 141 126 102 86 181 168 150 138 123 98 75
C - ③ 55 37 14 -3 -21 -45 -66 77 59 34 18 2 -20 -39
D - ④ 42 28 8 -7 -21 -41 -58 75 59 40 26 12 -9 -31
A. Seat breadth - ① elbow to elbow breadth B. Seat pan breadth - ② sitting hip breadth C. Seat pan depth - ③ buttock-popliteal length D. Seat pan height - ④ popliteal height Grey colored area: uncomfortable area
presented in Table 5. The physical compatibility had both positive and negative values with its own explanation. The positive physical compatibility value in the seat breadth (A - ①) and seat pan breadth (B - ②) represents a comfortable seat dimension for the passengers. However, the negative physical compatibility value in the seat pan depth (C - ③) and seat pan height (D - ④) represents a comfortable seat dimension for the passengers. The greyed area in Table 6 represents the uncomfortable seat dimensions for the passengers. With this in view, for genders, the number of greyed areas was higher for the second-class seat than the first-class seat. For females, the number of greyed areas was higher in the first-class seat. However, for males, the number of greyed areas was higher in the second-class seat. Overall results showed that the second-class seat was more uncomfortable than the first-class seat for the passengers.
4. Discussion
The express train (first- and second-class) seats' discomfort was evaluated by pressure ratio, anthropometric data, and subjective discomfort rating. The results showed that the average pressure ratio in the left- and right-side thigh regions was greater when the participants sat on the second-class seat than on the first-class seat. With respect to the participants’ height groups, the average pressure ratio was greater for the 1st~25th percentile height groups' (149.8~160.8cm) left- and right-side thigh regions.
Due to the shorter buttock-popliteal length (compared with other groups) for the participants in 1~25th percentile height groups, they experienced higher pressure ratio in their left- and right-side thigh regions. These results suggest that the second-class seat more is uncomfortable for the passengers than the first-class seat. The risk of pressure sores can be reduced by uniformly distributing the body weight over the seating surface (Shen and Galer, 1993; Park et al., 1997; Mehta and Tewari, 2000). Kumar et al. (1994) highlighted that the seat interface is known to cause soft-tissue deformation leading to restricted blood and nutrient flow, and thus human discomfort. The high pressure on the soft tissues of the thighs yields considerable discomfort and reduces working efficiency (Jahansson and Nilsson, 2006). The higher interface pressure has been associated with a higher incidence of sitting-acquired pressure disease (Brienza et al., 2001). Stinson et al. (2003) investigated various seating positions and suggested that reclining an armchair by 30 degrees would reduce interface pressure and the risk of pressure ulcer development. In the same way we can expect a similar effect when we are sitting on the train seat with 30-degree inclination. However, we need to conduct further investigation.
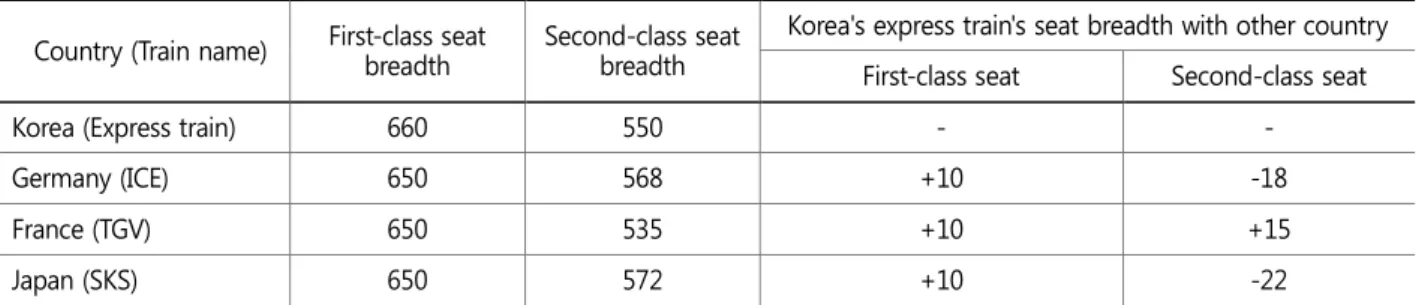
The overall subjective discomfort rating score was greater for the second-class seat than the first-class seat. These results showed that the second-class seat was more uncomfortable than the first-class seat. The second-class seats have not been designed with neck support like the first-class seats (Figure 1), which causes discomfort in the neck region. The seat breadth is one of the important factors when designing a seat for passenger comfort. Table 6 compares the seat breadth dimensions among different countries. Korea's express train's first-class seat breadth is larger than those of other countries, which provides comfort for the passengers. However, Korea's express train's second-class-seat breadth is shorter than those of other countries (other than Japan's
Table 6. Comparison of seat breadth dimension among countries
(unit: mm)
Country (Train name) First-class seat breadth
Second-class seat breadth
Korea's express train's seat breadth with other country First-class seat Second-class seat
Korea (Express train) 660 550 - -
Germany (ICE) 650 568 +10 -18
France (TGV) 650 535 +10 +15
Japan (SKS) 650 572 +10 -22
SKS), which causes discomfort for the passengers.
The physical compatibility results showed that the second-class seat's breadth (A - ①) was inadequate for the 95th and 99th percentile male. Therefore, this study recommends that an increment in the second-class seat's breadth dimension would increase the passengers' comfort. Also both first- and second-class seats' physical compatibility results showed that seat pan depth and seat pan height were inadequate for many percentiles (Table 6). It is suggested (Andrew, 1972) that a footplate with controlled height range is considered to elucidate the problems associated with physical compatibility with seat pan depth and seat pan height. Another important point to be remembered here is that passengers rested their feet on the floor in this study. Future studies should consider different backrest inclination angles and footplates with different height ranges to evaluate the discomfort or otherwise the express train seat. Also this study considered only a 10min seating experience; further study should consider a longer period of seating.
5. Conclusion
This study evaluated Korea's Honam express train's first- and second-class seat discomfort by using pressure measurement, physical compatibility and subjective discomfort evaluation methods. The average interface pressure ratio was greater for the second-class seat than the first-class seat in the left- and right-side thigh regions. Also, the pressure ratio was greater for the 1st~25th percentile height groups (149.8~160.8cm). The overall subjective discomfort rating score was greater for the second- class seat than the first-class seat. The physical compatibility results showed that the second-class seat's breadth was inadequate for the 95th and 99th percentile male. Also, the physical compatibility results of both first- and second-class seats showed that seat pan depth and seat pan height were inadequate for many percentiles. This study recommends that an increment in the second-class seat's breadth dimension would increase the passengers' comfort. Also consideration of a footplate with a controlled height range to elucidate the problems associated with seat pan depth and seat pan height. The adopted methodologies could be used to measure the seating comfort of the train seats.
References
Andrew, I. and Manoy, R., Anthropometric survey of British rail footplate staff, Applied Ergonomics, 3(3), 132-135, 1972.
Brienze, D.M., Karg, P.E., Geyer, M.J., Kelsey, S. and Trefler, E., The relationship between pressure ulcer incidence and buttock-seat cushion interface pressure in at-risk elderly wheelchair users, Archives of Physical Medicine and Rehabilitation, 82(4), 529-533, 2001.
British Standards Institution, BS6841, Measurement and evaluation of human exposure to whole-body mechanical vibration and repeated shock, 1987.
Code, U.I.C., Guidelines for evaluating passenger comfort in relation to vibration in railway vehicles. International Unions Railways, 1995.
Dhingra, H., Tewari, V. and Singh, S., Discomfort, pressure distribution and safety in operator's seat - a critical review, Agricultural Engineering International: the CIGR Journal of Scientific Research and Development, Invited Overview Paper, Vol. V, 2003.
Dunk, N.M. and Callaghan, J.P., Gender-based differences in postural responses to seated exposures. Clinical Biomechanics, 20(10), 1101-1110, 2005.
Ebe, K. and Griffin, M.J., Qualitative models of seat discomfort including static and dynamic factors, Ergonomics, 43(6), 771-790,
2000.
Eitzen, I., Pressure mapping in seating: a frequency analysis approach, Archives of Physical Medicine and Rehabilitation, 85(7), 1136 -1140, 2004.
Hacaambwa, T.M. and Giacomin, J., Subjective response to seated fore-and-aft direction whole-body vibration, International Journal of Industrial Ergonomics, 37(1), 61-72, 2007.
International Organization for Standardization, ISO2631, Mechanical vibration and shock - Evaluation of human exposure to whole-body vibration, 1997.
Jahansson, A. and Nilsson, L., Evaluation of discomfort using real-time measurements of whole body vibration and seat pressure distribution while driving trucks (master's thesis), Lulea University of Technology, Gothenburg, Sweden, 2006.
Kim, T.H., Cho, Y.G., Yoon, Y.S. and Park, S.J., Dynamic ride quality investigation and DB of ride values for passenger and RV cars, SAE Technical Paper 2001-01-0384, 2001.
Kolich, M., A conceptual framework proposed to formalize the scientific investigation of automobile seat comfort, Applied Ergonomics, 39(1), 15-27, 2008.
Kumar, A., Bush, N.J. and Thakurta, K., Characterization of occupant comfort in automotive seats, Automotive Body Interior and Safety Systems, IBEC 1994, 1-4, 1994.
Kyung, G. and Nussbaum, M.A., Driver sitting comfort and discomfort (part II): relationships with and prediction from interface pressure, International Journal of Industrial Ergonomics, 38(5), 526-538, 2008.
Mehta, C.R. and Tewari, V.K., Seating discomfort for tractor operators - a critical review, International Journal of Industrial Ergonomics, 25(6), 661-674, 2000.
Na, S., Lim, S., Choi, H.S. and Chung, M.K., Evaluation of driver's discomfort and postural change using dynamic body pressure distribution, International Journal of Industrial Ergonomics, 35(12), 1085-1096, 2005.
Nahvi, H, Nor, M.J.M., Fouladi, M.H. and Abdullah, S., Evaluating automobile road vibrations using BS 6841 and ISO 2631 comfort criteria, In 1st Regional Conference on Vehicle Engineering & Technology, Kuala Lumpur, Malaysia, 2006.
Park, S.J. and Kim, C.B., The evaluation of seating comfort by the objective measures, SAE Technical Paper, SAE Technical Paper 970595, 1997.
Park, S.J. and Subramaniyam, M., Evaluating methods of vibration exposure and ride comfort in car, Journal of the Ergonomics Society of Korea, 32(4), 381-387, 2013.
Park, S.J. and Subramaniyam, M., Ride quality investigation of passenger cars on different road conditions, Journal of the Ergonomics Society of Korea, 32(4), 389-396, 2013.
Park, S.J., Cheung, W.S., Cho, Y.G. and Yoon, Y.S., Dynamic ride quality investigation for passenger car, SAE Technical Paper 980660,
1998.
Park, S.J., Min, B.C., Lee, J.K. and Kang, E.S., Development of evaluating system for ride comfort and fatigue in vehicle, SAE Technical Paper 2001-01-0388, 2001.
Seigler, T.M., A comparative analysis of air-inflated and foam seat cushions for truck seats (doctoral dissertation), Virginia Polytechnic Institute and State University, 2002.
Shen, W. and Galer, I.A., Development of a pressure related assessment model of seating discomfort, In Proceedings of the Human Factors and Ergonomics Society Annual Meeting, SAGE Publication, 37(10), 831-835, 1993.
Stinson, M.D., Porter-Armstrong, A. and Eakin, P., Seat-interface pressure: a pilot study of the relationship of gender, body mass index, and seating position, Archives of Physical Medicine and Rehabilitation, 84(3), 405-409, 2003.
Vos, G.A., Congleton, J.J., Steven Moore, J., Amendola, A.A. and Ringer, L., Postural versus chair design impacts upon interface pressure, Applied Ergonomics, 37(5), 619-628, 2006.
Wu, X., Rakheja, S. and Boileau, P.E., Study of human-seat interface pressure distribution under vertical vibration, International Journal of Industrial Ergonomics, 21(6), 433-449, 1998.
Yong, W.H., Ming, W.X. and Jian-wu, D., Multidimensional coefficient approach to comfort evaluating for high-speed train, TELKOMNIKA Indonesian Journal of Electrical Engineering, 12(3), 2036-2041, 2014.
Ziolek, S. and Wawrow, P., Beyond percentiles: an examination of occupant anthropometry and seat design, SAE Technical Paper 2004-01-0375, 2004.
Author listings
Se Jin Park: [email protected]
Highest degree: PhD, Department of Industrial Engineering, Korea University Position title: Director, Division of Convergence Technology, KRISS
Areas of interest: Human Factors, Human Sensibility, Human Vibration, Biomechanics, HCI
Seung Nam Min: [email protected]
Highest degree: PhD, Department of Industrial Engineering, Hanyang University
Position title: Senior Research Scientist, Center for Medical Metrology, Division of Convergence Technology, KRISS
Areas of interest: Human Factors, Industrial Ergonomics, Human Sensibility, Biomechanics, Human Vibration, Industrial Safety
Heeran Lee: [email protected]
Highest degree: PhD, Department of Clothing and Textiles, Chungnam National University Position title: Senior Research Scientist, Division of Convergence Technology, KRISS
Areas of interest: Clothing Comfort, Clothing Ergonomics, 3D Anthropometry Measurement, 3D Clothing Pattern Development
Murali Subramaniyam: [email protected]
Highest degree: PhD Scholar, Department of Mechanical Design Engineering, Chungnam National University Position title: Research Scholar, Center for Medical Metrology, Division of Convergence Technology, KRISS
Areas of interest: Biomechanics, Digital Human Modeling (DHM), CAD/CAM, Ergonomics, Human Factors, Human Vibration
Woo Sung Suh: [email protected]
Highest degree: Bachelor of Mechanical Design Engineering, Kumoh National Institute of Technology
Position title: Chief, Design 1 Team of Seat Research & Development Center, DAEWON KANG UP CO., LTD./SEONGHWAN PLANT Areas of interest: Car & Train Seat