Environmental Pollutants on the Transport Sector in Korea
So Won Yoon··Tae Yong Jung*
Dept. of Landscape Architecture, Sangmyung Univ.
IGES(Institute for Global Environmental Strategies)*
(Manuscript received 9 June 2003; accepted 16 July 2003)
교통부분에 있어서 에너지 소비 및 환경오염물질 저감방안에 관한 연구
윤소원·정태용*
상명대학교 환경조경학과, 지구환경전략연구소*
(2003년 6월 9일 접수, 2003년 7월 16일 승인)
요 약
본 연구에서는 한국에서 도로 승용차로부터 배출되는 CO2, 대기오염물질 및 에너지 소비에 대한 분석, 전망을 하였다. 도로 승용차 교통부분에서의 에너지 소비 및 CO2와 환경오염물질의 추세는 자동차수와 년간주행거리, 평균 탑승자수, 연료 효율을 바탕으로 구하였다.
장래 에너지 소비와 배출, 시나리오 분석은 스톡홀름 환경연구소(SEI-B(Stockholm Environment Institute-Boston))에서 개발한 LEAP(Long Range Energy Alternative Planning System)을 이용하였다. 시나리오는 2005년부터 BaU(Business-as-Usual), CNG(Compressed Natural Gas) 버스의 도입, 경차 이용의 증가, 30$/TC와 300$/TC 탄소세 도입으로 정하였다.
1998년을 기준년도로 하고 2020년을 목표년도로 하여 시뮬레이션하였다.
분석결과 2020년까지의 전망 및 시나리오 분석을 통하여 도로자가용교통부분에서 에너지를 절감하고 CO2및 대기오염물질을 저감하기 위하여 도입한 개별정책들을 통합하고 정책간 상승 효과를 볼 수 있도록 팩키지화시키는 것이 효과적이라고 분석되었다.
주요어 : 에너지 소비, 도로승용차 교통, 환경정책, LEAP
Corresponding Author: So Won Yoon, Dept. of Landscape Architecture, Sangmyung Univ., 98-20 Anseo-dong, Chonnam, Korea Tel: 82- 31-504-6556, Fax: 82-31-504-6556 E-mail: [email protected]
I. Introduction
The transport sector is responsible for over 25%
of world primary energy use and 22% of Carbon Dioxide(CO2) emissions from fossil fuel use. It is the most rapidly growing sector with energy use in 1996 of about 70 Exajoule(EJ). Without appro- priate counter actions, this figure will double to 140EJ in 2025(Banister, 1998).
In Korea, the energy used by transport amounted to 20.6% of total energy demand in 2000 and 13% in 1980 and it has increased by 7.6% during the last 20 years (Ministry of Commerce Industry, Republic of Korea & Energy
&Korea Energy Economic Institute (MOCIE, ROK, KEEI, 2001). Because the transport energy demand has been growing faster than that in other sectors, this proportion will be rapidly increased.
Due to the rapid increase of the number of vehicles, the consumption of petroleum is 30,770,000 tonne of oil equivalent(TOE) in 2000. It is 6.3 times more than in 1980 and 2.2 times more than in 1990.
Transport is an important contributor of green- house gas emissions, particularly Nitrogen Oxides(NOx) and Carbon Monoxide(CO) (Acutt and Dodgson, 1998).
The CO2 emissions from industrial and resi- dential/commercial sectors have decreased dur- ing the last 10 years. On the other hand, the emissions from transport sector has increased CO2emissions from 17.7% in 1990 to 20.9% in 2000 (MOCIE and KEEI, 2001).
The factors which influence the energy con- sumption and air pollutants in transportation can be classified into three parts as follows: technolo-
gy, operation, and demand of transportation vehicles (Korea Energy Economics Institute, 1998).
Korea is a densely populated country with a small land area. The country needs to promote a public transportation system more actively than other countries. Public transportation system in Korea is losing competitiveness over private transportation. This is due to a poor institutional system, poor quality of service and inefficient routing and operation. The share of public trans- portation in the nation’s total transportation vol- ume is declining (Ministry of Environment, ROK, 2001).
The objective of this paper is to provide useful information for establishing the desirable energy policy in road passenger transportation sector. It also aims to analyze and project the energy demand and emissions, based on different sets of policy scenarios that would be implemented now or in the future.
II. Methodology
In this study, we estimate the trends of energy demand, Greenhouse Gas(GHG), and air pollu- tants emission from road passenger transporta- tion based on the vehicle population, annual vehicle travel, average number of occupants (load factor) and fuel economy. The method is:
EDi(t) =
S
i
Vi(t)×PKi(t)×EIi(t) (1)
Where, EDi(t) is the total energy demand of vehicle type i in year t by passenger transporta- tion in toe, PKi(t) is the average annual passenger kilometer by vehicle type i in year t, and EIi(t) is the energy intensity of vehicle type i in year t in
liters/passenger-km1). Passenger-kilometer(p-km) demand for public cars is derived from a regres- sion model. The model is:
InTDp(t) = 0.40096lnFDP(t) + 0.00868TDt-1+ 6.633 (2) Where, InTDp(t) is the passenger-Kilometer(p- km) demand for public passenger car, GDP(t) is gross domestic product in year t, and TDt-1 is transport demand(pass-km) of previous year.
using the GDP and transport demand(p-km) of previous year.
Table 1 shows the vehicle type used in this study. We focus on the passenger cars because in the transport energy demand in 1999, roads transportation contributed about 74% and the railroads - 1.7%, air transportation - 7.4%, marine transportation - 16.9%(KEEI, 1999). We, therefore, see that roads transportation contributed over- whelming portion. The demand for vehicles, especially passenger cars, will increase with the per capita income. Road passenger cars can be divided into the private and public types. Private vehicles can be further divided into passenger cars and buses.
Private passenger cars use gasoline or LPG.
However, the share of gasoline in private passen- ger cars was 99% in 1998. Private buses also use ether diesel or LPG. However, the share of using
the diesel in private buses was 82% in 1998.
Public buses use only diesel and taxis use the LPG. In this study, a small portion of fuel used by vehicle type is ignored.
The projection of economic growth was derived from data in the ‘Long-term Energy Outlook and Strategy Development Report for the 21st Century in Korea’(KEEI, 2001).
Passenger-Kilometer(p-km) demand for private cars is derived from the estimated number of vehicles, average mileage and road factor (aver- age number of occupants).
PKi(t) = VPi(t)×VM(t)×RFi(t) (3)
Where, PKi(t) is the total average annual pas- senger kilometer traveled by vehicle type i in year t, VPi(t) is the registered number of vehicle by vehicle type i in year t, VM(t) is the annual average mileage of vehicle type i in year t, and RFi(t) is average number of occupants by vehicle
1) According to the result of interviews with people who are in charge of the transportation data which is recorded at statistics year book based on the survey data, we can get relatively correct data on the transport demand of the public vehicle. However, we cannot be convinced of the precision of the data on the private passenger car because the elements needed to investigate private passenger- kilometer demand are diverse.
Table 1. Vehicle type of this study
Service Use Type Vehicle Type Fuel Type
Compact car (less than 800cc)
Passenger cars Small car (less than 1500cc) Gasoline and
Private Medium car (less than 2000cc) (LPG)
Road Large car (more than 2000cc)
Buses Diesel and (LPG)
Public Buses Diesel
Taxi LPG
Service Use Type Vehicle Type Fuel Type
type i in year t in pass-km/veh-km.
It is important to project the number of vehi- cles hereafter since the rapid increase of energy demand is caused by an increase in the number of vehicles. The fact that the number of vehicles, VPi(t) will not increase continuously in the future is well known due to various constraints (Transportation Development Institute, 2000). It was forecasted that the rate of vehicles growth would slow down as it approaches the saturation level. Therefore, we chose a Gompertz function to analyze this trend.
The saturation level of the number of vehicles was determined by referring to the research results of Transportation Development Institute and also by comparing and verifying with the number of vehicles of Japan. The geographical and traffic conditions of Korea are similar to those of Japan. The saturation level of private passenger cars is estimated as about 3.0 persons per car in 2020 and private passenger buses is about 43 buses per 1000 people.
VMi(t) and LF(t) are obtained from the report on Energy Census made by the Korea Energy Economics Institute(KEEI) (MOCIE, 1999) and
projected based on the changing rate of the year- ly mean (KEEI, 2001). Energy intensities are the average energy consumption of some device or end-use per unit of activity. The formula for cal- culating the energy intensity (Stockholm Environment Institute, 2000) is given as:
EIi(t) = 1/FEi(t)×RFi(t) (4)
Where, EIi(t) is the energy intensities by vehi- cle type i in year t, FEi(t) is fuel economy of vehicle type i in year t, and RFi(t) is average number of occupants by vehicle type i in year t in pass-km/veh-km.
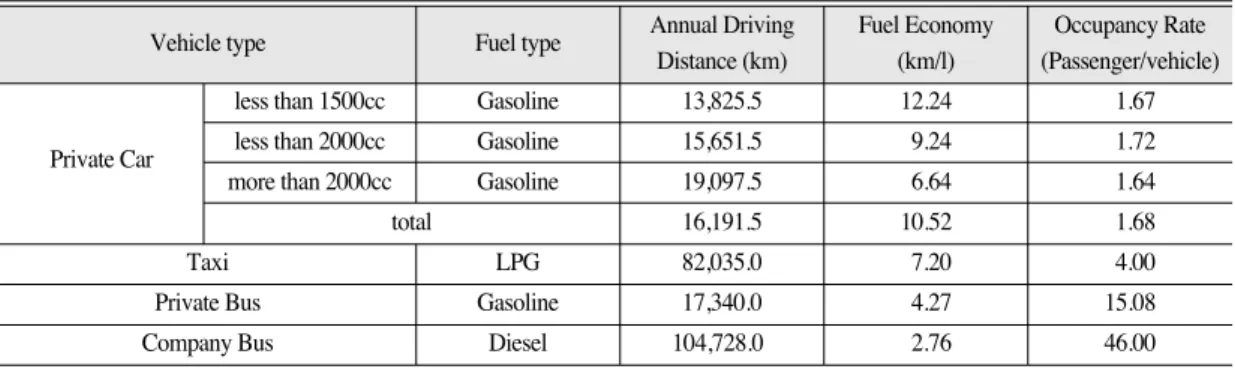
Table 2 shows the major indicators used in this study. Total emissions by emission type are esti- mated by multiplying the emission factor in equation 1. Emission factors are obtained from the report of the National Institute Environmental Research(2000) and the Intergovernmental Panel on Climate Change(IPCC) for CO2 emission fac- tor.
The methodology of this study is described in Figure 1. With the in-put data, the projected ener- gy demand, CO2 emission, and other air pollu- tants are estimated between the 1998 and 2020.
Table 2. Major indicators for energy demand and environmental analyses in road passenger transportation sector in Korea.
Vehicle type Fuel type Annual Driving Fuel Economy Occupancy Rate
Distance (km) (km/l) (Passenger/vehicle)
less than 1500cc Gasoline 13,825.5 12.24 1.67
Private Car less than 2000cc Gasoline 15,651.5 9.24 1.72
more than 2000cc Gasoline 19,097.5 6.64 1.64
total 16,191.5 10.52 1.68
Taxi LPG 82,035.0 7.20 4.00
Private Bus Gasoline 17,340.0 4.27 15.08
Company Bus Diesel 104,728.0 2.76 46.00
Source : Korea Energy Economics Institute (KEEI), 1999, Energy Consumption Survey, Ministry of Commerce, Industry and Energy MOCIE), Korea
Vehicle type Fuel type Annual Driving Fuel Economy Occupancy Rate
Distance (km) (km/l) (Passenger/vehicle)
The LEAP(Long Range Energy Alternative Planning System) model(version 2000), developed by SEI-B(Stockholm Environment Institute- Boston) was used to project future energy demand, CO2and air pollutants and scenario analyses for the transportation sector in Korea.
The LEAP model does not only serve as a data- base but also projects the energy demand and environmental emissions. It also simulates and assesses the physical, economic impacts of alter- native energy policy. LEAP model is a bottom-up model and scenario-based energy environment modeling tool and has the advantage to produce the analysis results by each device, energy level, sub-sector and travel demand.
Travel demand was selected as a fundamental base unit for aggregation in the LEAP model. In this study, future travel demand is exogenously estimated and supplied to LEAP. The National Institute of Environmental Research(NIER), Korea
publishes each fuel emission factor of the trans- portation sector. The emission factors for CO2, CO, NOx, SO2, TSP are specified for each device in Technology and Environmental Database(TED) of LEAP.
III. Basic Profiles of Energy Demand and Environment Emissions
In the world, Korea ranks the 25th in popula- tion, the 11th on total production(GDP), the 12th in export amount, and the 12th in import amount. Korea ranks the 10th in primary energy consumption, the sixth in oil consumption, the fifth in energy importation and the third in oil importation in 1999(Kim et al., 2001)
The population has increased by 1.1% from 1980 to 2000, and this means that it has reached stability. Also it was estimated to have a low Fig. 1. The structure of methodology
growth rate of 0.5% after two decades. The aver- age GDP growth rate was 9.6% from 1980 to 2000. However, the growth rate of passenger cars has been 20.5% from 1980 to 2000. This is over 2 times more as compared with the GDP growth rate. When based on 1980, the number of private car has increased by 42 times in 2000 (Table 3).
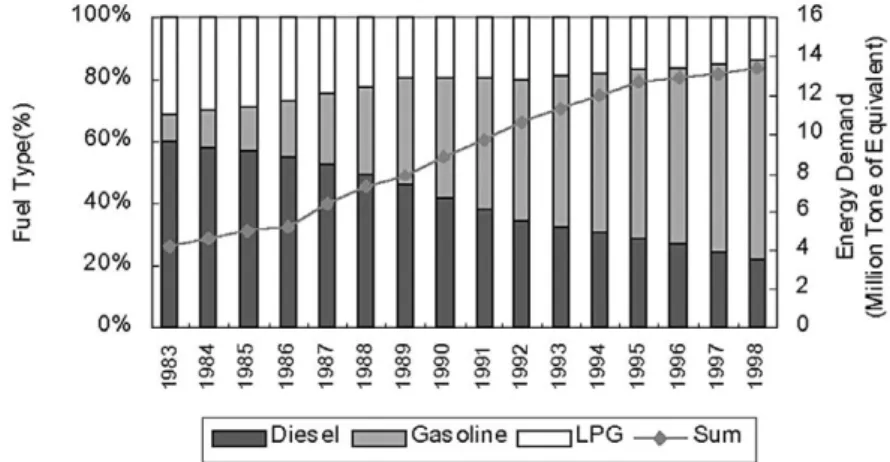
Figure 2 shows the estimated energy consump- tion trends by fuel type(gasoline, diesel and LPG) for passenger transportation. Diesel is found to decrease from 60% in 1983 to 22% in 1998.
Gasoline has dramatically increased from 9% in 1983 to 64% in 1998. The use of gasoline has increased greatly with the increase of the number of private passenger cars.
Total energy consumption is estimated to have increased by about three times from 4.21 Mtoe in 1983 to 13.4 Mtoe in 1998. The LPG for trans- portation is mostly used by taxis. Therefore, the portion of LPG in total energy consumption of the passenger transportation is smallest.
Table 4 shows the emissions of various air pol- Table 3. Stock of major index
Index Unit 1980 1985 1990 1995 1998 1999 2000 Growth rate
’80~’90 ’90~’00 ’80~’00 GDP1) Billion 75,466 111,330 263,430 377,350 394,710 436,799 4761,109 13.3 6.1 9.6 Population 1000P. 38,124 40,806 42,869 45,093 46,430 46,858 47,275 1.2 1.0 1.1 Total No. 291,565 684,968 2,458,660 6,618,874 8,330,246 8,830,375 9,155,990 23.8 14.1 18.8 Private Passenger car2) No. 186,286 457,541 1,915,591 5,791,730 7,338,736 7,581,856 7,813,836 26.2 15.1 20.5 Taxi No. 62,816 99,118 159,331 214,560 242,190 255,350 270,090 9.8 5.4 7.6 Private Bus3) No. 14,249 91,179 338,418 553,283 683,245 921,544 994,395 37.3 11.4 23.6 Public Bus No. 28,214 37,130 45,320 59,301 66,075 71,625 77,669 4.9 5.5 5.2 Bus Total No. 42,463 128,309 383,738 612,584 749,320 993,169 1,072,064 24.6 10.8 17.5 Source : Yearly published data from Korean statistical information system, Korea National Statistical Office http://kosis.nso.go.kr/
1)Series at 1995 constant prices, 2), 3)government use+private use
Index Unit 1980 1985 1990 1995 1998 1999 2000 Growth rate
’80~’90 ’90~’00 ’80~’00
Fig. 2. Energy consumption trends by the fuel type from passenger transportation in Korea
lutants from passenger transportation in Korea in 1998. Diesel cars from passenger transportation are responsible for emitting 54.9% of total emis- sions of NOx, 100% of SO2 and CO, 93.1% of total emissions of TSP and 26.7% of total emis- sions of CO2. In 1998, gasoline and LPG passen- ger vehicles accounted for 90% of the nation’s total passenger vehicles, and diesel passenger vehicles accounted for the remaining 10%. In case of TSP emission, diesel consumption is responsi- ble for most part of the emissions. Emission con- trol technology for diesel vehicles is not yet as advanced as that for gasoline vehicles.
In 1998, private passenger cars, which have the largest share in vehicle population(87%), were responsible for 72.7% of CO2, 56.2% of NOx, 43%
of SO2, 43.1% of CO and 47.1% of TSP, respec- tively. Public transportation consumption, with 3.7% share in vehicle population, is responsible for emitting 27.3% of CO2, 43.8% of NOx, 57.0%
of SO2, 56.9% of CO and 52.9% of TSP.
IV. Scenario Analysis
1. Scenario Setting
Based on the year of 1998, the simulations are set up to the year 2020. The reasons for setting the year 1998 as the base year are the data availability and possibility of introducing related policy.
The year of 2020 is selected because the Korean government announced in 1998 that it Table 4. Emissions from passenger transportation in Korea
CO2 Nox SO2 CO TSP
Passenger Total 6,583.3 60.3 1.3
car Compact 174.7 1.6 - - 0.0
Small 2,474.7 22.7 - - 0.5
Medium 2,833.1 26.0 - - 0.5
Large 1,100.8 10.1 - - 0.2
Vehicle type
Taxi 1,304.1 23.2 - - -
Bus Total 2,871.6 101.7 2.4 55.3 17.2
Private 1,238.7 43.9 1.1 23.8 7.4
Company 1,632.9 57.9 1.4 31.4 9.8
Total emissions 10,759.0 185.3 2.4 55.3 18.5
Diesel vehicles 2,871.6 101.7 2.4 55.3 17.2
(26.7) (54.9) (100.0) (100.0) (93.1)
Fuel type Gasoline vehicles 6,583.3 60.3 - - 1.3
(61.2) (32.6) - (6.9)
LPG vehicles 1,304.1 23.2 - - -
(12.1) (12.5) - - -
Private transportation 7,822.0 104.2 1.1 23.8 8.7
Use type (72.7) (56.2) (43.0) (43.1) (47.1)
Public Transportation 2,937.0 81.1 1.4 31.4 9.8
(27.3) (43.8) (57.0) (56.9) (52.9)
CO2 Nox SO2 CO TSP
(unit: thousand tons)
would comply with the reduction of GHGs from the third compliance period (2018-2022). It is very important to develop concrete plans for reducing emissions of CO2 and to predict the energy demand and other environmental emissions as well as CO2emissions by 2020.
Various scenarios are developed to predict the outcome of possible policy introduction now or in the future. The case scenarios for the present analysis are as follows:
1) BaU : Business-as-usual(BaU) scenario
This is the current trend of energy consump- tion patterns that will continue without any attempt to mitigate emission of CO2 and air pol- lutants.
2) SC 1: Compressed Natural Gas(CNG) bus scenario
In Korea, CNG(Compressed Natural Gas) buses were introduced in 2000. When CNG buses are operated, the emissions of HC and NOx to be chemically transformed to ozone induction material as well as smoke are reduced by 70% as compared with diesel buses.
Therefore, the introduction of CNG buses is necessary for the improvement of air quality over the city area. The Korean government is very actively propelling the introduction of CNG buses. It aims to supply 5,000 CNG buses in the year 2002 and 20,000 by the year 2007, respective- ly. However, it is estimated that real supply of CNG buses will not be over half of the govern- ment target. In this scenario, an introduction tar- get of the 40% of CNG bus is analyzed.
The government goal up to the year 2010 is to increase the CNG buses by 1,000 units per year.
Passenger-km of CNG bus is obtained from the share of vehicle population of CNG buses. The annual average mileage and occupants number would be same as the existing public passengers.
The economics of fuel for CNG buses is based on their operations in Seoul.
3) SC 2 : Increasing share of using compact car scenario
1500 cc - 2000 cc, medium size private passen- ger cars occupy over half of the total private pas- senger cars. In the year 2000, the holding rate of compact cars in Korea was 8% and, this is low as compared with the rate of compact cars in Japan or Europe countries (about 30%). The number of people who want to use compact cars has increased due to the financial crisis that was accompanied by a high oil price and a large exchange rate since the mid-1997. However, peo- ple return to medium-large size passenger cars as soon as the financial crisis was over and the gov- ernment abolished the tax imposition on house- holds having two cars or more. Four plus wheels per km of road in Korea is 135.8 vehicles, which means that it is the highest among the OECD countries compared with 32.7 of USA, 57.9 of Netherlands and 62.3 of England and Korea imports all the fuel which these cars are utilizing (Korea National Statistical Office, 2001). For this reason, the use of compact cars should be encour- aged. Therefore, this study examines the impor- tance of using compact cars and estimates how much they can reduce energy demand and air pollutants emissions. In this scenario, the number of compact cars that will be attained in 2020 will be 30%, the level in Japan in 1998 is analyzed.
For annual average mileages and occupant
number of compact cars, the data for the small passenger cars was used because the data on the compact car did not exist. Fuel economy of com- pact cars was obtained from the Korea NGO’s Energy Network (KNET)( http://enet.or.kr/data/
thrift/thrift_a_05.htm)
4) SC 3 : Carbon tax $30/TC scenario
This is one of several incentive-based instru- ments for reducing greenhouse gas emissions (Kamat et al., 1999). It has been already imple- mented in Sweden, Finland, Norway, Denmark and Holland in the range of $200/TC (Nakata et al., 2001). Cost-benefit analysis for the introduc- tion of carbon tax has been variously processed in Korea. Economic effect of carbon tax is altered according to the magnitude, time and target of imposing the carbon tax and substitution elastici- ty of production function. This study calculates the quantity of CO2to be reduced and economic effect by the introduction of carbon tax $30/TC based on the energy demand and CO2 emissions in BaU scenario from 2005.
5) SC 4 : Carbon tax $300/TC(ton of carbon) scenario
This study calculates the quantity of CO2to be reduced and economic effect by the introduction of carbon tax $300/TC based on the energy
demand and CO2 emissions in BaU scenario from 2005. An energy price was calculated based on prices in 1998 (KEEI, 2001) and energy price elasticity obtained from the report by Korea Energy Economics Institute (KEEI, 2000). Table 5 shows the summary of the scenarios.
2. Scenario Results
1) Business-as-Usual Scenario(BaU) :
Figure 3 shows the estimated travel demand in billion passenger-kilometers and modal split.
Travel demands of private passengers and pri- vate buses, in particular, are dominant. Their shares have gradually increased from 7.2% in 1983 to 43% in 1998 and 18.3% in 1983 to 41.5%
in 1998, respectively. However the structure of travel demand by vehicle types is projected to have little change from 1998 to 2020. The reason is that the growth rate of private passenger cars will be reduced as its supply rate reaches satura- tion level and also driving distance is predicted to be shorter than now.
Figure 4 presents the projection of the energy demand and share by service in passenger cars in BaU scenario. Total energy demand of passen- ger transportation in 2020, with the BaU scenario, would be 30,810 Thousand toe, and this is more than 2.3 times larger than that in 1998. Estimated
Table 5. Summary of scenarios Scenario Period Description
BaU 1998-2020 Business as Usual : No policy intervention
Scenario 1(SC 1) 2000-2020 Compressed Natural Gas(CNG) bus : 40% Introduction of the government’s target of CNG bus Scenario 2(SC 2) 1998-2020 Increasing share of using compact car : The rate of compact car : 30% in 2020
Scenario 3(SC 3) 2005-2020 Carbon tax 30$ : Based on BaU scenario Scenario 4(SC 4) 2005-2020 Carbon tax 300$ : Based on BaU scenario
Scenario Period Description
energy demand of private passenger cars, buses and taxis in 2020 is 19156 thousand toe, 6784 thousand toe and 1850 thousand toe, respectively.
Passenger travel by road in Korea was 56.5% in 2000 (Transport Paper, 2001) and share of private passenger travel in road travel was almost 80% in 1998, this means that transportation of structure in Korea is more dependent on the road transport and private transport. Accordingly, energy demand share of buses would decrease from 36.5% in 1998 to 31% in 2020.
Energy demand share of small vehicles in pri- vate cars decreased from 37.6% to 26.3% in 2020.
In the same year, energy demand share of large passenger vehicles in private car increased from 16.7% in 1998 to 33% in 2020. Increasing of ener- gy demand of large passenger cars with the fuel economy is twice as big as small private cars.
This is a major factor in increasing total energy demand of passenger transportation.
Figure 5 shows estimated emissions from pas- senger transportation in Korea using BaU Fig. 3. Trend of travel demand and modal split
Fig. 4. Estimated energy demand of passenger transportation in Korea in BaU, 1998-2020
between 1998 and 2020. Environmental emissions for 2020 at BAU scenario are estimated at 2.0 times of SO2, 2.0 times of TSP, 2.0 times of NOx, 2.0 times of CO and 2.1 times of CO2 as com- pared to the based year 1998. It is estimated that the amount of increase of CO2would be highest by 2020. Private cars are responsible for the majority of CO2 emission in 2020. Buses are pri- marily responsible for the majority of SO2and CO emissions.
2) Implication of alternate scenarios
Figure 6 shows future energy demand in pas- senger transportation sector with BaU scenario and others. By imposing increasing share of using compact cars, it is possible to reduce ener- gy demand by 0.2 million toe, 0.5 million toe and 1.2 million toe in year 2005, 2010 and 2020 respectively. According to the carbon tax of 300$, it might be possible to reduce energy demand by 2.5 million toe, 2.8 million toe and 3.4 million toe in year 2005, 2010 and 2020 respectively.
Fig. 5. Estimated emissions from passenger transportation in Korea in BaU, 1998-2020
Fig. 6. Energy demand projection under the various scenarios
However, by introducing CNG bus, it is estimat- ed to increase the energy demand by 0.04 million toe, 0.1 million toe and 0.25 million toe in year 2005, 2010 and 2020, respectively. The economics of fuel for CNG buses has an annual mean of 2.2km/m3. This is not yet as advanced as that of the other fuel vehicle. Therefore, the policy mea- sures in this sector should focus on how to achieve fuel substitution, promote the use of pub- lic transportation system, and make the energy efficient vehicles available in the market.
Table 6 shows the reduction of SO2, TSP, CO, NOx and total reduction of the amount of pollu- tant emissions under compact cars and CNG buses scenarios from BaU. Results shows that CNG bus scenario reduces the largest amount of environment emissions in all future years as compared to other scenarios. Especially, for the
reduction of CO and NOx emissions, CNG buses scenario established the most effective scenario.
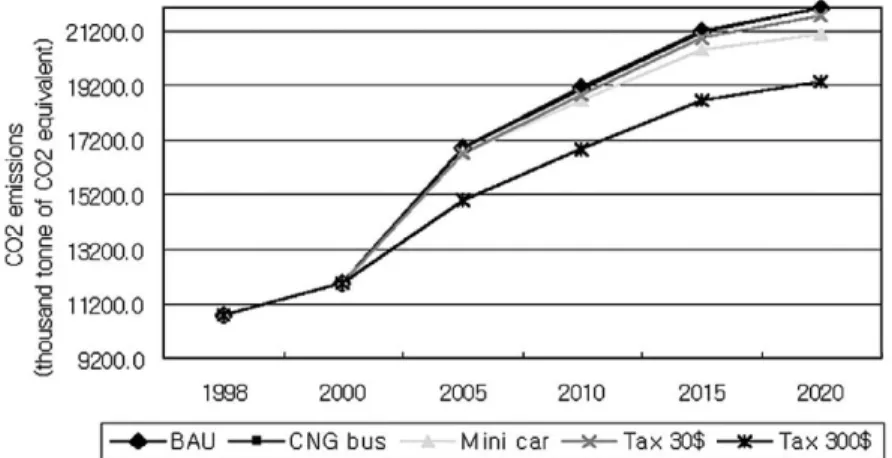
Figure 7 shows future CO2emissions in pas- senger transportation sector with BaU scenario and others. By imposing carbon tax of 300$, it is possible to reduce CO2 emissions by 1952 thou- sand tones of CO2 equivalent, 2245 thousand tones of CO2equivalent and 2650 thousand tones of CO2 equivalent in year 2005, 2010 and 2020, respectively. According to the increasing share of using compact cars, it might be possible to reduce CO2emissions by 185 thousand tones of CO2 equivalent, 418 thousand tones of CO2 equivalent and 953 thousand tones of CO2equiv- alent in year 2005, 2010 and 2020, respectively.
Also, by introducing CNG bus it is estimated to reduce the CO2emission by 4 thousand tones of Table 6. Reductions of pollutant emissions from BAU under various scenarios
SO2 TSP CO NOx Total
2000 2010 2015 2020 2000 2010 2015 2020 2000 2010 2015 2020 2000 2010 2015 2020 2000 2010 2015 2020 0.00 0.00 0.00 0.00 0.00 0.04 0.08 0.13 0.00 0.00 0.00 0.00 0.00 1.70 3.83 6.32 0.00 1.73 3.91 6.45 0.00 0.12 0.28 0.45 0.00 0.85 1.90 3.11 0.01 2.83 6.28 10.29 0.02 4.10 9.11 14.93 0.04 7.91 17.56 28.79 Mini car
CNG bus
SO2 TSP CO NOx Total
2000 2010 2015 2020 2000 2010 2015 2020 2000 2010 2015 2020 2000 2010 2015 2020 2000 2010 2015 2020 (unit : 1,000 tons)
Fig. 7. CO2emission projection potentials in passenger transportation sector.
CO2equivalent, 8 thousand tones of CO2equiva- lent and 20 thousand tones of CO2 equivalent in year 2005, 2010 and 2020, respectively. However, in 2020, Carbon 300$ scenario is estimated to decrease by the largest amount, i.e. 2650 thou- sand tones of CO2 equivalent as compared with CO2emissions from BaU(Fig. 8).
V. Conclusion
In this study, the energy demand, the air pol- lutants and CO2 emissions for road passenger transportation sector in Korea are projected up to the year 2020. Also, policies that could be possi- bly introduced now and in the future are assessed under the various scenarios. Regarding the CNG buses, the increasing share of using compact cars and imposition of carbon tax 30$/TC and 300$/TC were also evaluated.
The major results of this study could be sum- marized as follows:
As shown in the BAU scenario analysis, the energy demand, air pollutants and CO2emission will continuously increase in the future if appro-
priate policy interventions are not made.
Introducing CNG bus scenario is found to reduce air pollutants by 6.6%, and CO2 by 0.1% from BAU in 2020. However, this does not save the energy because the annual mean fuel economy of CNG bus of 2.2km/m3is not yet as advance as that of the other fuel vehicles. It is expected that large amount of air pollutants emitted from transportation sector can be reduced if the gov- ernment continuously enhances a fuel economy of CNG buses and replaces the current 20,000 diesel bus with CNG bus by 2007.
In addition to the CNG buses, the Korean gov- ernment has already taken some efforts to devel- op and supply low pollution vehicle such as elec- tric and hybrid automobile, electric and hybrid prototypes in the natural environment conserva- tion areas and special tourist zones for a specific period from the year of 2000. Although, the Korean government has already taken some effort to develop policies, it has encountered problems such as constraints on power perfor- mances, driving ranges, high cost recharging facilities and other technical problems. Therefore, Fig. 8. CO2emission reduction potentials in passenger transportation sector.
government has to provide subsidies, tax breaks and other assistance for improving technologies that are commonly used. By increasing the share of compact cars, it is possible to save energy demand by 4.4% and to reduce air pollutants by 1.4% and CO24.4 % from BAU in 2020.
It is very important that the reforms of con- sumption in excess trends which prefers large- medium size passenger cars as well as conscious- ness level of drivers not to excessively use pas- senger cars. This includes active and continuous policies for supplying compact cars. There is a need to promote a shift to fuel-efficient vehicles like compact cars. For improving fuel efficiency of vehicles, it is necessary to strengthen fuel effi- ciency regulations and standards. Although the technical efficiency of vehicles has improved steadily over the last 20 years, consumer prefer- ences for larger, heavier and more powerful models have offset most of the efficiency gains, yielding little change in fuel economy.
Since Korea is a densely populated country with little land area, the country needs to pro- mote a public transportation system more active- ly than other countries. Nevertheless, Korea’s public transportation system is losing competi- tiveness over private means of transportation.
If the government will make an effort to improve the poor institutional system, the poor quality of service and inefficient routing and operations, citizens will try to reduce using the private passenger cars. The country can reap remarkable benefits from energy conservation and exhaust pollution reduction. This is because the energy consumption efficiency of public transportation is much higher than that of private transportation
Carbon tax is the most effective reduction of CO2 emissions and energy saving in the trans- portation sector. The imposition of carbon tax in this sector, it would increase large amount of government revenue.
However, the key factor is how to use this rev- enue. Firstly, reducing income and corporate tax to boost the economy by increasing the competi- tion and investment. Secondly, transferring this tax revenue to energy saving programs and envi- ronmental improvement. Thirdly, supporting energy R and D in energy and environment tech- nology area. Finally, a more comprehensive examination of the whole tax reform is needed.
A key aspect in developing fuel savings and CO2 emissions reduction transport policies is to integrate individual policies and measures into packages that befit the synergistic interaction among the components (IEA/OECD, 2001). Also we need to integrate local and global environ- ment policy, which in general, is applicable to many Asian developing countries having the same situations.
References
Banister, D., 1998, Introduction: Transport Policy and the Environment, E&FN Spon, London and new York, 1.
European Conference of Ministers of Transport (ECMT), 1993, Transport Policy and Global Warming, ECMC.
IEA/OECD, 2001, Saving Oil and Reducing CO2 Emissions in Transport, OECD, Paris.
Korea Energy Economics Institute(KEEI), 1998, The second-year study of planning national actions for the United Nations Framework Convention
on Climate Change, KEEI, Korea. (in Korean) Korea Energy Economics Institute(KEEI), 1999, Energy
Consumption Survey, Ministry of Commerce, Industry and Energy(MOCIE), Korea. (in Korean)
Korea Energy Economics Institute(KEEI), 2000, Analysis and Outlook of Energy Demand, KEEI, Korea.
Korea Energy Economics Institute(KEEI), 2001, Application Plan of Energy&Carbon tax for Sustainable Development, KEEI. (In Korean) Korea Energy Economics Institute(KEEI), 2001, Long-term
Energy Outlook and Strategy Development for the 21st Century in Korea, KEEI, Korea.
Korea National Statistical Office(KNSO), 2001, Main Statistical Indicator for OECD member countries, KNSO, Korea.
Korea Transport Institute(KTI), 2001, Transport in the 21st century : Prospects, Vision and Strategy, KTI, Korea.
Ministry of Commerce, Industry and Energy, Korea Energy Economics Institute(MOCIE&KEEI), 2001, Energy Info Korea, MOCIE&KEEI, Korea, 24-43.
Ministry of Commerce, Industry and Energy, republic of Korea(MOCIE, ROK), 2000, Korea’s Efforts to Harmonize Energy, Economy and Environment, MOCIE&KEEI, Korea.
Ministry of environment, Republic of Korea(MOE, ROK), 1997, Environmental Protection in Korea, MOE, Korea.
Ministry of Environment, Republic of Korea(MOE, ROK), 2001, Preservation of Air Quality, MOE,
Korea.
Ministry of Finance and Economy, republic of Korea (MOFE, ROK), 2000, First-Half Economic Achievements of Kim Dae-jung Administration, August 2000.
Ministry of Public Management, Home affairs, Posts and Telecommunication, 2002, Japan Statistical Year book, Japan.
National Institute of Environmental Research(NIER), 1999, Cars and CO2, NIER, Korea.
National Statistical office, 2001, 1996, 1991, 1986, 1981, 1976, Korea Statistical Yearbook, Korea.
Kamat, R., Rose, A. and D. Abler, 1999, The impact of a carbon tax on the Susquehanna River Basin Economy, Energy Economics, 21, 262-284.
Kim, S. H., Kim, T. H., Kim, Y. D. and I. G. Na, 2001, Korean energy demand in the new millennium: outlook and policy implication 2000-2005, Energy Policy, 29, 899-910.
Nakata, T. and A. Lamont, 2001, Analysis of the impacts of carbon taxes on energy systems in Japan, Energy Policy, 29, 159-166.
Transport Paper, 1999, Transportation year book, Korea.
Transportation Development Institute(TDI), 2000, Estimating Automobile Ownership Levels in Korea 2000, TDI, Korea. (in Korean)
World Energy Council, 1995, Global Transport Sector Energy Demand 2020, WEC.
http://enet.or.kr/data/thrift/thrift_a_05.htm.
최종원고채택 03. 07. 28