Concentration and Distribution Characteristics of PM
10in High Schools in the Ulsan Metropolitan Area
Jong-Hyeon Jung, Byung-Hyun Shon
*, and Young Gyu Phee
† Faculty of Health Science, Daegu Haany University, Gyeongsan, Korea*Department of Environmental Engineering, Hanseo University, Seosan, Korea
ABSTRACT
The purpose of this study was to investigate the concentration and distribution characteristics of PM
10at high schools classrooms in Ulsan and its surroundings. This study evaluated PM
10levels in classrooms at 79 high schools in Ulsan from May 2008 to May 2009. The average PM
10level was 63.8 µg/m
3, and the rate of exceeding the statutory maintenance limit was 16.0%. The average PM
10level was higher in general schools (64.9 µg/m
3) compared to professional schools (59.2 µg/m
3), and private schools (66.6 µg/m
3) was higher than that of public schools (62.5 µg/m
3). The average PM
10level (68.4 µg/m
3) in general classrooms was significantly (p < 0.01) higher than that in multi-purpose ones (54.6 µg/m
3), and first-year student classrooms (73.3 µg/m
3) was sig- nificantly (p < 0.05) higher than that in second or third grade ones (67.6 µg/m
3, 51.5 µg/m
3, respectively). The PM
10level in schools in Dong-Gu in the vicinity of assorted industrial complexes was higher than that of schools located in other districts around the Ulsan Metropolitan Area. The regression model showed that PM
10level was positively associated with number of students and relative humidity.
Key words: PM
10, Concentration, High school, Classroom, Ulsan
I. Introduction
Since most of daily life occurs indoors in the modern service-industry society, the effect of indoor environment on human health is regarded to be very significant. Due to longer hours of staying indoors, sealing of buildings for energy saving, and the sick house syndrome and multiple chemical sensitivity, which result from the development and overuse of new construction materials, the issue of indoor air quality comes into the limelight. A variety of pollutants exist in the indoor environment due to complicated causes and a variety of emission sources.
The concentration and distribution characteristics of indoor air pollutants vary with temporal and spatial characteristics.1-4)
The substances affecting indoor air pollution of schools include such as asbestos, Environmental Tobacco Smoke (ETS), formaldehyde, Volatile Organic
Compounds (VOCs), odor, ozone, carbon monoxide, carbon dioxide, nitrogen dioxide, sulfur dioxide, such particulate substances as fine particle and ultrafine particle, radon, microbial substances, bacteria, virus, pollen, particle, mite, cockroach, and Polycyclic Aromatic Hydrocarbons (PAHs). Among the indoor pollutants of schools, PM10 may cause to students cough, asthma aggravation and heart malfunction, and nitrogen dioxide and ultrafine particle may hospitalize students due to acute bronchitis and pneumonia.2,5-8)
In addition, fungi, mite, particle and formaldehyde cause atopy and asthma, and VOCs cause such neurologic symptoms as headache and concentration decline.9-13) PM10 is a particulate substance whose diameter is less than and equal to 10µm, staying suspended in the air for a long time. This PM10 is known to cause not only respiratory diseases but also other cardiovascular diseases. It decreases
†
Corresponding author: Faculty of Health Science, Daegu Haany University, Gyeongsan 712-715, Korea, Tel: +82-53- 819-1590, Fax: +82-53-819-1209, E-mail: [email protected]
Received: 12 December 2011, Revised: 25 January 2012, Accepted: 23 February 2012
visibility and acts as a factor to bring in property damage including building. The acute and chronic effects of the PM10 have a bad influence on human body, increasing the death rate of old people and persons who have cardiovascular and respiratory diseases.14,15)
Particulate matters in the air have a different influence on health depending on the chemical composition, and especially, the smaller the particle size the higher the probability for the particles to penetrate into the alveola sac.16) PM10 causes, as a representative substance of indoor air pollution, inflammation reactions to cells.17) In addition, this may settle in the respiratory tract, bronchial tubes, and heart sac, and if inhaled, it is known to cause asthma, aggravation of asthma symptom, cough, and cold as well as cardiovascular diseases.18,19) Especially, nitrogen dioxide and ultrafine particle hospitalize, due to acute bronchitis and pneumonia, more frequently students whose bodily growth is not complete, and dust-containing fungi and mites are related to atopy.9,20) Yang's investigation21) showed that exposure time to PM10 and the effect thereof are very important in view of the fact that high school students spend most of the time indoors. There were studies on the relationship between PM10 and respiratory diseases in Ulsan area where large-scale industrial complexes are located. Yu et al.22) studied the effect of PM10 on the heart function of elementary school students in Ulsan area and Bae et al.23) studied the effect of PM10 on hospitalization of babies due to asthma in Ulsan area. However, these studies are somewhat limited because the authors used weather data from Korea Meteorological Administration and outdoor data of PM10.
Meanwhile, various studies on evaluation of school exposure have been conducted since maintenance and management standards on the air quality in classrooms were established according to School Health Law enforced by Ministry of Education, Science and Technology. Out of theses, the survey on PM10 was performed mainly in the elementary school, but Sohn et al.24) and Cho et al.25) surveyed on the high school PM10. However, the details on the maintaining and controlling the air quality inside the classroom were not studied in these surveys.
Thus, the main objectives of the present study were to identify the concentration distribution for each school, classroom and district in the high schools in
Ulsan City. These results can be used as a basic data for providing the guideline for establishing the national policy to improve the air quality in the school.
II. Subjects and Methods
1. Selection of subjects
This surveys was performed from May 2008 to May 2009 and the target was 238 classrooms in 79 high schools in Ulsan City. The schools were selected considering whether they are general or professional, whether they are public or private and whether they coeducational or not, and the classrooms were selected considering whether they are general or multi-purpose classrooms.
2. Measurement instruments and site selection for sampling
The concentration of PM10 was measured by LD- 3B (SIBATA, Japan), a portable dust apparatus whose concentration measurement ranges from 0.001 to 20 mg/m3 using light scattering method. Before measurements, the apparatus was corrected by zero filter and air flow rate was maintained at 1.7l/min for more than 2 measurements. The specimen was sampled from the classroom and multi-purpose rooms where the classes were going on for an hour before noon and afternoon. The moment of the sampling the specimen was about 10 minutes after starting the class. The average value of measured results was used for each concentration. Most samples were collected at the central positions but, in case the measurement does not disturb class, the apparatus was positioned more than 1 m away from the wall and 1.5 m high over the floor to provide enough distances so that the measurement may not be affected by PM10 in the surroundings.
3. Statistical analysis
The measured data were analyzed by using the SAS Package (SAS/Stat 9.1, SAS Institute, Cary, USA), the concentration difference between two groups based on the characteristics of the school and the class was analyzed by using Student's t-test, comparison of PM10 concentration between grades, regions, and months was conducted by one-way ANOVA, and Duncan's multiple comparison was also made at a significance level at 0.05. And an
optimal model was derived using the stepwise multiple regression analysis to understand the factors affecting PM10 concentration.
III. Results and Discussion
1. PM10 concentrations classified by school characteristic
Ulsan area is packed with Ulsan, Mipo and Onyang national industrial complexes, and the main industry consists of shipping processes, auto parts, and chemical processes. Ulsan Metropolitan City has 51 high schools with 52,424 students in 2010.28) They spend their most of the time at school and so management of indoor air quality is a very important issue.21) Thus, the Ministry of Education, Science and Technology has established and managed the maintenance/management standards on the air quality in classrooms in accordance with School Health Law.29) The students are at the stage of physical growth, and especially poor indoor air quality and environmental pollutants are related to diseases, absence and learning efficiency of students.21,30,31) In the previous research,2) this investigation team partly confirmed that more active management of PM10 and total suspended germs was needed in elementary schools and that in high schools it was necessary to reduce the concentration of carbon dioxide by increasing the number of ventilation or installing appropriate air conditioner equipment.
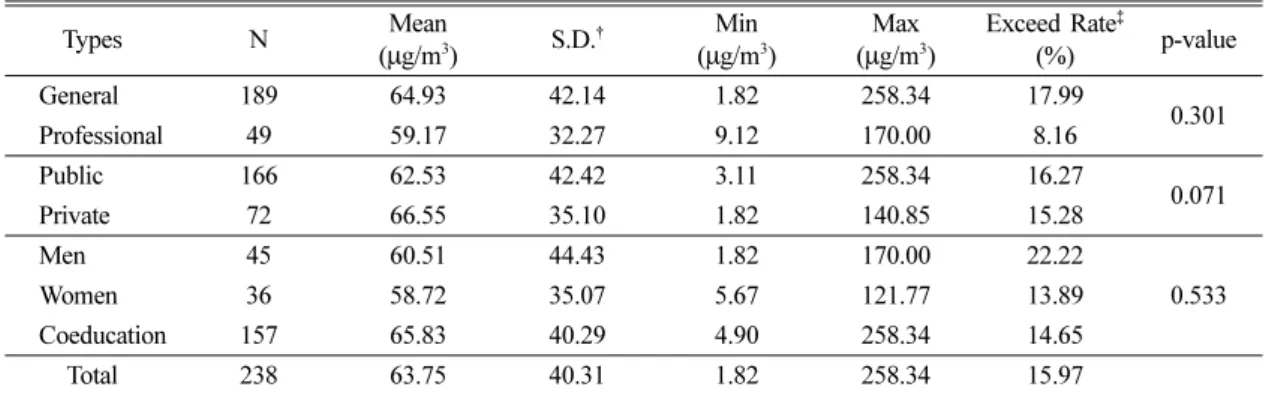
Indoor pollutants which generate inside school classrooms of Ulsan area were investigated on the basis of school and area classifications. First, Table 1
shows characteristics for average PM10 concentration distribution of high schools in Ulsan area. The table shows that the average PM10 concentration of high schools in Ulsan area is 63.8 µg/m3 which is somewhat lower than the concentration of 77 µg/m3 presented by Sohn et al.24) and higher than the result of 49.1 µg/m3 presented by Cho et al.25) These studies were performed to investigate the characteristics of indoor air quality in elementary school, middle schools, and high schools from 2004 to 2007 in Korea and Chungcheongnam-do. PM10 of 64 German schools ranged from 64.9 to 91.5 µg/m3, and the average 40 Greek schools was 118 µg/m3. These values tend to be higher than the results of this research and this difference is considered to be due to the difference in countries and local areas.32,33) Classification of general and professional schools indicates that the average PM10 of general schools (64.9 µg/m3) is higher than that of professional schools (59.2 µg/m3) but the difference is statically insignificant. And the average PM10 concentration of private schools (66.6 µg/m3) is higher than that of public schools. The average PM10 concentration at the classroom of the coeducational high school, boys' high school and girls' high school were 65.8 µg/m3, 60.5 µg/m3 and 58.7 µg/m3, respectively. The average PM10 concentration surveyed in classification of the school characteristics showed in order of coeducational high school > boys' high school >
girls' high school. Especially, the average PM10 concentration in the classroom of the co-educated high school was the highest in 65.8µg/m3. In addition, the average PM10 concentration in private
Table 1. Concentrations of PM
10by type of high school
Types N Mean
(µg/m
3) S.D.
†Min
(µg/m
3)
Max (µg/m
3)
Exceed Rate
‡(%) p-value
General 189 64.93 42.14 1.82 258.34 17.99
0.301
Professional 49 59.17 32.27 9.12 170.00 8.16
Public 166 62.53 42.42 3.11 258.34 16.27
0.071
Private 72 66.55 35.10 1.82 140.85 15.28
Men 45 60.51 44.43 1.82 170.00 22.22
0.533
Women 36 58.72 35.07 5.67 121.77 13.89
Coeducation 157 65.83 40.29 4.90 258.34 14.65
Total 238 63.75 40.31 1.82 258.34 15.97
*N : Number of classrooms
†
S.D. : Standard deviation
‡
Exceed rate : (Number of classroom over maintenance limit/Number of classroom) × 100
high school was 66.6 µg/m3 which was higher than that of the public high school.
2. PM10 concentrations classified by class char- acteristic
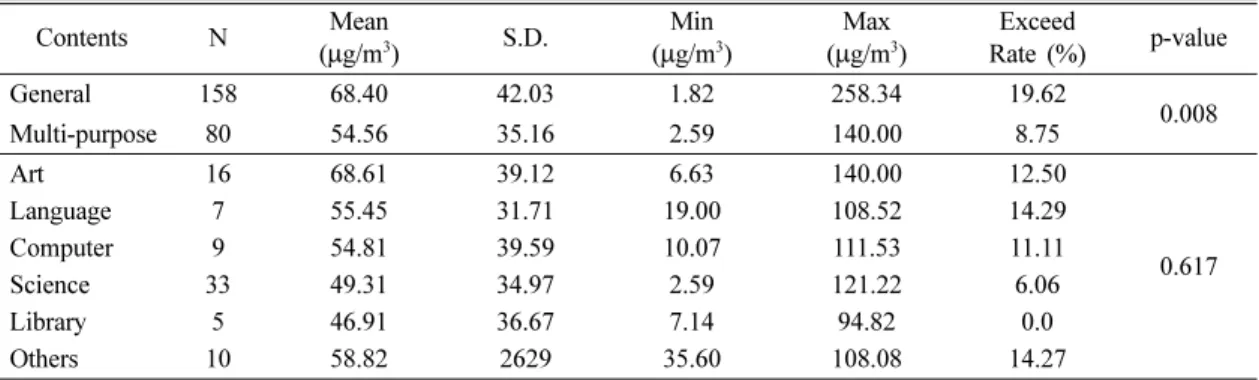
In case of high-school classrooms, the average PM10 concentration of general classrooms (68.4 µg/m3) where students always have activities is higher than that of multi-purpose classrooms and the difference is statistically significant (p < 0.01). This is in agreement with those of Sohn et al.24) and Cho et al.25) who studied PM10 in Korea and Chungcheongnam- do. The average concentration of general classrooms in Ulsan area is somewhat higher than that in Chungcheongnam-do area (53.4 µg/m3) and is lower than the result (82µg/m3) of Sohn et al.24) who studied PM10 of 7 schools. Meanwhile, when multi- purpose classrooms are classified by the use into computer room, science room, and library, etc. the average PM10 concentration of the art classroom related to fine art and music (68.6 µg/m3) is the highest, but compared with other multi-purpose classrooms the difference is not statistically significant (Table 2).
When high school classrooms are classified by the grade, PM10 concentration of classrooms of freshmen who are the most active of the three grades is 73.3µg/m3, which is higher than that of sophomore classrooms (67.6µg/m3). The PM10 concentration (51.5µg/m3) of classrooms for seniors who concentrate on studying is the lowest as expected. The differences are statistically significant (Fig. 1).
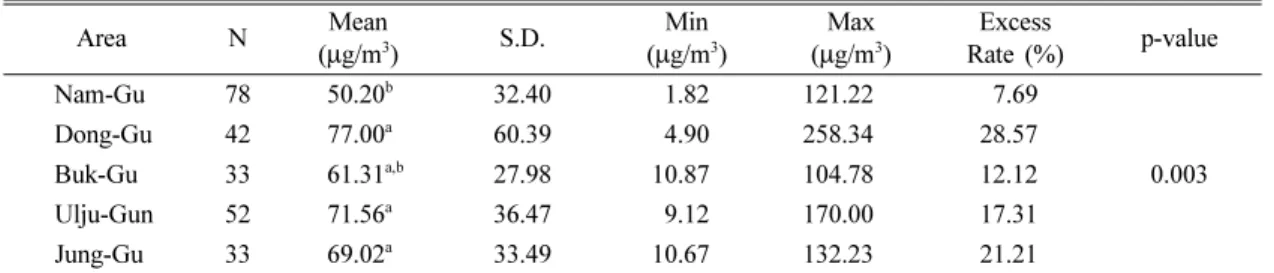
3. PM10 Concentrations classified by area Ulsan area consists of 5 districts. The classrooms in Dong-Gu (77µg/m3) show higher average PM10
concentration than those in Nam-Gu (50.2 µg/m3) with statistical significance (p < 0.01). It is followed by those of Ulju-Gun (71.6µg/m3), Jung-Gu (69 µg/
m3) and Buk-Gu (61.3µg/m3) (Table 3).
Examination of air pollution data from Automatic Monitoring System indicates that, in Ulsan area in 2008, the concentration of PM10 was the highest in spring, followed by winter. And examination of monthly concentrations shows that the concentration of PM10 was the highest in March throughout the entire areas and that in March 2008 the average PM10 concentration of Nam-Gu, Buk-Gu and Ulju- Gun was 78.7µg/m3. 81µg/m3, and 75.7µg/m3, respectively. Especially, Bugok-Dong 2 of Nam-Gu showed the highest concentration of 97 µg/m3 which is close to the 24-hour average of 100 µg/m3. On the whole, the year-average concentration of Nam- Gu in 2008 was 54.8 µg/m3, which exceeds the air quality standard of (50 µg/m3). The year-average concentration of Buk-Gu was 56.0 µg/m3, exceeding
Table 2. Concentrations of PM
10by type of classroom
Contents N Mean
( µg/m
3) S.D. Min
( µg/m
3)
Max ( µg/m
3)
Exceed
Rate (%) p-value
General 158 68.40 42.03 1.82 258.34 19.62
0.008
Multi-purpose 80 54.56 35.16 2.59 140.00 8.75
Art 16 68.61 39.12 6.63 140.00 12.50
0.617
Language 7 55.45 31.71 19.00 108.52 14.29
Computer 9 54.81 39.59 10.07 111.53 11.11
Science 33 49.31 34.97 2.59 121.22 6.06
Library 5 46.91 36.67 7.14 94.82 0.0
Others 10 58.82 2629 35.60 108.08 14.27
Fig. 1. Comparison of PM
10concentrations by school
grade.
the air quality standard, and was found to be the most polluted area compared with surrounding areas. The year-average concentration of Ulju-Gun was 52.0µg/m3, exceeding the air quality standard, but except for spring it was lower than the standard, showing a lower degree of pollution than Nam-Gu and Buk-Gu. Thus, such practical and active reduction strategies as supplementation and integrated manage- ment of the monitoring system for emission source of environmental pollutants, cutoff of harmful factors affecting health of industrial-complex residents and establishment of objective and efficient air management policies are needed now. And in 2009 Ulsan Metropolitan City reported the measured/
analyzed PM10 concentrations of Nam-Gu (48.8µg/
m3), Dong-Gu (41µg/m3), Buk-Gu (51.5µg/m3), Ulju-Gun (48.3µg/m3), and Jung-Gu (54µg/m3).34) These data represent the air conditions of the areas and streets in 5 districts. PM10 concentration of the classrooms in Dong-Gu and Ulju-Gun was 77.0 µg/
m3 and 71.6 µg/m3, respectively, showing the highest concentrations, but the air environment concentration of the two districts was lower than the other districts.
Thus, PM10 concentration of schools in Ulsan area is presumed to be not affected a great deal by the air environment concentration (Fig. 2). But, floating dust may generate due to increase in automobiles and various industrial developments and it may influence directly or indirectly PM10 concentration of classrooms. The number of industries where floating dust may generate is 182 in Nam-Gu, 52 in Dong- Gu, 74 in Buk-Gu, 250 in Ulju-Gun, and 53 in Jung- Gu, and construction industry is the most in industrial classification.28)
The classrooms in Dong-Gu where PM10 concen- tration is the highest has the smallest number of industries where floating dust generates, while Nam- Gu which has the second most industries shows the
lowest PM10 concentration. However, exact judgment on this issue should be made considering the whole nature of air pollution including the access of schools to roads, the size of nearby industrial complexes, pollution sources, and the possibility of smoking.
Since the measurement results of indoor pollutants are affected by various factors such as measurement time and characteristics/construction time of structures, it is unreasonable to judge that the degree of indoor pollution for schools close to industrial complexes is relatively serious. Thus, it is judged that more integrated research is needed which includes the distance between schools and industrial complexes, characteristics of roads around schools, investigation of pollution sources from neighboring industrial complexes, emission or non-emission of pollutants, and monthly emission contribution.
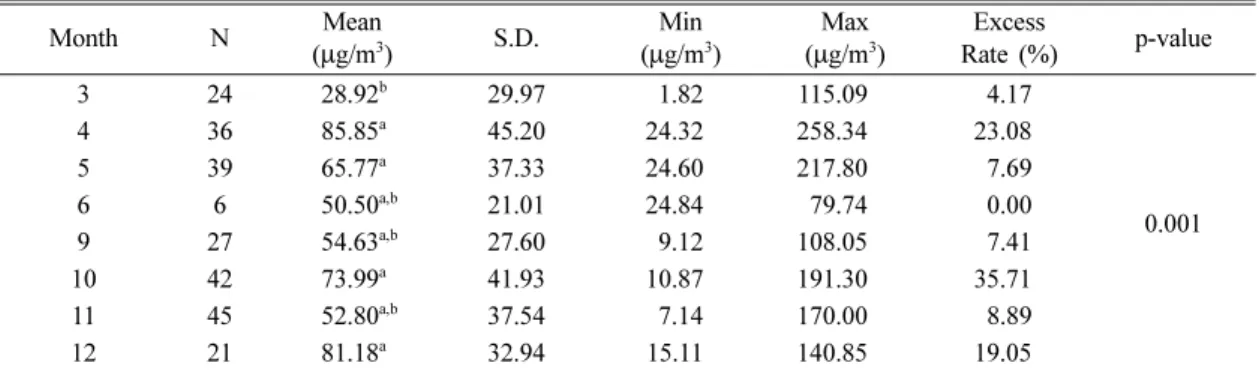
4. Monthly PM10 concentrations
When PM10 concentration was classified by month, April when yellow sand concentrates showed a high average PM10 concentration of 85.9 µg/m3 with
Table 3. Concentrations of PM
10by different area
Area N Mean
( µg/m
3) S.D. Min
( µg/m
3)
Max ( µg/m
3)
Excess
Rate (%) p-value
Nam-Gu 78 50.20
b32.40 1.82 121.22 7.69
0.003
Dong-Gu 42 77.00
a60.39 4.90 258.34 28.57
Buk-Gu 33 61.31
a,b27.98 10.87 104.78 12.12
Ulju-Gun 52 71.56
a36.47 9.12 170.00 17.31
Jung-Gu 33 69.02
a33.49 10.67 132.23 21.21
*a, b: Groups with the same letter were not significantly different by Duncan test ( α = 0.05)
Fig. 2. Comparison of PM
10concentrations by different
area.
statistical significance (p < 0.01). The next was December (81.2 µg/m3) which showed a higher average PM10 concentration, with statistical significance, than March (29 µg/m3) when a new semester begins (Table 4). On the whole, the average concentration of fall (September, October, November) was somewhat lower than those of spring (April) and winter (December). This is contradictory to the result of Sohn et al.24) that the average concentration of fall was higher than that of winter, but agrees with the result of Yang et al.35) that the average PM10 concentration of winter (84.4 µg/m3) was higher than those of summer and fall. Since no spring data are available in both studies, however, exact comparison between this study and the previous ones cannot be made. And investigation of 64 German schools (64.9 µg/m3 for summer, 91.5 µg/m3 for winter) showed a similar trend to the result of this research.32)
Meanwhile, the Ministry of Environment announced that the average PM10 concentration of Ulsan Metropolitan City was 49µg/m3 with the highest concentration in April (64.7 µg/m3).36) The general trend is similar in that the average PM10 con- centrations in schools and in the air reach a maximum in April, somewhat decrease in summer and then increase in October and December (Fig. 3).
Geographically in Korea, yellow sand generates from March to May, concentrating in April. During
this period, indoor and outdoor PM10 concentration appears to be high and yellow sand in the air is considered to inflow somewhat into classrooms.
5. Factors affecting PM10 concentrations Establishing PM10 concentration as a dependent variable and selecting temperature, humidity, no. of students, no. of classes and year of establishment, which can affect the dependent variable, as independent variables, stepwise multiple regression analysis was made. The model was statistically significant, and humidity and no. of students were found to affect
Table 4. Concentrations of PM
10by month
Month N Mean
( µg/m
3) S.D. Min
( µg/m
3)
Max ( µg/m
3)
Excess
Rate (%) p-value
3 24 28.92
b29.97 1.82 115.09 4.17
0.001
4 36 85.85
a45.20 24.32 258.34 23.08
5 39 65.77
a37.33 24.60 217.80 7.69
6 6 50.50
a,b21.01 24.84 79.74 0.00
9 27 54.63
a,b27.60 9.12 108.05 7.41
10 42 73.99
a41.93 10.87 191.30 35.71
11 45 52.80
a,b37.54 7.14 170.00 8.89
12 21 81.18
a32.94 15.11 140.85 19.05
*a, b : Groups with the same letter were not significantly different by Duncan test ( α = 0.05)
Fig. 3. Comparison of PM
10concentrations between indoor and outdoor by month.
Table 5. Multiple regression analysis for PM
10exposure using stepwise
Independent variable β (S.E) t-value p-value R-square
Humidity Number of Students
0.219 0.007
3.70 2.95
0.056
0.087 0.027
**: p < 0.05
somewhat PM10 concentration (Table 5). This show a similar trend to the research result of Fromme et al.33) in that PM2.5 increases by 1.7 µg/m3 as relative humidity increases by 10% and also to the research result of Brains et al.37) in that there is a statistically- significant correlation between the number of student and PM10 concentration.
IV. Conclusions
PM10 concentrations of 238 classrooms in 79 high schools of Ulsan area were measured from May 2008 to May 2009 and then were evaluated after classification by schools, classrooms, areas, and months. As results, the following conclusions are made:
1. The average PM10 concentration of high schools in Ulsan area was 63.8µg/m3, that of general schools (64.9µg/m3) was higher than that of professional schools (59.2µg/m3) and that of private schools (66.6 µg/m3) was higher than that of public schools. And coeducational schools (65.8 µg/m3) showed higher PM10 concentrations than either boys' schools or girls' schools but the difference was statistically insignificant.
2. The average PM10 concentration of general classrooms (68.4 µg/m3) where students are active was higher, with statistical significance, than that of multi-purpose classrooms and the excess rate of maintenance period of general classrooms was 2.5 times that of multi-purpose classrooms (p < 0.01).
Classified by the grade, the average PM10 concentration of freshmen classrooms (73.3 µg/m3) was higher, with statistical significance, than that of sophomore classrooms (67.6 µg/m3), and senior classrooms (51.5 µg/m3) showed a lower average PM10 concen- tration than sophomore classrooms (p < 0.05).
3. The average PM10 concentration of classrooms in Dong-Gu (77.0 µg/m3) was higher, with statistical significance, than that in Nam-Gu (50.2 µg/m3), followed by Ulju-Gun (71.6 µg/m3), Jung-Gu (69 µg/m3) and Buk-Gu (61.3 µg/m3). It is presumed that the average PM10 concentration of classrooms is not related to that of air and to industries where floating dust generates in the same area.
4. The average PM10 concentration in April (85.9 µg/m3) when yellow sand inflows was the highest during the yeat, followed by December (81.2 µg/m3) when the space of classrooms is sealed for energy
conservation. Both months showed higher average PM10 concentrations, with statistical significance, than March (28.9 µg/m3) when a new semester begins.
5. It is judged that, in case of high schools in Ulsan area, general schools, private schools, coeducational schools, schools in Dong-Gu, and general classrooms over multi-purpose classrooms should be given a higher priority for management of PM10. Especially, in April when yellow sand generates seasonally and in December when classrooms are sealed for energy conservation, such an effort as operation of air cleaners is required to reduce fine dust concentration. And it is judged that more integrated research is needed which includes the physical distance between schools and industrial complexes, characteristics of roads around schools, confirmation of pollution sources from neighboring industrial complexes, emission or non-emission of pollutants, and monthly emission contribution.