1. Introduction
1)Atmospheric Particulate Matter(PM) is generated by primary particles that are directly emitted from various sources, secondary particles generated through the conversion of gas to particles, and are continuously distributed in a particle size range of 0.01 to 100 μm. Many toxicological studies have reported that fine particles have a more toxic adverse effect than coarse particles, depending on the particle size(Donaldson et al., 1998; Harrison et al. 2010).
In Korea, Atmospheric environmental standards
for PM
10and PM
2.5, which have long-term prosperity and impact on health, have been established since 1993 and are monitored by the national air pollution monitoring network.
Coarse particles(PM
10-PM
2.5) are generated from natural sources such as mechanical fracturing, soil, and sea salt, and are quickly removed from the atmosphere through gravitational settling and rainfall washing. On the other hand, fine particles(PM
2.5) is mainly generated from anthropogenic combustion sources including vehicles, and it is very difficult to control in terms of regional air quality control due to
Received 5 October, 2018; Revised 29 October, 2018;
Accepted 29 October, 2018
*Corresponding author: Jeong-Ho Park, Department of Environmental Engineering, Gyeongnam National University of Science and Technology, Jinju 52725, Korea
Phone : +82-55-751-3345 E-mail : [email protected]
ⓒ The Korean Environmental Sciences Society. All rights reserved.
This is an Open-Access article distributed under the terms of the Creative Commons Attribution Non-Commercial License (http://
creativecommons.org/licenses/by-nc/3.0) which permits unrestricted non-commercial use, distribution, and reproduction in any medium, provided the original work is properly cited.
last 3 years(`15~`17). The average of the all stations was PM10 45 μg/㎥, PM2.5 24 μg/㎥ and Ratio 0.54, and annual reduction rates were PM10 -2.9%, PM2.5 –2.7% and Ratio –1.2%, respectively. The seasonal characteristics of PM10 were spring 54 μg/㎥ > winter 48 μg/㎥ > summer/autumn 40 μg/㎥, PM2.5 were spring/winter 26 μg/㎥ > summer 23 > autumn 22 μg/㎥ and Ratio were summer 0.56
> winter 0.55 > autumn 0.54 > spring 0.51, respectively. The hourly characteristics of PM10 were 11 μg/㎥ higher than 09:00~12:00 at 03:00~06:00, PM2.5 were 6 μg/㎥ higher than 09:00~12:00 at 17:00~18:00 and Ratio were 0.07 higher than 04:00~06:00 at 19:00.
By site, the highest concentration of PM10 was YJ site 53 μg/㎥ and PM2.5 was HW site 28 μg/㎥. And Ratio at HD site showed the largest reduction from `15 0.62 to `17 0.52.
Key words : Gyeongnam air monitoring stations, PM10, PM2.5, PM2.5/PM10
active inter-regional or long-distance transportation.
Therefore, it is important to analyze temporal and spatial changes of the concentration ratio as well as the concentration characteristics in order to understand the behavior characteristics of PM
10and PM
2.5(Munir, 2017).
Recently, fine particles have been attracting much attention not only in the atmospheric environment but also in terms of health damage. Especially, major cities such as Seoul and Busan are using the measurement data of the air pollution monitoring network to determine the effect of the local air pollution policy and the improvement of air quality.
In Gyeongnam Province, the concentration of PM
10(45 μg/ ) and PM
2.5(25 μg/ ) in 2016 is similar or not significantly lower than the national average, Seoul and Busan(MoE, 2017). Nevertheless, there is little research on the characteristics of PM
10and PM
2.5in the region.
In this paper, at 11 air pollution monitoring stations where the PM
2.5is measuring in Gyeongnam area were collected PM
10and PM
2.5data for the last three years(`15~`17), and the temporal and spatial characteristics including the PM
2.5/PM
10concentration
ratio(Ratio) were analyzed.
2. Methodology
2.1. Air monitoring network in Gyeongnam
The air pollution monitoring network in Gyeongnam is shown in Fig. 1. As of the end of December 2017, there are a total of 25 monitoring stations in Gyeongnam, including 21 urban stations, 1 roadside station, and 3 suburban sites. Of these 11 urban stations, the PM
2.5measuring instrument has been installed since 2015 and measurement data are available. In 11 urban stations, the PM
2.5instrument has been installed and PM
2.5measurement data are available from 2015(MoE, 2018).
In this study, PM
10and PM
2.5data from the 11 urban stations were used. The eight sites such as the HW site(Hoewong-dong, Changwo) are located in the residential area, the GJ site(Gaeumjeong-dong, Changwo) and SD site(Sangdae-dong, Jinju) in the industrial area, and the HD site(Hadong-eup, Hadong) in the green area(KNHE, 2018).
2.2. Process PM
10and PM
2.5collection data
In this study, PM
10and PM
2.5data collected 26,304
Fig. 1. The location of air pollution monitoring stations in Gyeongnam, Korea, December 2017.final confirmed hourly concentration for the last 3 years(`15~`17) in 11 urban stations on Air Korea homepage(Air Korea, 2018). As shown in Table 1, the average 93% effective measurement data excluding the error data was used in this study.
The daily, monthly and annual average concentrations were calculated using the hourly data.
The average concentrations were used only when the effective measurement rate was over 75%. The average concentration of PM
10and PM
2.5was rounded off to the first decimal place(MoE, 2016).
The collected data were statistically processed using the IBM SPSS Statistics program(Ver. 21).
2.3. Status of Asian dust and high concentration dust alarm
The high concentration of PM appears mainly in the case of Asian dust and fine dust alarm.
The occurrence days of Asian dust in Gyeongnam was based on the Changwon weather station(155) and occurred for a total of 13 days in the last 3 years including 4 days in 2015, 5 days in 2016 and 3 days in 2017(KMA, 2018).
The days with PM
10concentration of more than 150 μg/ over 2 hours appeared for total 8 days in
the last 3 years including 3 days in 2015, 2 days in 2016 and 3 days in 2017. And the days with PM
2.5concentration of more than 90 μg/ over 2 hours appeared for total 8 days in the last 3 years including 8 days in 2015, 0 day in 2016 and 2017.
3. Results and discussion
3.1. Daily average change over the last three years In order to investigate the overall tendency of PM concentration in Gyeongnam during the last 3 years(`15~`17), the daily mean characteristics of PM
10, PM
2.5and Ratio(PM
2.5/PM
10) in 11 air monitoring stations are shown in Fig. 2.
The daily mean values for the last three years were PM
1045 μg/ , PM
2.524 μg/ and Ratio 0.54(0.19 ~ 0.71), respectively.
The daily average of 13 days of Asian dust phenomenon occurrence was PM
10130 μg/ , PM
2.537 μg/ and Ratio 0.32. The average of the PM
10alarm days for 8 days was PM
10126 μg/ , PM
2.540 μg/ and Ratio 0.35. And the average of the PM
2.5alarms issued for 8 days only in 2017 were PM
10101 μ g/ , PM
2.558 μg/ and Ratio 0.58, respectively.
On the other hand, in normal days except for Asian
11 SC Sacheon-eup, Sacheon residential 95.6% 97.8% 94.5%
dust phenomenon and PM alarm days were PM
1044 μ g/ , PM
2.524 μg/ and Ratio 0.54.
In general, characterization of PM is evaluated at an annual average concentration, but it is important to focus on the occurrence of high concentration from the viewpoint of harmfulness(Kim, 2005). The days of high concentrations of PM
10and PM
2.5exceeding the 24-hour average environmental standard decreased annually. The days when PM
10concentration exceeded 100 μg/ appeared `15 8 days, `16 7 days and `17 3 days. It also appeared mainly during the period from February to May and during the occurrence of Asian dust. Therefore, it was shown that the Asian dust phenomenon that appeared mainly
in spring had a great influence on the occurrence of high concentration of PM
10. The days when PM
2.5concentration exceeded 50 μg/ appeared a total 23 days such as `15 9 days, `16 10 days and `17 4 days.
When the new modified environmental standard PM
2.5of 35 μg/ was applied, it was a total 140 days such as `15 55 days, `16 51 days and `17 34 days.
Especially, the days of winter and spring were two times higher than those of summer and autumn.
The concentration ratio of PM
2.5in PM
10, Ratio is a key indicator of contribution of PM source. When this value is high, the contribution of secondary particles converted from gas to particles is high.
When it is low, the contribution of primary particles
Fig. 2. Daily variation of PM10, PM2.5 and PM2.5/PM10 for 11-site average in 3 years(`15~`17).such as soil particles and road fugitive dust is high(Querol et al., 2004; Jeong and Hwang, 2014;
Munir, 2017).
In the last three years, the Ratio has appeared in a very wide range between 0.19 and 0.71. By year, Ratio were `15 0.55(0.20~0.70), `16 0.54(0.26~0.71) and `17 0.53(0.19,~0.71). And seasonal variations were 0.56(0.31~0.70) in summer, 0.55(0.20~0.71) in winter, 0.54(0.27~0.70) in autumn and 0.51(0.19~
0.69) in spring.
3.2. Monthly and hourly change characteristics Fig. 3 shows average trends of PM
10, PM
2.5and Ratio in 11 air monitoring stations by monthly and time series for the last 3 years.
The monthly average concentration of PM
10was
the highest at March and May 55 μg/ , and the
lowest at September 35 μg/ . The seasonal
characteristics of PM
10were in order of 54 μg/ in
spring, 48 μg/ in winter, and 40 μg/ in summer
and autumn. The monthly average concentration of
PM
2.5was the highest at 29 μg/ in March, and the
lowest at 20 μg/ in from September to October. The
seasonal characteristics of PM
2.5were in order of 26
μg/ in spring and winter, 23 μg/ in summer and
22 μg/ in autumn. The monthly average of Ratio
was the highest at June 0.58, and the lowest at April
0.47. The seasonal characteristics of Ratio were in
order of 0.56 in summer, 0.55 in winter, 0.54 in
autumn and 0.51 in spring. In particular, the monthly
maximum concentration difference was 20 μg/ for
PM
10, 8 μg/ for PM
2.5and 0.10 for Ratio,
Fig. 3. Monthly and hourly variation of PM10, PM2.5 and Ratio(PM2.5/PM10) for 11-site average in 3 years(`15~`17).respectively.
The hourly average concentration of PM
10was the highest 50~52 μg/ at 09:00~12:00 and the lowest 41~42 μg/ at 03:00~06:00. And 24-hour maximum concentration difference was 11 μg/ . The concentration of PM
2.5was the highest 27~28 μg/
at 09:00~12:00 and the lowest 22 μg/ at 17:00~18:00. And 24-hour maximum concentration difference was 6 μg/ . Ratio was the highest 0.57 at 04:00~06:00 and the lowest 0.50 at 19:00. And 24-hour maximum Ratio difference was 0.07.
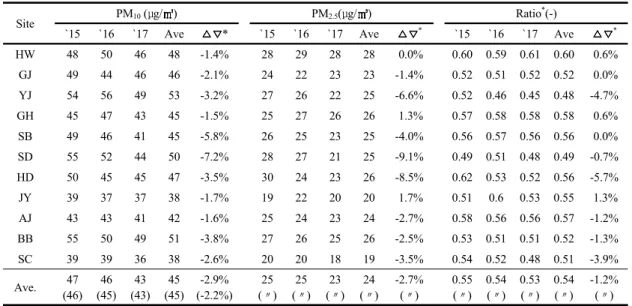
3.3. Characteristics of 11 monitoring sites Table 2 shows the annual average trends of PM
10, PM
2.5and Ratio for the last 3 years(`15~`17) for 11 sites.
Overall, the average concentration of PM
10at all sites decreased from `15 47 μg/ to `17 43 μg/ , and 4 μg/ during the last 3 years and -2.9% per year. The concentration of PM
2.5decreased from `15 25 μg/ to `17 23 μg/ , and 2 μg/ during the last 3 years and -2.7% per year. The concentration of PM
2.5decreased from `15 25 μg/ to `17 23 μg/ ,
and 2 μg/ during the last 3 years and -2.7% per year. For Ratio decreased from `15 0.55 to `17 0.53, and 0.02 in the last 3 years and -1.2% per year.
By site, the PM
10concentration at YJ site was 53 μ g/ , and higher 8 μg/ than the average. And the PM
2.5concentration at HW site was 28 μg/ , higher 4 μg/ than the average. On the other hand, the SC site had PM
1038 μg/ , and lower 7 μg/ than the average and PM
2.519 μg/ , and lower 5 μg/ than the average. On the other hand, the SC site was the lowest concentration of PM
1038 μg/ and PM
2.519 μ g/ . In the case of the SD site located in the industrial area, the PM
10concentration decreased from `15 55 μg/ to `17 44 μg/ and PM
2.5concentration decreased from `15 28 μg/ to `17 21 μg/ . The SD site was the high decreasing tendency among 11 sites.
The Ratio by site was in the order of HW site 0.60
> GH site 0.58 > AJ site 0.57 > SB site 0.56 > JY and HD site 0.55> BB site 0.52> GJ and SC site 0.51 >
SD site 0.49 > YJ site 0.47.
In particular, HD site showed the largest reduction
Site PM10 (μg/ ) PM2.5(μg/ ) Ratio*(-)
`15 `16 `17 Ave * `15 `16 `17 Ave * `15 `16 `17 Ave *
HW 48 50 46 48 -1.4% 28 29 28 28 0.0% 0.60 0.59 0.61 0.60 0.6%
GJ 49 44 46 46 -2.1% 24 22 23 23 -1.4% 0.52 0.51 0.52 0.52 0.0%
YJ 54 56 49 53 -3.2% 27 26 22 25 -6.6% 0.52 0.46 0.45 0.48 -4.7%
GH 45 47 43 45 -1.5% 25 27 26 26 1.3% 0.57 0.58 0.58 0.58 0.6%
SB 49 46 41 45 -5.8% 26 25 23 25 -4.0% 0.56 0.57 0.56 0.56 0.0%
SD 55 52 44 50 -7.2% 28 27 21 25 -9.1% 0.49 0.51 0.48 0.49 -0.7%
HD 50 45 45 47 -3.5% 30 24 23 26 -8.5% 0.62 0.53 0.52 0.56 -5.7%
JY 39 37 37 38 -1.7% 19 22 20 20 1.7% 0.51 0.6 0.53 0.55 1.3%
AJ 43 43 41 42 -1.6% 25 24 23 24 -2.7% 0.58 0.56 0.56 0.57 -1.2%
BB 55 50 49 51 -3.8% 27 26 25 26 -2.5% 0.53 0.51 0.51 0.52 -1.3%
SC 39 39 36 38 -2.6% 20 20 18 19 -3.5% 0.54 0.52 0.48 0.51 -3.9%
Ave. 47
(46) 46 (45)
43 (43)
45 (45)
-2.9%
(-2.2%) 25 (〃)
25 (〃)
23 (〃)
24 (〃)
-2.7%
(〃)
0.55 (〃)
0.54 (〃)
0.53 (〃)
0.54 (〃)
-1.2%
(〃) Ratio* : PM2.5/PM10, * : Annual increase / decrease rate, ( ) : Non-Asian dust
Table 2. Changes over the last three year of PM10, PM2.5and Ratio in the 11 sites