수종의 임플랜트 시스템의 나사풀림에 관한 연구
단국대학교 치과대학 보철학교실
안진수 조인호 임주환 임헌송․ ․ ․
Screw Loosening of Various Implant Systems
Jin-Soo Ahn, In-Ho Cho, Ju-Hwan Lim, Heon-Song Lim
Department of Prosthodontics College of Dentistry, Dankook University
Dental implant systems have shown many post-surgical problems and One of the most frequent problem is screw loosening. To reduce screw loosening, a number of methods have been tried and recently fundamental modification of fixture-abutment connection structure was developed and used the most frequently. Former implant system structure, such as Brånemark, had external hex with the height of 0.7 mm and later, fixture with external hex of 1.0 mm height and internal hex structure were developed. In addition, the method of morse taper application was introduced to reduce screw loosening.
In this study, the level of screw loosening of each implant systems was compared based on the vibration loosening measurement of abutment screw of each implant systems.
Analysis of measured value was performed using 3 kinds of methods, (i) Percentage of average of initial 3 times loosening-torque value(initial loosening value) to tightening-torque of 30 Ncm, (ii) Percentage of loosening-torque value after 200 N strength loaded(experimental value) to initial loosening value and (iii) Percentage of experimental value to 30 Ncm of tightening-torque. Each result of analyses shows the value of initial loosening, loosening by repetitive load and final loosening level.
The results of this study were as follows.
(1) Percentage of initial loosening value to tightening-torque was increased in order of 0.7 mm external hex, 1.0 mm external hex, internal hex and internal taper and all values between each groups showed statistical significance (p<
0.05).
(2) Percentage of experimental value to initial loosening value was increased in order of internal hex, 0.7 mm external hex, 1.0 mm external hex and internal taper. Value of internal taper showed significant difference with that of 0.7 mm external hex and internal hex (p<0.05).
(3) Percentage of experimental value to tightening torque was increased in order of 0.7 mm external hex, 1.0 mm external hex, internal hex and internal taper. Values of all groups showed statistical significance (p<0.05) except between the groups of 1.0 mm external hex and internal hex.
Based on those results, there was no significant difference of loosening-torque by repetitive loading except internal taper.
It is supposed that implant system with high resistant capability against initial loosening could be recommended for clinical use. In addition, in case of single implant restoration, 1.0 mm external hex or internal hex could be recommended rather than 0.7 mm external hex, and the use of internal taper would be the most useful way to reduce screw loosening.
Ⅰ 서. 론
치아의 상실로 인한 결손 부위에 저작기능 및 심 미성의 회복을 위하여 행해지는 보철치료 방법은 고정성 및 가철성 국소의치 총의치 임플랜트보철, , 등이 있다.
임플랜트는 1952년Brånemark1)에 의해 골유착 개 념이 도입된 이래 점차 사용이 증가추세에 있는 치 료방법이다 성공적인 임플랜트는 골유착이 필수적. 이며 최근에는 이러한 임플랜트가 장기적으로 사, 용되기 위한 상부 보철물의 생역학적인 고려가 강 조되고 있다.2,3,4,)
치과 임플랜트의 보편적인 문제점의 하나는 임플 랜트와 보철물을 연결하는 지대나사의 풀림현상 (screw loosening)이다.5,6,7,8,9,10,11,12,13,14,15) 특히 구치부 단일치아 수복에 있어서는 자주 접하게 되는 문제 점이다 이러한 나사풀림의 원인으로는 부적절한. 임플랜트의 위치 부적절한 교합 형태와 치관의 외, 형,13) screw stretch,16 개인에 따른 조임력의 차이,17) 등이 있고 나사풀림으로 나 long cantilever contact ,
사에 외력이 가해지면 preload를 상실하고 나사 장 력이 감소한다 이로 인하여 주변 조직에 위해 작용. 을 가져올 수 있고 나사의 파절 등으로 인해 골유착 에 좋지 않은 영향을 줄 수도 있는데 이러한 현상은 특히 구치부 단일 임플랜트에서 잘 발생한다.14)
Bickford18)는 나사 풀림 현상을 단기간 풀림과 장 기간 풀림의 두가지 형태로 분류하였다 단기간 풀. 림은 나사를 조인 뒤 발생되는 초기 현상으로 접촉 부위가 소성변형에 의해 편평하게 되는 surface
과 나사의 소성 변형에 의한
settling screw
등에 의해 주로 발생된다 장기간 풀림
lengthening .
은 오랜기간에 걸쳐 일어나는 현상으로 조임 현상 이 진동에너지를 흡수하여 임계점에 이르면 급격히 풀리는 vibration loosening과 시간 및 하중에 의해 발생되는 creep과 유사한 개념의 stress relaxation이 있다 이 중 후자의 영향은 크지 않다. . Vibration 은 장기간 풀림의 가장 보편적인 형태지만 loosening
아직 확실한 기준은 확립되어 있지 않으며 다만 축, 력보다는 수평력이 인장력보다는 전단력이 더 많, 은 영향을 준다고 알려져 있다.5,7)
나사 풀림 정도를 측정하는 방법은 크게 세 종류 가 있다. 첫째로 풀림 회전력이나 조임회전력 을 측정하는 방 (breaking way or restarting torque)
법,5,7) 둘째로 나사의 초기 길이와 풀림 후 길이의 비교로 전하중(preload)을 측정하는 방법인 나사 신 장 측정(screw elongation measurement)6)이 있고 셋, 째로ultrasonic extensometer를 이용 작은 외력을 적, 용하여 전하중을 측정하는 방법이 있다 이 중 풀림. 회전력이나 조임회전력을 측정하는 방법은 torque 를 이용하여 간단히 측정할 수 있는 방법이지 gauge
만 윤활제 유무나 온도 또는 부식(corrosion) 등에 의해 결과가 왜곡되기도 한다.7)
이러한 나사 풀림 현상을 방지하는 방법은 여러 가지가 있는데,19) 보철물의 정확한 접촉에 의한 수 동적 적합성을 이용하는 방법,20) 보철물 접촉부위 에 저항형태를 형성하는 방법,21) 임플랜트의 수를 늘리고 교합을 조절하는 방법,13) torque control 를 이용하는 방법 등을 이용하는 공학 device , washer
적 방법,5,22) 나사구멍 내면에 유지형태를 만들고, 혹은 만들지 않고 재료로 봉쇄하는 방법,7,13,23,24)
을 이용하는 방법
surface settling ,5) 그리고 나사에 마 찰저항형태를 부여하는 방법25,26) 등이 있다.
수종의 임플랜트 시스템의 나사풀림에 관한 연구
단국대학교 치과대학 보철학교실
안진수 조인호 임주환 임헌송․ ․ ․
본 연구에서는 최근에 많은 제조사에서 시도하고 있는 고정체(fixture)와 지대주와의 연결형태를 변화 시키는 방법에 있어서의 효과를 알아보기 위하여 네 종류의 연결형태를 가지는 임플랜트를 이용하여 반복하중 후의 풀림회전력을 측정하여 형태에 따른 차이점이 있는지를 비교 분석하였다, .
Ⅱ 실험 재료 및 방법.
실험 재료 1.
임플랜트 시스템 (1)
본 실험에서는 현재 시판중인 임플랜트 시스템중 고정체와 지대주와의 연결형태가 다른 네 종류를 사용하였으며 각 시스템별 구성요소는 아래와 같, 다.
외측 육각 형태
1) (External hex type) 0.7mm hex height
①
Avana® fixture (Osstem Co., Ltd., Korea) Gold UCLA abutment
(Osstem Co., Ltd., Korea) Titanium screw (Osstem Co., Ltd., Korea)
1.0mm hex height
②
Biohorizons® fixture
(BioHorizons implant Systems Inc., U.S.A.) Gold UCLA abutment
(BioHorizons implant Systems Inc., U.S.A.) Titanium screw
(BioHorizons implant Systems Inc., U.S.A.)
내측 형태
2) (Internal type)
내측 육각 형태 (Internal hex type)
①
Paragon® Screw-ventTM fixture
(Paragon implant company, U.S.A.) Gold UCLA abutment
(Paragon implant company, U.S.A.) Titanium screw
(Paragon implant company, U.S.A.) 형태
Internal taper
②
3i® TG OsseotiteTM fixture
(Implant Innovations Inc., U.S.A.)
Cement-retained TG post abutment
(Implant Innovations Inc., U.S.A.)
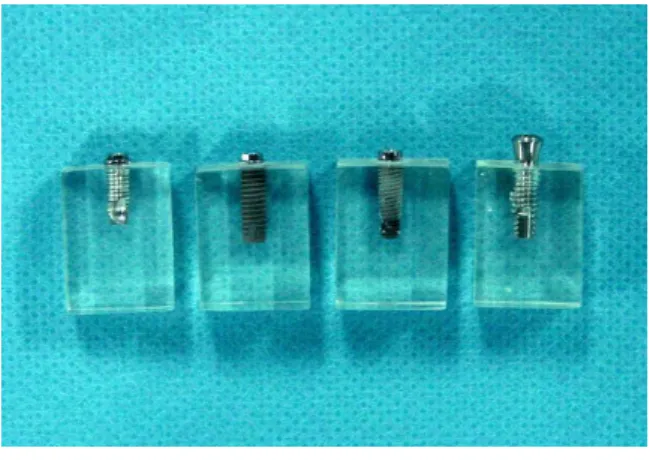
(2) Block
에 장착할 수 있도록 Loading machine 7×15×
의 에 각 제조사의 임플랜트 고정체 개
20mm mold 10
씩을 평면에 수직이 되도록 surveyor를 이용, clear resin(Jet acrylic, Lang Dental MFG. Co., Inc., U.S.A.) 으로 매몰하여 제작하였다(Fig. 1).
상부 보철물 (3)
금합금(Degudent® G, Degussa, Germany)을 이용, 상악 제1 대구치 형태로 고정체로부터 교합면까지 높이 10mm로 보철물을 형성하였다 이 때. TG 는 치은관통부를 고려하여 로 제작
OsseotiteTM 8mm
하고 임시합착재(Temp-Bond, Kerr®, U.S.A.)로 합착 하였다(Fig. 2, 3).
Fig. 1. Resin block
Fig. 2. Diagram of implant prosthesis (right: TG OsseotiteTM)
10mm 8mm
Fig. 3. Implant prosthesis
Fig. 4. Torque gauge (Tohnichi MFG. Co., LTD., Japan)
(4) Torque gauge (Tohnichi MFG. Co., LTD., Japan) 풀림 회전력을 측정하는 계측장치로서 최소, 0.05
에서 최대 까지 계측이 가능하
kgf cm․ 3.6 kgf cm․ 였다(Fig. 4).
(5) Loading machine (Instron 8871, Instron Corporation, U.S.A.)
만능역학시험기로 원하는 횟수만큼의 반복하중 을 가하였다(Fig. 5).
실험군의 분류 2.
실험군은 다음과 같이 그룹 은1 0.7mm 외측 육각 형태 그룹 는, 2 1.0mm 외측 육각 형태 그룹 은 내, 3 측 육각 형태 그리고 그룹 는, 4 internal taper 형태로 분류하였다(Table 1).
Fig. 5. Loading machine (Instron 8871, Instron Corporation, U.S.A.)
3. 실험방법
풀림토크 회 측정
(1) 3
의 토크로 나사를 조였으며 이 때 충분
30N cm․ ,
한 settling 과정을 부여하기 위해 나사는 회 조였3 다가 풀었으며,5,7,18) TG OsseotiteTM는 나사대신
를 이용하였다 abutment .
매 회 토크게이지를 이용하여 풀림토크를 측정하 였다.
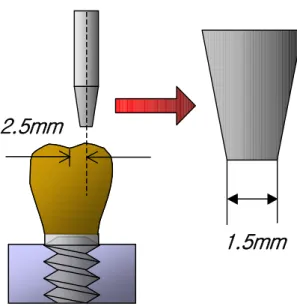
반복하중 적용 (2)
나사를 조이고 loading machine을 이용하여 중심 에서 2.5mm 떨어진 임의부위에 직경 1.5mm의
를 이용 최대 강도로 회의
stylus , 200N 5400 loading 을 가하였다(Fig. 6, 7).
Table 1. Classification of experimental groups Group Connection
type Loading Number of specimen
1 External
0.7mm hex
0
10 5400
2 External
1.0mm hex
0
10 5400
3 Internal
hex
0
10 5400
4 Internal
taper
0
10 5400
Fig. 6. Diagram of loading point and stylus
1.5mm 2.5mm
풀림토크의 측정 (3)
각 군별로 고정체 block과 나사를 바꾸어 실험을 하고 풀림토크를 측정하였고TG OsseotiteTM는 나 사대신 지대주(abutment)에 적용하였다(Fig. 8).
측정된 데이터는 아래와 같이 세 가지로 나누어 백분율로 분석하였다.
조임 토크 에 대한 회 측정한 풀림토 1) (30N cm)․ 3
크의 평균 초기풀림치 의 백분율( ) → 하중받기전 시스템별 초기풀림정도를 나타낸다.
초기풀림치에 대한 실험치 하중 적용후 풀림토
2) (
크 의 백분율) →순수히 반복하중에 의해 생긴 나 사풀림정도를 나타낸다.
조임 토크에 대한 실험치의 백분율 최종 나사
3) →
풀림정도를 나타낸다.
4. 통계처리
본 논문의 통계처리에는 SPSS ver. 10.0 for Win(SPSS Inc., U.S.A.)27)를 사용하였다.
각 측정값들이 정규분포를 이루는지 검사하기 위 하여 K-S test를 시행하였으며 각 군간의 유의성을, 조사하기 위하여 one-way ANOVA test, multiple
를 시행하였다 range test(Tukey`s test) .
Fig. 7. Loading point
Fig. 8. Measuring loosening torque
Ⅲ 실험 결과.
각 군의 나사 풀림 회전력 측정결과 1.
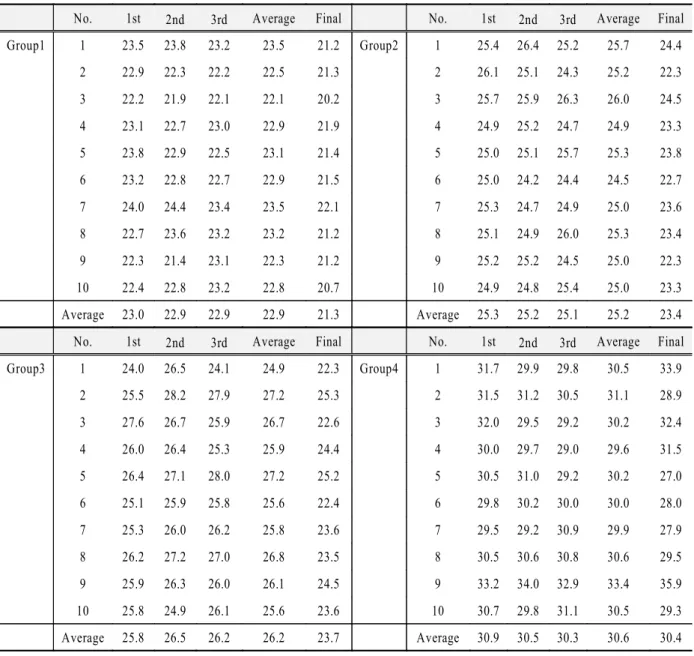
나사 풀림 회전력 측정결과는 다음의 Table 2와 같이 나왔다.
형태인 군이 가장 높은 값을 나타 Internal taper 4
냈으며, 1.0mm 외측 육각 형태인 군과 내측 육각2 형태인 군은 비슷한 값을3 , 0.7mm 외측 육각 형태 인 군은 상대적으로 낮은 값을 나타냈다1 .
분석방법에 따른 결과 2.
조임토크 에 대한 초기풀림치 백분율 (1) (30N cm)․
의 분석결과
본 실험에서 측정한 조임토크에 대한 초기풀림치
백분율의 평균과 표준편차는 다음의 Table 3과 같 이 나타났다. 1군(76.21)에서 군4 (101.01)으로 갈수 록 큰 값을 나타냈으며, Fig. 9는 측정결과의 그래프 이다.
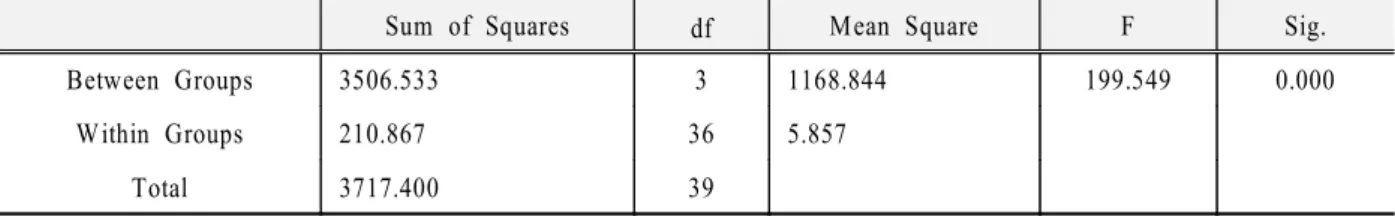
와 는 각 군간의 조임토크에 대한 초기풀 Table 4 5
림치 백분율의 one-way ANOVA와 multiple range 의 결과로서 백분율이 가장 큰 군은 군
test , 4 (102.01)
이었으며 모든 군간에 유의성있는 차이를 보였다, (p<0.05).
Table 3. Mean and standard deviation of Percentage of initial loosening value to tightening-torque (unit: %)
Group Mean SD
1 76.21 1.59
2 83.94 1.37
3 87.25 2.57
4 102.01 3.52
Group1 1 23.5 23.8 23.2 23.5 21.2 Group2 1 25.4 26.4 25.2 25.7 24.4
2 22.9 22.3 22.2 22.5 21.3 2 26.1 25.1 24.3 25.2 22.3
3 22.2 21.9 22.1 22.1 20.2 3 25.7 25.9 26.3 26.0 24.5
4 23.1 22.7 23.0 22.9 21.9 4 24.9 25.2 24.7 24.9 23.3
5 23.8 22.9 22.5 23.1 21.4 5 25.0 25.1 25.7 25.3 23.8
6 23.2 22.8 22.7 22.9 21.5 6 25.0 24.2 24.4 24.5 22.7
7 24.0 24.4 23.4 23.5 22.1 7 25.3 24.7 24.9 25.0 23.6
8 22.7 23.6 23.2 23.2 21.2 8 25.1 24.9 26.0 25.3 23.4
9 22.3 21.4 23.1 22.3 21.2 9 25.2 25.2 24.5 25.0 22.3
10 22.4 22.8 23.2 22.8 20.7 10 24.9 24.8 25.4 25.0 23.3
Average 23.0 22.9 22.9 22.9 21.3 Average 25.3 25.2 25.1 25.2 23.4
No. 1st 2nd 3rd Average Final No. 1st 2nd 3rd Average Final
Group3 1 24.0 26.5 24.1 24.9 22.3 Group4 1 31.7 29.9 29.8 30.5 33.9
2 25.5 28.2 27.9 27.2 25.3 2 31.5 31.2 30.5 31.1 28.9
3 27.6 26.7 25.9 26.7 22.6 3 32.0 29.5 29.2 30.2 32.4
4 26.0 26.4 25.3 25.9 24.4 4 30.0 29.7 29.0 29.6 31.5
5 26.4 27.1 28.0 27.2 25.2 5 30.5 31.0 29.2 30.2 27.0
6 25.1 25.9 25.8 25.6 22.4 6 29.8 30.2 30.0 30.0 28.0
7 25.3 26.0 26.2 25.8 23.6 7 29.5 29.2 30.9 29.9 27.9
8 26.2 27.2 27.0 26.8 23.5 8 30.5 30.6 30.8 30.6 29.5
9 25.9 26.3 26.0 26.1 24.5 9 33.2 34.0 32.9 33.4 35.9
10 25.8 24.9 26.1 25.6 23.6 10 30.7 29.8 31.1 30.5 29.3
Average 25.8 26.5 26.2 26.2 23.7 Average 30.9 30.5 30.3 30.6 30.4
Fig. 9. The mean value of Percentage of initial loosening value to tightening-torque
60 65 70 75 80 85 90 95 100 105
Group 1 Group 2 Group 3 Group 4
(unit: %)
Table 5. Results of multiple range test for Percentage of initial loosening value to tightening-torque
Group 1 2 3 4
1
2 *
3 * *
4 * * *
* : denotes pair of groups significantly different at the 0.05 level
초기풀림치에 대한 실험치 반복하중 후 측정치
(2) ( )
백분율의 분석결과
본 실험에서 측정한 초기풀림치에 대한 실험치 백분율의 평균과 표준편차는 다음의 Table 6과 같 이 나타났다. 3군(91.45)이 가장 낮은 값을 나타냈으 며 군4 (99.28)이 가장 큰 값을 나타내었다. Fig. 10은 측정결과의 그래프이다.
(unit: %)
Fig. 10. The mean value of Percentage of experimental value to initial loosening value
60 65 70 75 80 85 90 95 100
Group 1 Group 2 Group 3 Group 4
Table 6. Mean and standard deviation of Percen- tage of experimental value to initial loosening value (unit: %)
Group Mean SD
1 93.49 1.93
2 93.83 2.07
3 91.45 4.11
4 99.28 7.69
과 은 각 군간의 초기풀림치에 대한 실험 Table 7 8
치 백분율의 one-way ANOVA와 multiple range test 의 결과로서 백분율이 가장 큰 군은 군, 4 (99.28)이었 으며, 4군(99.28)이 군1 (93.49) 및 군3 (91.45)과 유의 성있는 차이를 보였다(p<0.05).
조임토크에 대한 실험치 반복하중 후 측정치
(3) ( )
백분율의 분석결과
본 실험에서 측정한 조임토크에 대한 실험치 백 Table 4. Results of one-way ANOVA test for Percentage of initial loosening value to tightening-torque
Sum of Squares df Mean Square F Sig.
Between Groups 3506.533 3 1168.844 199.549 0.000
W ithin Groups 210.867 36 5.857
Total 3717.400 39
Table 8. Results of multiple range test for Percentage of experimental value to initial loosening value
Group 1 2 3 4
1 2 3
4 * *
* : denotes pair of groups significantly different at the 0.05 level
Table 9. Mean and standard deviation of Percentage of experimental value to tightening torque (unit: %)
Group Mean SD
1 70.91 1.82
2 77.87 2.57
3 79.13 3.66
4 101.43 9.67
분율의 평균과 표준편차는 다음의 Table 9와 같이 나타났다. 1군(70.91)에서 4군(101.43)으로 갈수록 큰 값을 나타냈으며, Figure 11은 측정결과의 그래 프이다.
Table 10. Results of one-way ANOVA test for Percentage of experimental value to tightening torque
Sum of Squares df Mean Square F Sig.
Between Groups 5253.579 3 1751.193 59.982 0.000
Within Groups 1051.032 36 29.195
Total 6304.611 39
Table 11. Results of multiple range test for Per- centage of experimental value to tightening torque
Group 1 2 3 4
1
2 *
3 *
4 * * *
* : denotes pair of groups significantly different at the 0.05 level
(unit: %)
Fig. 11. The mean value of Percentage of experi- mental value to tightening torque
60 65 70 75 80 85 90 95 100 105
Group 1 Group 2 Group 3 Group 4
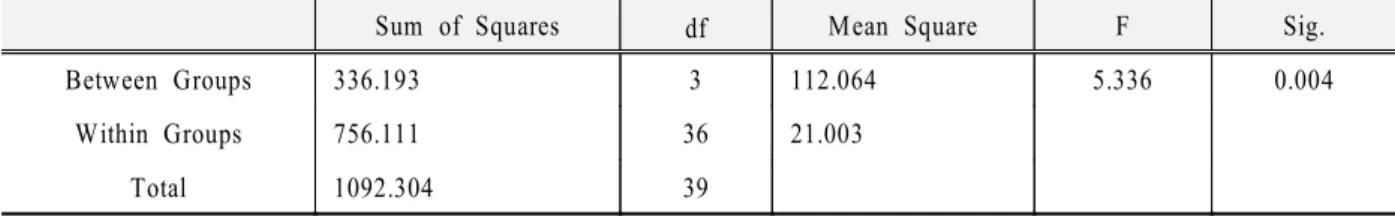
Between Groups 336.193 3 112.064 5.336 0.004
Within Groups 756.111 36 21.003
Total 1092.304 39
과 은 각 군간의 조임토크에 대한 실험 Table 10 11
치 백분율의 one-way ANOVA와 multiple range test 의 결과로서 백분율이 가장 큰 군은 군, 4 (101.43)이 었으며, 2군(77.87), 3군(79.13)간을 제외하고 모든 군간에 유의성있는 차이를 보였다(p<0.05).
Ⅳ 총괄 및 고안.
임플랜트 보철치료는 처음 사용되어진 이래 많은 발전을 거듭하여왔다 최근에는 완전 혹은 부분무. 치악은 물론 단일치아의 수복에도 많이 사용되고 있으며 전치부의 심미성 및 구치부의 기능성 등 만, 족스러운 결과를 위하여 많은 노력이 이루어져왔 다.
특히 구치부의 단일치아 수복에 있어서 성공률을 높이기 위한 상부 보철물의 생체역학적 고려는 필 수적이다.2,3,4) 그 중에서도 고정체와 상부보철물과 의 연결형태에 많은 관심이 주어졌으며 이는 나사, 풀림에 큰 영향을 미치는 요소가 된다.16)
초기의 임플랜트는 Brånemark 시스템으로 고정 체 상부에 0.7mm 높이의 외측 육각이 존재하는 형 태였다 이 형태는 현재까지도 널리 사용되고 있다. . 이외에 내측 육각 형태가 있는데 이것 역시 오랜, 기간 사용되어져 왔으며 사용이 증가추세에 있다, . 하지만 어느 쪽이 더 나은지는 논란의 여지로 남아 있다 초기. 0.7mm 높이의 외측 육각 형태의 연결부 위를 개선하여 1.0mm 높이의 육각을 가지는 시스 템들이 많은 제조사에 의해 등장하였다 이것 또한. 현재 많이 사용되고 있으며, 0.7mm 높이의 육각을 가지는 시스템보다 많은 장점을 가진다고 보고되고 있다.
지금까지 열거한 것들이 단순히 연결형태의 모양 을 변화시킨 것이라면 최근에 소개된 몇몇 시스템 들은 연결형태의 변화와 함께 나사의 근본적 역할 에 변화를 준 것이라 할 수 있으며 그 대표적인 것, 이 지대나사에 마찰저항형태를 부여하는 것이다.26) 마찰저항형태 중에서도 현재 널리 사용되는 형태가 형태로써 기존의 마찰저항형태가 없는 morse taper
시스템에 비해 나사풀림저항에 있어서 비약적 향상 을 이루게 되었다.25,28) 이러한 장점 때문에 단일 대 구치 수복에 있어서 사용이 추천되어왔다.
본 연구는 이러한 임플랜트 시스템들이 실제 임
상에서 얼마나 효과적이며 어떤 차이점이 있는지 알아보기 위해 시작하게 되었으며 실제 생체에서, 의 실험은 표준화의 어려움으로 실험실이라는 한, 계 내에서 가능한 한 신뢰할 수 있는 방법으로 실험 을 진행해 보고자 하였다.
우선적으로 구치부의 환경을 재현하고자 하였다.
인간의 최대교합력이 최소한 200N정도 된다고 널 리 받아들여지고 있고 임플랜트는 자연치에 비해, 가해지는 교합력이 적다는 것을 고려하여 최대 하 중은 200N으로 정하였다.5,7,29) 하중을 가하는 횟수 에 대해서는 실험이 나사풀림의 시스템별 비교이기 때문에 예비실험과 선현들의 연구를 참고하여 적절 한 횟수를 정하여 실험에 임하였다 힘이 가해지는. 위치 혹은 각도의 문제에 있어서 기존 연구들을 참 고했을 때 전치부의 경우 적절한 각도의, offset을 주기도 하지만 구치부에 가해지는 강한 저작력은 대부분 수직적이기 때문에 치아장축에 수직인 하중 을 가하도록 설정하였으며 다만 임플랜트 중앙에, 서 교두정까지의 거리로 cantilevering force가 가해 지도록 하였다 반복하중을 가하는 방법에 있어 지. 금까지 본인이 속한 교실에서 사용하던 loading 의 경우 모터의 회전을 이용하여 시편을 타 machine
격하는 방식이었으나 구치부에서 큰 저작력이 가, 해질 때의 교합양상을 살펴보았을 때에 부적절하다 고 사료되어 하중만 제어가 되는 만능역학실험기, 를 이용하여 stylus가 움직이지 않는 상태로 반복하 중이 가해지도록 하였다 물론. sine파형의 하중적용 으로 인해stylus와 시편은 미세하게 떨어지고 붙는 것을 반복하였다.
각각의 시스템은 나사의 풀림 정도에 있어서 고 유한 차이가 존재하기 때문에 실험결과의 분석은 앞서 설명한 것과 같이 세 가지로 나누게 되었다.24) 그렇게 함으로써 감소된 풀림토크 중 하중적용에 의한 것만을 비교할 수 있었다 하지만 임상적으로. 는 결국 최종적 나사풀림 저항이 중요하리라 사료 되어 최종적인 측정치도 통계 처리하게 되었다.
제조회사의 주장과는 달리 internal taper형태를 가 진 시스템을 제외하고는 하중에 의한 풀림토크의 저하는 유의한 차이가 없었다 물론 실험방법에 의. 하여 차이점을 발견하지 못한 것일 수도 있으나 다, 른 요인에 의한 차이와 비교해보았을 때 큰 차이점 은 아니었다.
나타났는데 원인을 보면 하중적용 후 풀림토크가, 오히려 증가한 시편이 존재하기 때문이었다 실험. 오차의 가능성을 고려하여 여러 번 반복실험을 하 였으나 그러한 양상이 계속 나타났으므로 추가실험 을 시행하게 되었다 즉. , stylus가 보철물에 하중을 가할 때 교두의 시계방향 사면에 닿아서 보철물에 시계반대방향 풀림작용을 하느냐 시계반대방향 사, 면에 닿아서 보철물에 시계방향으로 조임작용을 하 느냐로 나누어 실험해보았다 실험결과 시계방향. , 사면에 닿는 실험군에서 풀림토크의 저하가 크게 나타났다 이는 실험에 이용된. TG osseotiteTM의 특 성때문으로 보철물의 회전력이 곧바로 지대주나사, 에 전달되기 때문으로 해석될 수 있다 환언하면 실. 제 환자에게 이 시스템으로 보철 치료를 할 경우에 교합양상에 따라 나사풀림이 증가하거나 오히려 감 소될 수도 있다고 볼 수 있다 실제 임상에서 적용. 해보지는 않았으나 앞으로 실험해볼 가치가 있는 부분이라 사료된다.
마지막으로 이번 실험을 진행하면서 현재 사용되 고 있는 다양한 시스템들에 대한 비교연구가 중요 할 것으로 여겨졌으며 많은 연구자들에 의하여 속, 속 등장하는 여러 시스템들의 비교연구가 진행되면 큰 도움이 될 것이라 사료되는 바이다.
V. 결 론
수종의 임플랜트 시스템의 나사풀림을 비교하기 위해 0.7mm 외측 육각, 1.0mm 외측 육각 내측 육, 각, internal taper 형태의 임플랜트 시스템을 이용하 여 나사풀림에 관한 실험을 시행하였으며 다음과 같은 결론을 얻었다.
조임토크 에 대한 초기풀림치의 백분율은 1. (30Ncm)
외측 육각 외측 육
0.7mm (76.21±1.59%), 1.0mm
각(83.94±1.37%), 내측 육각(87.25±2.57%), 순으로 증가하였으 internal taper(102.01±3.52%)
며 모든 군간에 유의한 차이가 있었다, (p<0.05).
초기풀림치에 대한 실험치 백분율은 내측 육각 2.
외측 육각
(91.45±4.11%), 0.7mm (93.49±1.93%), 외측 육각
1.0mm (93.83±2.07%), internal taper
차이가 있었다(p<0.05).
조임토크 에 대한 실험치 백분율은
3. (30Ncm) 0.7
외측 육각 외측 육각
mm (70.91±1.82%), 1.0mm 내측 육각
(77.87±2.57%), (79.13±3.66%), internal 순으로 증가하였으며 taper(101.43±9.67%) , 외측 육각과 내측 육각간을 제외하고는 1.0mm
유의한 차이가 있었다(p<0.05).
이상의 결과로 볼 때 internal taper를 제외하고는 반복하중에 의한 풀림토크의 저하는 유의한 차이를 보이지 않았다.
임상적으로 임플랜트 시스템 선택시 초기풀림저 항이 큰 시스템을 선택하는 것이 좋으리라 사료되 며 단일 대구치 임플랜트 수복시에, 0.7mm 외측 육 각보다는 1.0mm 외측 육각이나 내측 육각의 사용 이 또 이들보다는, internal taper의 사용이 나사풀림 방지에 효과적일 것으로 사료된다.
참 고 문 헌
1. Brånemark PI. Osseointegration and its experimental background. J Prosthet Dent 1983;50:399-410
조인호 치과 임플랜트 시술에 관한 해외 최신 지견
2. .
대한치과의사협회지
(2). 1991;29:11-8
조인호 보철 수복 방법의 생체 역학적 분
3. . IMPLANT
석 대한치과의사협회지. 1993;31:438-43
4. Adell R, Lekholm U, Eriksson B, Brånemark PI, Jemt T.: A long term follow-up study of osseointegrated implants in the treatment of totally edentulous jaws. Int J Oral Maxillofac Implants 1990;5:347-59
강윤모 임주환 조인호 치과 임플랜트 지대나사의
5. , , .
풀림 현상에 관한 연구. 대한치과보철학회지
1996;34:1
이원주 임주환 조인호 조임 회전력에 따른 치과 임
6. , , .
플랜트지대나사의 응력에 관한 연구 대한치과보철.
학회지 1998;36:5
임재빈 임순호 조인호 임플랜트 보철물의 나사구멍
7. , , .
봉쇄방법이 지대나사 풀림에 미치는 영향에 관한 연 구 대한치과보철학회지. 1997;35:4
조수미 임주환 조인호 호환 가능한 임플랜트 보철
8. , , .
용 유지 나사들의 형태 비교와 풀림 회전력의 측정에 관한 연구 대한치과보철학회지. 1998;36:3
9. Binon PP.: The effect of implant/abutment hexagonal misfit on screw joint stability. Int J Prosthodont 1996;9:149-60
10. Jemt T, Laney WR, Harris D, Henry PJ, Krogh PH Jr, Polizzi G, Zarb GA, Herrmann I. Osseointegrated implants for single tooth replacement: a 1-year report from a multicenter prospective study. Int J Oral Maxillofac Implants 1991;6:29-36
11. Jemt T, Linden B, Lekholm U: Failures and complication in 127 consecutively placed fixed partial prostheses supported by Brånemark implants: From prosthetic treatment to first annual check up. Int J Oral Maxillofac Implants 1992;7:40-3
12. Kemppainen P, Eskola S, Ylipaavalniemi P. A comparative prospective clinical study of two single-tooth implants: A preliminary report of 102 implants. J Prosthet Dent 1997;77:382-7
13. Mcglumphy E. Keeping implant screws tight. J Prosthet Dent 1994;72:628-31
14. Misch CE. Contemporary Implant Dentistry. Mosby-Year Book, Inc., St. Louis 1993;669-83
15. Zarb GA, Schmitt A. The longitudinal clinical effectiveness of osseointegrated dental implants. The Toronto study. Part III: Problems and complications encountered. J Prosthet Dent 1990;64:185-94
16. Lazza RJ. Criteria for implant selection: surgical and prosthetic consideration. Pract Perio Aesthet Dent 1994;6:55-62
17. Wicks RA, de Rijk WG, Windler AS. An Evaluation of fit in osseointegrated implant components using torque/turn analysis. J Prosthodont 1994;3:206-10 18. Bickford JH. An introduction to the design and behavior
of bolted joints. New York: Marcel Dekker, Inc, 1981
정선모 한동철 공저 표준 기계설계학 신판 동명사
19. , . ( ), ;
1986. p. 42-9
20. Rangert BO, Jemt T, Jorneus L. Forces and moments on Brånemark implants. Int J Oral Maxillofac Implants 1989;4:241-7
21. Aboyoussef H, Weiner S, Ehrenberg D. Effect of an antirotation resistence form on screw loosening for single implant-supported crowns. J Prosthet Dent 2000;83:450-5
22. Korioth TWP, Cardoso AC, Versluis A. Effect of washers on reverse torque displacement of dental implant gold retaining screws. J Prosthet Dent 1999;82:312-6
23. Artzi Z, Dreiangel A. Securing the abutment post screw in a single implant prosthesis. J Prosthet Dent 1997;78:432-3
24. Binon PP. Evaluation of the effectiveness of a technique to prevent screw loosening. J Prosthet Dent 1998;79:430-2
25. Schwarz M. Mechanical complications of dental implants. Clin Oral Implants Res 2000;11:156-8 26. Weiss EI, Kozak D, Gross MD. Effect of repeated
closures on opening torque values in seven abutment-implant systems. J Prosthet Dent 2000;84:194-9
허만형 와 통계분석 교학사
27. . SPSS . ; 1995. p. 220
28. Norton MR. Assessment of cold welding properties of the internal conical interface of two commercially available implant systems. J Prosthet Dent 1999;81:159-66
29. Cibirka RM, Nelson SK, Lang BR, Rueggeberg FA.
Examination of the implant-abutment interface after fatigue testing. J Prosthet Dent 2001;85:268-75