DOI : 10.5394/KINPR.2011.35.4.323
Chlrorophylls and their Degradation Products using High Performance Liquid Chromatography (HPLC), with Data from Suspended and Sinking
Particulate Matter in Prydz Bay, Antarctica
Il Noh*
* Division of Marine Environment and Bioscience, Korea Maritime University, Busan 606-791, Republic of Korea
Abstract : Suspended and sinking particles were collected in austral summer during ODP Leg 119 to the Indian Ocean sector of the Antarctic Ocean. Field work was carried out at four sampling sites in Prydz Bay. Two of these sites were located in the Outer Bay, and two in the Inner Bay. At the four locations, a total of ten deployments of a sediment trap array were made. The concentrations of chlorophylls and their degradation products both in suspended and sinking particulate matter in Prydz Bay were analyzed using HPLC.
Chlorophylls a and c were the dominant algal pigments both in suspended and sinking particles. Because of the abundance of fecal pellets at Site 740, the mean fluxes at 200 m averaged 6 fold greater than that at 50 m. This implies that a dense swarm of zooplankters, presumably large copepods and/or salps, may "feed and excrete" mainly in between 100-200 m depths at this site, closest to land in Prydz Bay. Interestingly, The flux of phaeophorbide a was generally similar in magnitude to that of chlorophyll a throughout the study areas.
This is an evidence that materials escaping from near-surface regions in austral summer derive mainly from the gazing of zooplankters.
"New production" from sediment-trapped CHL pigment fluxes in Prydz Bay was estimated using f-ratio of 0.15, ranging from 520 to 1,605 μgC m-2 day-.1.
Key words : chlorophyll, chlorophyllide, phaeophorbide, sediment trap, HPLC, Prydz Bay, flux
* [email protected] 051)410-4327
1. Introduction
Despite intense interest among scientists from a variety of disciplines in the processes that drive the production, distribution and transport of particulate organic matter in the oceans, we still have but limited quantitative data on how much and what kind of biogenic particulate organic matter escapes from the surface waters of the Southern Ocean.
It is now generally agreed that the dominant mechanism for the vertical transport of organic matter into the deep sea is the relatively rapid settling of large particles (McCave, 1975), which recent studies have shown is dominated by marine snow, and other uncompacted aggregates, as well as by compact fecal pellets and fecal strings. Such particles are ubiquitous in the oceans (Silver et al., 1978; Shanks and Trent, 1979; Urrere and Knauer, 1981) and they are involved in many chemical and biological processes (Trent et al., 1978; Alldredge, 1979;
Rowe and Gardner, 197l; Deuser and Ross, 1980; Honjo, 1978; Brewer et al., 1980; Knauer et al., 1982; Karl et al., 1984). In general, the amount of organic material escaping
from the euphotic zone increases as a function of primary production (Eppley and Peterson, 1979), while particulate organic carbon (POC) residence times decrease (Eppley et al., 1983). Recently, a number of sediment trap studies have confirmed that a strong predictive relationship between primary production rates and the particle flux out of the euphotic zone exists for areas that are widely separated geographically (Suess, 1980; Deuser et al., 1981; Honjo, 1982; Noh, 1996, 2011). Consequently, there is a continuing need for accurate, direct measurements of the flux of particulate organic matter out of the euphotic zone, to see whether this has global predictive value, as we seek to more fully understand upper ocean biological processes.
The present research focused on the measurement of chlorophylls and their degradation products in suspended and sinking particles collected from Southern Ocean surface waters during austral summer 1987-1988. Participation in Ocean Drilling Program (ODP) Leg 119 allowed us to investigate short-term (day-to-day) variations in particle flux, and to see how these compared in different locations of the Indian Ocean sector of the Antarctic Ocean during the course of the same austral summer (Biggs et al., 1989).
Similar sediment trap sample collections had been obtained from the Weddell Sea during ODP Leg 113 in austral summer 1986-1987 (Biggs et al., 1988).
This study will report the pigment composition of suspended versus sinking particulate material. Our two data sets allow a more complete understanding of how pigment flux varies in response to local phytoplankton blooms, to proximity to ice edges, and to other environmental parameters that varied on a day-to-day scale at each of the sampling locations.
Both spatial and temporal variations of algal pigments in marine environments should correlate strongly with the physico-chemical variations in the upper water column, since phytoplankton abundance is regulated by nitrate flux, pycnocline location, and by vertical stability of water column (Steele, 1962; Parsons et al., 1981; Seliger et al., 1981; Marra et al., 1982). Important biological processes which in turn modify phytoplankton abundance are phytoplaIkton production, cellular senescence, cell sinking and zooplankton gazing (Bidigare et al., 1986; Welschmeyer and Lorenzen, 1985).
The Southern Ocean is characterized by high nutrient concentrations, marked seasonal variations in irradiance, low water temperatures, and comparatively little near-surface density stratification, which facilitates frequent mixing (El-Sayed, 1970; Holm-Hansen, 1985; Tilzer et al., 1986). Phytoplankton biomass and productivity in Antarctic waters are highly variable (El-Sayed, 1968; El-Sayed and Turner, 1977; Holm-Hansen et al., 1977; Fogg, 1977).
Previous Studies have shown that localized physical processes were the important factors in phytoplankton biomass accumulations in Southern Oceans (El-Sayed and Taguchi, 1981; Jennings et al., 1984; Marra and Boardman, 1984; Smith and Nelson, 1985). However, the specific factors controlling the distribution of Antarctic phytoplankton on broader spatial and temporal scales have not been fully resolved (Allanson et al., 1981; El-Sayedand Weber, 1982; Hayes et al., 1984).
Although it is well recognized that : 1) there is a positive functional relationship between primary production and the downward flux of particulate organic matter and 2) the degree of this relationship depends strongly on trophic interactions that take place in the euphotic zone (Eppley and Peterson, 1979), the amount of production that is recycled versus exported from surface waters of the Southern Ocean is still incompletely understood. In particular, detailed knowledge regarding the flux rates of photosynthetic pigments from the surface mixed layer and
the degree to which individual compounds are remineralized as a function of depth is an area of active research. (Biggs et al., 1989; Karl et al., 1988)
Because we now suspect that large particle production plays a central role in water column biogeochemistry, upper ocean sediment trap studies can serve to allow clearer insights into the time scales over which new production and sinking are coupled in Southern Ocean. Moreover, since such research integrates geochemical processes with biological processes, it represents a useful first step in unraveling the complex interplay of oceanographic factors which influence particulate transport and sedimentation in the Southern Ocean.
2. Materials and Methods
2.1 Field collections
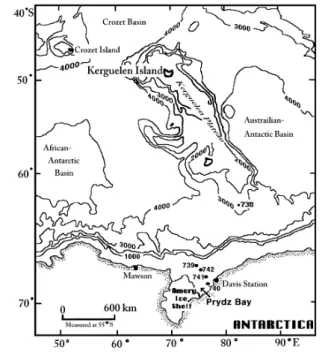
Suspended and sinking particles were collected in January-February 1988 during ODP Leg 119 to the Indian Ocean sector of the Antarctic Ocean (Fig. 1). Field work was carried out at four sampling sites in Prydz Bay. Two of these sites were located in the Outer Bay, and two in the Inner Bay. At the four locations, a total of ten deployments of a sediment trap array were made.
Fig. 1 Floating sediment traps (FSTs) were deployed in Outer Prydz Bay (Sites 739, 742) and Inner Prydz Bay (Sites 740, 741) during Ocean Drilling Program (ODP) Leg 119 in Jan-Feb 1988
2.2 Description of sediment traps
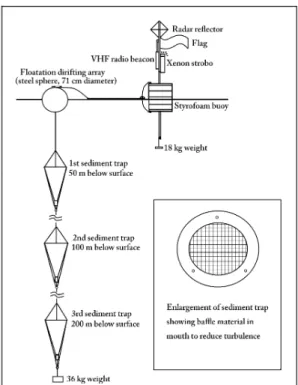
Sinking particulate matter was collected with conical sediment traps (Fig. 2) designed and fabricated by Dr. R. B.
Dunbar of Rice University (Dunbar, 1984). These traps were deployed on a drifting array which had three sediment traps suspended on braided nylon mooring line below a primary flotation sphere. To this sphere, a tracking buoy was tethered, which was outfitted with radio beacon, flashing strobe, radar reflector and flag. The radio beacon (Novatech, Model RF 700B), which broadcast at a VHF frequency of 156 MHz, could be tracked at least 6-7 miles away from the ship on channel 68 of a commercial RDF unit. After 20-37 hours, as weather allowed and/or depending on the drift rate of the arrays and the tending duties of the ice escort vessel, arrays were recovered and redeployed.
Dr. Dunbar’s sediment traps are similar to those built by Andy Soutar (Scripps Institution of Oceanography) and used in an intercalibration experiment in the Santa Barbara basin in 1979 (Dymond et al., 1981). Following that intercalibration experiment, the Soutar trap was chosen as the simplest, most reliable sediment trap for the collection of large samples. The funnelling effects of the conical geometry preconcentrates its sample, and this non-closing trap is easy to service and then redeploy.
Fig. 2 Floating sediment trap drift array used for Prydz Bay collections
Made of gel-coated fiberglass, Dunbar traps weigh only about 8 kilograms. Valved holes in the sides of the cone allow most of the water overlying the collection chamber to be drained off prior to hauling each trap on board, and with a simple manual block and tackle rig one can get a multiple trap array back aboard easily.
Dunbar traps have a collecting cross section of 1600 cm2. The baffle material used in the traps is an impregnated nylon honeycomb mesh with cells 1 cm wide by 4 cm deep.
Laboratory flume studies indicate that a baffle with these dimensions prevents the penetration of turbulent eddies into the trapping chamber (Dymond et al., 1981). This was confirmed on Leg 119, for material in the cod-end chamber was not visibly resuspended back into the cone, even when the trap was surging near surface during recoveries in seas of 1-2 meters.
2.3 Collection depths and sample processing The shallow trap collected sinking material at 50 m, close to the base of the mixed layer; the two additional traps collected from the upper pycnocline, at 100 m and at 200 m. Based on collections made during Leg 113 in the Weddell Sea, it was anticipated that drifting traps in Prydz Bay would intercept between 0.1 and 1 gm m-2 day-1.
Accordingly, it was planned that enough material would be trapped in 24 hours so that each collection could be split into fourths (or eighths) to give an archive aliquot, as well as 3 or more working aliquots for analysis of plant pigments and other substances. The archive aliquot was preserved in 4% buffered formaldehyde for analysis of particle morphology and for phytoplankton enumerization and taxonomy. The remaining aliquots were used for the analysis of the plant pigments and their degradation products: aliquots were filtered onto Nuclepore 0.4 μm polyester filters (47 mm). These filters were then frozen for post-cruise analysis.
2.4 Sampling with CTD and Niskin bottles
To determine the temperature-salinity and calculated density characteristics and depth of the mixed layer at each site where traps were deployed, the upper 200 m of the water column were profiled with an internal-recording Seabird SBE-19 ”Sea Cat” CTD (conductivity- temperature-depth) system. Light penetration was determined using a Secchi disc at each site where traps were deployed and the euphotic zone (EZ), a depth corresponding to 1% of light intensity at the surface, was obtained using the following formula (Evans et al., 1987).
EZ(m) = ln
x
Five-liter capacity Niskin bottles were used to collect water samples for analysis of suspended particles at six depths, generally 10, 30, 50, 75, 100 and 200 m.
2.5 Analysis of chlorophylls
For HPLC pigment analysis, filters frozen at sea were transported frozen on ”blue ice” in an insulated chest. The samples were processed 2-6 weeks after the cruise, at Texas A&M University, as follows; The filters were individually ground (glass/glass homogenizer) in 2 ml of 90% acetone, allowed to extract for 48 hours, and centrifuged to remove suspended particles. In order to separate the dephytolated pigments, ion-pairing solution was added to the sample prior to injection into the HPLC system (Mantoura and Llewellyn, 1983).
Following the methods of Bidigare et al. (1985), algal pigments were separated with an HPLC system consisting of two Varian Model 2510 isocratic pumps, Model 2584 static mixer and a sample injector (Rheodyne Model 7125, 500 μl sample loop). A reverse-phase Microsorb C18 column (10 cm bed L x 4.6 mm ID, 3 μm particle size, Rainin Co.) was used for the pigment analysis, fitted with a guard column (1.5 cm bed L x 4.6 mm ID, 3 μm particle size, Rainin Co.). A gradient solvent system (solvent A of 80:15:5 of methanol:distilled water:IP solution; solvent B of 100% methanol) was employed for the elution of algal pigments. Solvent delivery was programmed at 100%
solvent A for the initial condition, then a linear gradient to 100% solvent B at 2 min, followed by an isocratic hold (100% B) until phaeophytin a peak was eluted (36.5 min).
The flow rate was held constant at 1.2 ml/min.
The peaks of chlorophylls and their degradation products were quantified using a fluorescence detector (Waters Associates, Model 420), by exciting at 434 nm and measuring the emission at above 600 nm. The HPLC was calibrated according to the procedures outlined by Bidigare (1989) and American Public Health Association(1989).
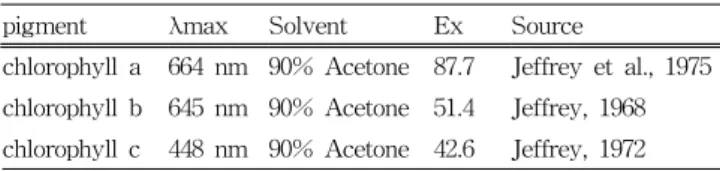
The extinction coefficients used to calculate concentrations by serial dilution are presented as Table 1.
Table 1 The extinction coefficients (Ex) (L g-1 cm-1) used for the calibration of pigment standards
pigment λmax Solvent Ex Source
chlorophyll a 664 nm 90% Acetone 87.7 Jeffrey et al., 1975 chlorophyll b 645 nm 90% Acetone 51.4 Jeffrey, 1968 chlorophyll c 448 nm 90% Acetone 42.6 Jeffrey, 1972
Chlorophyll a and chlorophyll b standards (Sigma Chemical Co.) were prepared in 90% acetone and calibrated spectrophotometrically (Jeffrey and Humphrey, 1975).
Phaeophytin a and phaeophytin b standards were prepared by the acidification of chlorophylls a and b with 1 N HCl, and concentrations were corrected for Mg++ loss (Strickland and Parsons, 1972). A chlorophyllide a standard was prepared from a dense culture of Skeletonema costatum that had reached stationary phase. This was extracted for 30 min in 50% acetone (Barrett and Jeffrey, 1971), and then purified by Thin Layer Chromatography (TLC) (Barrett and Jeffrey, 1971; Jeffrey, 1968, 1974, 1981) and then calibrated spectrophotometrically using serial dilution. A phaeophorbide a standard was prepared by the acidification of chlorophyllide a, purified by TLC, and then calibrated spectrophotometrically. Chlorophyll c was extracted from Sargassum weed from the Gulf of Mexico, purified by TLC (Barrett and Jeffrey, 1971), and calibrated spectrophotometrically in 90% acetone.
The following formula was used to calculate the individual pigment concentrations:
Ci= As x (1/R) x (1/IV) x (EV) x (1/SV) where, Ci = individual pigment concentration (ng per liter) As = area of individual pigment peaks computed by
Varian 4270 integrator
R = standard response factor (peak area divided by ng pigment per 0.5 ml standard)
IV = injection volume (0.5 ml) EV = extraction volume (in milliliters) SV = sample volume (in liters)
3. Results
3.1 Water column structure in Prydz Bay
Distribution of salinity (Practical Salinity Unit:PSU) and temperature (℃) measured in Prydz Bay are shown in Figure 3. Based on T/S curve similarities between Sites 739 and 742, we have grouped these as Outer Prydz Bay.
Similarly, we have grouped Sites 740 and 741 as Inner Prydz Bay. Note that temperature in the upper 200 m at both locations generally varied by only 3 ℃ (+1 ℃ to -2
℃) and salinity by only 1 PSU (33.5 to 34.5 PSU).
However, because temperatures in the upper 50 m of the Inner Bay ranged from 0 ℃ to +1.5 ℃, the near-surface water there was relatively warmer than that at Outer Bay sites. In addition, note that salinity in the Inner Bay generally ranged between 34.0 to 34.5 PSU, with little variation down to 200 m. Thus, Inner Bay sites were
relatively saltier throughout the upper 200 m than were Outer Bay sites, at which salinity in the upper 50 m reached as low as 33.7 PSU. These facts indicate that the sea ice had melted more recently at Outer Bay sites, which agrees with time-series satellite imagery of the ice cover in Prydz Bay (see Fig. 2 in Biggs et al., 1989). Thus, Inner Bay sites, which were ice-free longer than Outer Bay sites, had more time for upper waters to warm.
Fig. 3 Temperature and salinity structure of the upper 200 m of Outer and Inner Prydz Bay
3.2 Chlorophyll composition of suspended particulate matter
1) Inner vs. Outer Prydz Bay
Some general trends can best be seen when sampling sites are grouped into Inner Prydz Bay (740, 741) versus Outer Prydz Bay (739, 742).
While the vertical distribution of chlorophylls a and c showed basically the same pattern at Inner and Outer Prydz Bay sites, the marked difference in the average amount of chlorophyll a and c is readily seen in Figure 4A and 4B. Generally Inner Prydz Bay sites had about 3 times higher chlorophyll a concentration, and about 5 times higher chlorophyll c than Outer Bay sites. The vertical distribution patterns for degradation products of chlorophyll a at Inner and Outer Bay sites were basically similar as well, but again the Inner Bay sites averaged 3.7 and 3.5 times higher in average concentration of phaeophorbide a (Fig. 4C) and chlorophyllide a (Fig. 4D), respectively.
2) Integrated standing stock of chlorophylls in suspended matter
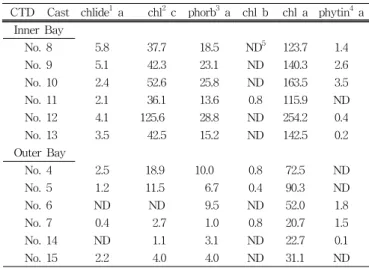
Table 2 summarize the integrated standing stocks of
pigments and their degradation products at Inner Bay sites 740 and 741 and at Outer bay sites 739 and 742, expressed as mg m-2. Note the dominance of chlorophyll a, chlorophyll c.
Fig. 4 A comparison of the average vertical distribution of chlorophylls at Inner versus Outer Prydz Bay sites
Table 2 Integrated standing stocks (mg m-2) of chlorophylls and their degradation products at Prydz Inner(Ii) and Outer(Oi) bay sites
CTD Cast chlide1 a chl2 c phorb3 a chl b chl a phytin4 a Inner Bay
No. 8 5.8 37.7 18.5 ND5 123.7 1.4
No. 9 5.1 42.3 23.1 ND 140.3 2.6
No. 10 2.4 52.6 25.8 ND 163.5 3.5
No. 11 2.1 36.1 13.6 0.8 115.9 ND
No. 12 4.1 125.6 28.8 ND 254.2 0.4
No. 13 3.5 42.5 15.2 ND 142.5 0.2
Outer Bay
No. 4 2.5 18.9 10.0 0.8 72.5 ND
No. 5 1.2 11.5 6.7 0.4 90.3 ND
No. 6 ND ND 9.5 ND 52.0 1.8
No. 7 0.4 2.7 1.0 0.8 20.7 1.5
No. 14 ND 1.1 3.1 ND 22.7 0.1
No. 15 2.2 4.0 4.0 ND 31.1 ND
1:chlorophyllide 2:chlorophyll 3:phaeophorbide 4:phaeophytin 5:Not detectable
This table shows that integrated standing stocks of pigment at Inner Bay sites were 2-9 times higher than those at Outer Bay sites. This ratio averaged 3.3 for chlorophyll a, 8.8 for chlorophyll c. The sole exceptions to this Ii 〉 Oi trend were chlorophyll b. Chlorophyll b was very rare at Inner Bay sites (only detected at 1 depth, and at only 1 of 6 casts).
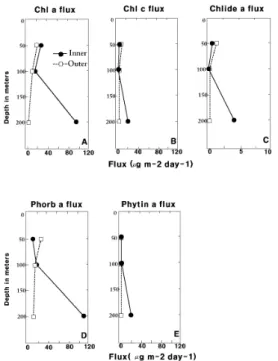
3.3 Chlorophyll composition of sinking particulate matter: Collections by floating sediment traps Because of the abundance of fecal pellets in the 200 m trap at Site 740, the mean flux pattern of chlorophylls (Fig.
5) in the Inner Bay was highest at 200 m for almost all the chlorophyll species. The mean flux of chlorophylls a and c at 200 m was at least 2-3 times higher than at 50 m or 100 m, and for the phaeopigments, the ratios of deepest layer flux to the shallowest exceeded 3:1. In contrast, the flux at 50 m for chlorophylls was generally similar or slightly higher than that at 100 m.
Fig. 5 Mean fluxes of chlorophylls in Inner Bay versus Outer Bay. Chlorophyll a degradation products are reported as chlorophyll a equivalent
4. Discussion
4.1 Chlorophyll distribution of the water column Temperature-salinity-density structure of the water column strongly influenced the vertical distributions of algal pigments in the study area. Specifically, when the mixed layer depth was shallow, it provided favorable conditions for the ambient phytoplankters to bloom.
At Outer Bay Site 739, a deep chlorophyll maximum (DCM) was located between 25-75 m (Fig. 6). In CTD casts #4-6 here, where the average mixed layer depth was only 15 m, the DCM was sharply defined. However, in CTD cast #7, where wind-mixing and/or horizontal
advection caused the mixed layer to extend down to 40 m, no distinct DCM was defined and chlorophyll a was distributed almost evenly from surface down to 100 m.
Fig. 6 Relationship between depth of Euphotic Zone (EZ), Mixed Layer (ML), and Deep Chlorophyll Maximum (DCM) in Prydz Bay at stations made on ODP Leg 119
At the other Outer Bay Site 742, the MLD extended to 35 m, on average. Here, there was no sharply defined DCM;
instead pigment concentrations generally were rather uniformly distributed from the surface down to 50 m. This may reflect recent mixing of the upper water by wind and/or horizontal advection and consequent dilution of the average algal pigment concentrations. At Inner Bay sites 740 and 741, where the mixed layer depth was only 15 m on the average, a DCM was well defined at 25-35 m.
Lesser wind-mixing and warmer near-surface temperatures here presumably provided enough water column stability and to allow phytoplankton to reach higher concentrations.
The base of the euphotic zone (EZ; estimated as the depth of penetration of 1% of surface irradiance) varied according to the vicinity to the continental land mass. The average EZ depth at the Outer Bay sites was 20 m, approximately twice that at Inner Bay sites, where it ranged from 9-12 m. It is well known that the availability of light with respect to depth is controlled by attenuation by detritus, phytoplankton, and dissolved substances.
However, the light which is attenuated by dissolved matter, which includes ”yellow substance”, is generally minimal in high productivity areas, where most of light is attenuated by the phytoplankton stocks themselves (Lorenzen, 1972, 1976). At the Inner Bay sites, as the phytoplankton bloom proceeded, it is probable that the self-shading effect of phytoplankton limited the depth of 1% light penetration to a rather uniform 9-12 m.
In summary, Inner Bay sites which had an EZ only half
as deep as Outer Bay sites (i. e. 10 m vs. 20 m) exhibited 4-5 fold higher phytoplankton stocks. However, regardless of regional location, the DCM generally remained below the depth of EZ and MLD. By comparing chlorophyll a concentrations in Prydz Bay with those measured during ODP Leg 113 (Biggs et al., 1988), it can be seen that surface chlorophyll a concentrations throughout much of the Weddell Sea in austral summer 1987 were less than 0.05 μg liter-1. That is, they were generally 1-2 orders of magnitude lower than that present in Prydz Bay in austral summer 1988. However, in austral summer 1987, the surface chlorophyll concentrations averaged double the regional mean at the two sites which were nearest the continental land mass. The investigators speculated that such inshore increase reflected neritic influence, and/or the fact that both of the sites where chlorophyll was highest had been more recently covered by pack ice than had the other sampling regions. The same factors should, of course, influence algal pigment concentrations within Prydz Bay. Because the surface chlorophyll in Prydz Bay was much higher in concentration at Outer as well as Inner Bay sites than that in the Weddell Sea (i.e. 0.2-0.5 μg liter-1 at Outer, and 1.5 μ g liter-1 at Inner Bay sites), it is an indication that Prydz Bay is more productive than most of the adjacent deep water. It is also likely that surface chlorophyll concentrations in Prydz Bay increased as austral summer continued, after our sampling there was ended.
In a bay of Anvers Island in the Antarctic Peninsula, Stephens (1989), who collected phytoplankton cells during November-December 1987, reported that the surface chlorophyll concentration there averaged 0.3 μg liter-1, or about the same concentration as that at Outer Prydz Bay sites. This was almost certainly before the onset of the bloom at Anvers Island, considering that these sampling sites were very close to shore, and occupied early in the austral summer.
Hayes et al. (1984) have reported that the near surface chlorophyll a concentrations around the Antarctic Peninsula, in the Drake Passage, and in the Scotia Sea and Weddell Sea during austral summer 1978-79 averaged 0.8, 0.3, 1.2 and 0.7 μg liter-1, respectively. The surface chlorophyll a concentrations of the inshore waters were consistently over 3 times higher than those in offshore waters measured from January to March. For example, in January, their inshore and offshore chlorophyll a concentrations averaged 2.5 and 0.8 μg liter-1, respectively. Such differences are similar in magnitude for Prydz Bay, although their distinction between the inshore and offshore (distinguished by 1000 meters
water depth in the former report) doesn’t apply within Prydz Bay, where Inner versus Outer regimes are distinguished by their geographical proximity to the continental land mass, and by different near-surface T/S conditions.
Marra and Boardman (1984) reported that near-surface chlorophyll concentrations ranged from 0.1 to 0.3 μg liter-1 in the Weddell Sea in October-November 1981. They found significant amounts of chlorophyll a close to the undersurface of the pack ice, which they suggested would be expected if an active biological community were living within the pack ice. They hypothesized that the availability of light, modulated through water column stratification, was the principal control for the distribution of phytoplankton biomass in the Weddell Sea in late austral winter.
In their investigation of the distribution of algal pigments in relation to temperature and optical variability in the Southern Ocean in January-February 1984, Bidigare et al.
(1986) correlated the highest chlorophyll a concentrations (〉0.8 μg liter-1) in the Weddell and Scotia Seas to local areas where thermal stratification was more pronounced.
Other previous Antarctic studies have also shown that increased water column stability helps maintain phytoplankton within the euphotic zone, thus promoting growth and subsequent biomass accumulation (El-Sayed and Taguchi, 1981; Smith and Nelson, l985).
In fact, Smith and Nelson (1985) reported that extremely high concentrations of chlorophyll a (〉 6 μg liter-1) were measured in the vicinity of a receding ice edge off the coast of Victoria Land in the Ross Sea in January and February 1983. These investigators concluded that enhanced vertical stability of the water column, produced by low salinity melt water, created favorable conditions for biomass accumulation. Specifically, chlorophyll concentrations ranged from 0.7 to 6.2 μg liter-1 in surface water, with 2.6 μg liter-1 as a local average. The investigators also suspected that the epontic algae (those associated with the pack ice) that were released from melting ice may have inoculated the bloom.
Chlorophyll c is the second most abundant of the chlorophyll pigments in diatoms, dinoflagellates and chrysophytes (Jeffrey, 1980), and chlorophyll c generally co-varies with chlorophyll a in its vertical distributional profile in marine environments (Bidigare et al., 1986).
Chlorophyll c:a ratios (mol:mol) for healthy diatoms in culture generally fall within the range of 0.2-0.4 (Jeffrey, 1972; Abaychi and Riley, 1979; Gallagher et al., 1984).
Similarly, chlorophyll c:a ratios (mol:mol) investigated by
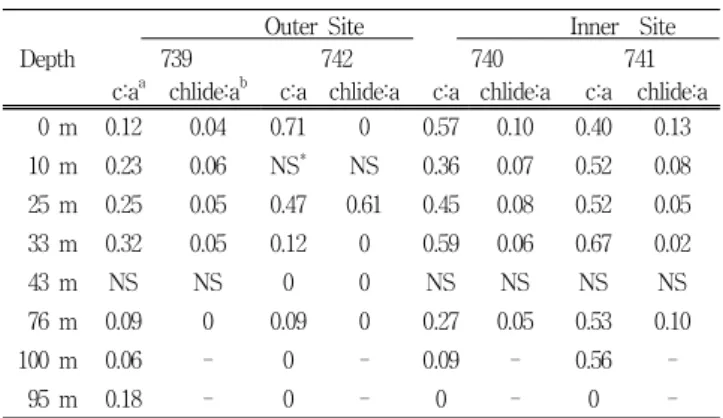
Bidigare et al. (1986) in the Weddell/Scotia Sea in austral summer 1984 averaged 0.23 ± 0.08. The ratio of chlorophyll c:a in Prydz Bay (Table 3) generally increased from the surface to the DCM, with the ratio at the DCM depth very similar to that (0.23 ± 0.08) reported by Bidigare et al.
(1986) from previous HPLC survey work in the Weddell/Scotia sea.
Table 3 Ratio of mean chlorophyll c:a (mol:mol) and mean chlorophyllide a to chlorophyll a (mol:mol) versus depth at each site in Prydz Bay
Depth
Outer Site Inner Site
739 742 740 741
c:aa chlide:ab c:a chlide:a c:a chlide:a c:a chlide:a
0 m 0.12 0.04 0.71 0 0.57 0.10 0.40 0.13
10 m 0.23 0.06 NS* NS 0.36 0.07 0.52 0.08
25 m 0.25 0.05 0.47 0.61 0.45 0.08 0.52 0.05
33 m 0.32 0.05 0.12 0 0.59 0.06 0.67 0.02
43 m NS NS 0 0 NS NS NS NS
76 m 0.09 0 0.09 0 0.27 0.05 0.53 0.10
100 m 0.06 - 0 - 0.09 - 0.56 -
95 m 0.18 - 0 - 0 - 0 -
a c:a denotes the ratio of chlorophyll c to chlorophyll a
b chlide:a denotes the ratio of chlorophyllide a to chlorophyll a
* Not sampled
Note that the ratio of mean chlorophyllide a to chlorophyll a in near-surface water of both the Outer and Inner Bay generally ranged from 0.04 to 0.13 (mol:mol) except at Site 742, where chlorophyllide a was not detected below 25 m (Table 3). At 25 m at Site 742, the ratio of chlorophyllide to chlorophyll a (0.61) was markedly higher than at other depths and sites. This anomalous ratio may reflect either a local accumulation of unhealthy cells around 25 m, or it may be an experimental artifact of filtration. For example, the chlorophyllase activity is enhanced when phytoplankton cell membranes are damaged (Jefrrey, 1974).
By comparison, while the ratio of chlorophyllide a to chlorophyll a in the Weddell/Scotia Sea reported by Bidigare et al. (1986) was 0.09 ± 0.06 (mol:mol), approximately two times higher than the general ratio in this study.
In Prydz Bay, the vertical distribution of phaeophorbide a co-varied with that of chlorophyll a at most of the sampling sites in both the Inner and Outer Bay. This supports the observation of Bidigare et al. (1986) that chlorophyll a and phaeophorbide a concentrations in the upper 200 m in the Weddell/Scotia Sea displayed a positive linear relationship, and it indicates that a tight coupling
probably exists between phytoplankton production and zooplankton grazing. Indirect evidence for a high degree of coupling was reported by El-Sayed and Taguchi (1981) for the Weddell Sea ice edge, as well as by Weber and El-Sayed (1985), who reported a positive correlation between krill density and the net chlorophyll standing stock in the Indian sector of the Southern Ocean. Nevertheless, it is important to emphasize that the concentrations of phaeophorbide a were about an order of magnitude lower than that of chlorophyll a in suspended material at both Inner and Outer Bay sites.
Phaeophytin a was rarely detected in suspended material in Prydz Bay, and it was by far the least common chlorophyll a degradation product throughout the study area. Similarly, Bidigare et al. (1986) detected phaeophytin pigments in only ∼1% of a total of 533 samples they analyzed in the Weddell/Scotia Sea.
Chlorophyll b, a chemotaxonomic marker of green algae which allows enhanced light absorption in the blue region of the visible light spectrum, was also below detection limit in most of the Prydz Bay samples. This indicates that green algae were not an important phytoplankton component in the study area. Where chlorophyll b was detected (CTD casts #4 and 5 in Outer Bay as well as over the Kerguelen Plateau in CTD casts #16 and 17), its concentrations ranged from 0.01-0.08 μg liter-1. This implies that chlorophyll b distribution might be an indicator of oceanic rather than neritic conditions in the Southern Ocean.
In summary, Inner Bay sites had 3-5 times greater concentrations of suspended algal pigments than at Outer Bay sites. Locally greater water column stability imparted by the local temperature-salinity-density structure was probably the main factor responsible for the bloom conditions within Inner Prydz Bay.
4.2 Chlorophylls in material sinking out of Prydz Bay
The pigment fluxes at the Outer Prydz Bay sites were generally similar to those trapped during Leg 113 (Biggs et al., 1988).
Interestingly, the fluxes at 50 m and 100 m were not markedly greater at Inner versus Outer Bay sites, even though the mean concentration of suspended algal pigments in Inner Prydz Bay was 3 times higher than that in the Outer Bay. In general, for Leg 113 as well as at most of the Leg 119 sites, the particle flux was greater at 50 m than at 200 m. For instance, at Leg 119 Sites 739 and 742, the pigment fluxes at 100 m were 40-60% of at 50 m, and
the pigment fluxes at 200 m were 20-30% of those at 50 m.
This presumably reflects both the higher primary production rates in the shallower depth strata, as well as the increasing importance of remineralization between 50-100 m, and between 100-200 m. At Inner Bay Site 741 the flux pattern was similar, with flux greatest at 50 m, intermediate at 100 m, and lowest at 200 m.
However, because of the abundance of fecal pellets at Site 740 on Leg 119, the mean fluxes at 200 m for Leg 119 averaged 6 fold greater than that at 50 m, and an order of magnitude higher than those of Leg 113. This implies that a dense swarm of zooplankters, presumably large copepods and salps, might "feed and excrete" mainly in between 100-200 m depths at this site closest to land in Prydz Bay.
Interestingly, The flux of phaeophorbide a was generally similar in magnitude to that of chlorophyll a throughout the Leg 113 as well as Leg 119 study areas. This is an additional evidence that materials escaping from near-surface regions in austral summer derive mainly from the gazing of zooplankters.
4.3 Inventories of suspended versus sinking materials
The pigment flux out of the upper 200 m, relative to the integrated standing stock (integrated standing stock in mg m-2 divided by the flux in μg m-2 day-1), ranged from 0.1-1.5% (average 0.3%) at Site 739 ; from 0. 1-0.6%
(average 0.3%) at Site 742; from 0.1-0.3% (average 0.1%) at Site 740 ; and from 0.1-0.3% (average 0.1%) at Site 741.
These data do not support my null hypothesis that particulate material in Prydz Bay was recycled rapidly. On the contrary, phytoplankton standing stocks appeared to be very healthy, so that the amount of material settling out of the euphotic zone was also negligible, compared to that produced daily by photosynthesis.
4.4 Estimation of ”New production” in the Southern Ocean from pigment fluxes
In an ideal steady-state system, the cycling of nutrients through a planktonic food web will continue indefinitely, with measurable phytoplankton standing stocks undergoing only minor stochastic variations. However, in the real ocean, there are bound to be net losses of nutrients from near-surface waters, such as the flux of sinking fecal materials and cast off exoskeletons out of the euphotic zone to deep water, or from fish catch and seabirds feeding in the ocean but depositing guano on land (Eppley and Peterson, 1979). Such nutrient losses must be replaced by external
inputs to prevent a decline in the productivity of the system.
Among the methods of renewal in the ocean there are the flux of nitrate from deep water, fixation of molecular nitrogen by free-living and symbiotic Cyanobacteria, and the nitrogen from terrestrial and atmospheric sources (Eppley and Peterson, 1979). This is so-called "new production"
(Dugdale and Goering, 1967). In theory, it can be exported from the system without its reducing its overall productivity, and it is this which drives both the fish catch and the downward flux of organic matter to bathypelagic and benthic food web. By corollary, if we measure this export as the sinking of particulate organic matter out of surface waters in the ocean, the exports (i.e. flux of particulate organic matter) is equal to ”new production” by the definition of Dugdale and Goering (1967).
Because the fluxes of algal pigments out of the surface waters of Southern Ocean have been measured in this present study, pigment fluxes can be converted to the total carbon flux to compare the "new production" with those in other investigations. A C:CHL weight ratio of 50 will be utilized for this comparison, which previous investigators have reported is a reasonable summary of carbon content to chlorophyll a in laboratory as well as field-collected Antarctic phytoplankton cells (Sakshaug and Holm-Hansen, 1984; Tilzer et al., 1985).
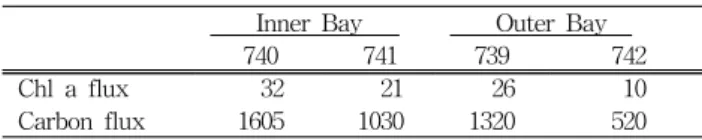
Table 4 presents the estimated carbon flux using a carbon to chlorophyll a weight ratio of 50. Because the depth of the 1% isolume of the euphotic zone was sha1lower than 50 m during the January-February sampling time in Prydz Bay, the flux of pigments at 50 m was used to estimate the "new production" there. Note that estimated "new production" in terms of carbon in Outer Prydz Bay averaged 0.9 ± 0.4 mg C m-2 d-1, which is not significant1y different that of Inner Prydz Bay (1.3 ± 0.3 mg C m-2 d-1). Knauer et al. (1990) reported that the f-ratio (the ratio of new production to total production) appeared to be inversely related to primary production. They obtained the lowest estimates (0.11-0.16) during periods of highest productivity. Thus, we can approximate the total carbon production from sediment-trapped CHL pigment f1uxes if we assume an average f-ratio of 0.15, and multiply "new production" by 6.7.
Table 4 The estimated "new production" in Prydz Bay Inner Bay Outer Bay
740 741 739 742
Chl a flux 32 21 26 10
Carbon flux 1605 1030 1320 520
* the units are expressed in μg m-2 d-1
5. Further Study
The remineralization processes both of the recycled and exported particles from surface waters of the Antarctic Ocean need to be elucidated in the future to fully understand the upper water column biogeochemistry. The methods in the present study may apply to all marine environments including small embayments. In case of bays and ports where ahthropological sources of particulate matter (e.g. from ballast water, etc.) add to the indigenous particulates, the amounts of the anthropological sources should be quantified and filtered out in order to unravel the complex interplay of the oceanographic factors in their own environments.
Reference
[1] Abaychi, J.K. and Riley, J.P.(1979), “The determination of phytoplankton pigments by high-performance liquid chromatography”, Anal. Chim. Acta, Vol 107, pp. 1~11.
[2] Allanson, B.R., Hart, R.C., and Lutjeharms, J.R.E.(1981),
"Observations on the nutrients, chlorophyll and primary production of the Southern Ocean south of Africa", South African J. Antarctic Res., Vol. 10/11, pp. 3~14.
[3] Alldredge, A.L.(1979), "The chemical composition of microscopic aggregates in two neritic seas", Limnol.
Oceanogr., Vol. 254, pp. 855~866.
[4] American Public Health Association.(1989), "High- performance liquid chromatographic determination of algal chlorophylls and their degradation products", pp.
1039. In: Standard Methods for the Examination of Water and Wastewater, 17th Edition, Washington, D.C.
[5] Barrett, J. and Jeffrey, S.W.(1971), "A note on the occurrence of chlorophyllase in marine algae", J. Exp.
Mar. Biol. Ecol., Vol. 7, pp. 255~262.
[6] Bidigare, R.R.(1989), "Photosynthetic pigment composition of the brown tide alga: Unique chlorophyll and carotenoid derivatives", pp. 57~75, In: Novel Phytoplankton Blooms (E Cosper, E. J. Carpenter and M. Bricelj, eds.), Coastal and Estuarine Studies, Vol.
35. Springer-Verlag, Berlin.
[7] Bidigare, R.R., Kennicutt, M.C., and Brooks, J.M.(1985),
"Rapid determination of chlorophylls and degradationproducts by high performance liquid chromatography", Limnol. Oceanogr., Vol. 30, pp. 432~
435.
[8] Bidigare, R.R., Frank, T.J., Zastrow C., and Brooks, J.M.(1986), "The distribution of algal chlorophylls and
their degradation products in the Southern Ocean", Deep-Sea Res., Vol. 33, pp. 923~937.
[9] Biggs, D.C., Berkowitz, S.P., Altabet, M.A., Bidigare, R.R, DeMaster, D.J, Dunbar, R.B., Leventer, A.N., Macko, S.A., Nittroluer, C.A., and Ondrusek, M.E.(1988), "Upper-ocean particulate fluxes in the Weddell Sea", Proc. ODP, Init. Repts., 113: pp. 77~86, College Stadon, TX (Ocean Drilling Program).
[10] Biggs, D.C., Berkowitz, S.P., Altabet, M.A., Bidigare, R.R., DeMaster, D.J., Macko, S.A., Ondrusek, M.E., and Noh, I.(1989), "Cooperative study of upper ocean particulate fluxes", Proc. ODP, Init. Repts., 119: pp. 10 9~120.
[11] Bogdanov, D.V., Sokolov, V.A., and Khromov, N.S.(1969), "Regions of high biological and commercial productivity in Gulf of Mexico and Caribbean Sea", Oceanology, Vol. 8, pp. 371~381.
[12] Brewer, P.G., Nozaki, Y., Spencer, D.W., and Fleer, A.P.(1980), "Sediment trap experiments in th edeep North Atlantic: isotopic and elemental f1uxes", J. Mar.
Res., Vol. 38, pp. 703~728.
[13] Deuser, W.G. and Ross, E.H.(1980), "Seasonal changes in the f1ux of organic carbon to the deep Sargasso Sea", Nature, Vol. 283, pp. 364~365.
[14] Deuser, W.G., Ross, E.H., and Anderson, R.F.(1981),
"Seasonality in the supply of sediment to the deep Sargasso Sea and implication for the rapid transfer of matter to the deep ocean", Deep-Sea Res., Vol. 28, pp.
495~505.
[15] Dugdale, R.C. and Goering, J.(1967). "Uptake of new and regenerated forms of nitrogen in primary productivity" Limnol. Oceanogr., Vol. 12, pp. 196~206.
[16] Dunbar, R.B.(1984). "Sediment trap experiments on the Antarctic continental margin", Antarctic J. U. S., Ann.
Rev. Iss., Vol. 19, pp. 70~71.
[17] Dymond, J., Fisher, K., Clauson, M., Cobler, R., Gardner, W., Berger, W., Richardson, M., Soutar, A., and Dunbar, R.(1981), "A sediment trap intercomparison study in the Santa Barbara basin", Earth Planet, Sci. Lett., Vol. 53, pp. 409~418.
[18] El-Sayed, S.Z.(1968), "Primary productivity of the Antarctic and subantarctic", pp. 119~135. In: Primary Productivity and Benthic Marine Algae of the Antarctic and Subantarctic. Antarctic Map Folio series, Folio 10.(V. Bushnell, ed.). American GeographicaI Society, New York.
[19] El-Sayed, S.Z.(1970), "On the productivity of the Southern Ocean (Atlantic and Pacific sectors)", pp. 11
9~135. In: Antarctic Ecology (A. Holdgate, ed.). Vol 1.
Academic Press, New York.
[20] El-Sayed, S.Z. and Turner, J.T.(1977), "Productivity of the Antarctic and tropical subtropical regions: A comparative study", pp. 463~504. In: Polar Oceans (M.J. Dunbar, ed.). Arctic Institute of North America, Calgary, Alberta, Canada.
[21] El-Sayed, S.Z. and Taguchi, S.(1981), "Primary production and standing crop of phytoplankton along the ice-edge in the Weddell Sea", Deep-Sea Res., Vol.
28A, No. 9, pp. 1017~1032.
[22] El-Sayed, S.Z. and Weber, L.H.(1982), "Spatial and primary productivity in the southwest Atlantic and the Scotia Sea", Polar Biol., Vol. 1, pp. 83~90.
[23] Eppley, R.W. and Peterson, B.J.(1979), "Particulate organic matter flux and planktonic new production in the deep ocean", Nature, 282, pp. 677~680.
[24] Eppley, R.W., Renger E.H., and Betzer P.R.(1983), "The residence time of particulate organic carbon in the surface layer of the ocean", Deep-Sea Res., Vol. 30, pp.
311~323.
[25] Evans, C. A., O’Reilly, J. E., and Thomas, J.P.(1987),
"A Handbook for the Measurement of Chlorophyll a and Primary Production", BIOMASS Scientific Series No. 8. 114pp, Texas A&M Univ., College Stadon, Texas.
[26] Fogg, G.E.(1977), "Aquatic primary production in the Antarctic", Phil. Trans R. Soc. Lond. Vol. B 279, pp. 27
~38.
[27] Gallagher, J.C., Wood, A.M., and Alberte, R.S.(1984),
"Ecotyptic differentiation in the marine diatom Skeletonema costatum: inf1uence of light intensity on the photosynthetic apparatus", Mar. Biol., Vol. 82, pp.
121~134.
[28] Hayes, P.K., Whitaker, T.M., and Fogg, G.E.(1984),
"The distribution and nutrient status of phytoplankton in the Southern Ocean between 20 and 70 °W", Polar Biol., Vol. 3, pp. 153~165.
[29] Holm-Hansen, O.(1985), "Nutrient cycles in Antarctic Marine Ecosystems", pp. 6~10. In: Antarctic Nutrient Cycles and Food Webs (W. R. Siegfried, P.R. Condy, and R. M. Laws, eds.). Springer-Verlag, Berlin.
[30] Holm-Hansen, O., El-Sayed, S.Z., Franceschini, G.A., and Cuhel, R.L.(1977), "Primary production and the factors controlling phytoplankton growth in Southern Ocean", pp. 11~50. In: Adaptations within Antarctic Ecosystems; Proceedings of the third SCAR Symposium on Antarctic Biology (G.A. Llano, ed.).
National Academy of Sciences, Washington, D.C.
[31] Honjo, S.(1978), "Sedimentation of materials in the Sargasso Sea at a 5367 m deep station", J. Mar. Res., Vol. 36, pp. 469~492.
[32] Honjo, S.(1982), "Seasonality and interaction of biogenic and lithogenic particulate flux at the Panama Basin", Science, Vol. 218, pp. 883~884
[33] Jeffrey, S.W.(1968), "Quantitative thin-layer chromatography of chlorophylls and carotenoids from marine algae", Biochim. Biophys. Acta, Vol 162, pp. 27 1~285.
[34] Jeffrey, S.W.(1972), "Preparation and some properties of crystalline chlorophyll c1 and c2 from marine algae", Biochim. Biophys. Acta, Vol. 279, pp. 15~33.
[35] Jeffrey, S.W.(1974), "Profiles of photosynthetic pigments in the ocean using thin-layer chromatography", Mar. Biol., Vol. 26, pp. 101~110.
[36] Jeffrey, S.W.(1981), "An improved thin-layer chromatographic technique for marine phytoplankton pigments", Limnol. Oceanogr., Vol. 16, pp. 191~197.
[37] Jeffrey, S.W. and Humphrey, G.F.(1975), "New spectrophotometric equations for determining chlorophylls a, b, c1 and c2 in higher plants, algae and natural phytoplankton", Biochemie und Physiologie der Pflanzen, Vol. 167, pp. 191~194.
[38] Jeffrey, S.W. and Hallegraeff, G.M.(1980), "Studies on phytoplankton species and photosynthetic pigments in a warm core eddy of the East Austrailian Current. I.
Summer populations", Mar. Ecol. Prog. Ser., Vol. 3, pp.
285~294.
[39] Jennings, J.C., Gordon, L.I., and Nelson, D.M.(1984),
"Nutrient depletion indicates high primary productivity in the Weddell Sea", Nature, Vol. 309, pp. 51~54 [40] Karl, D.M., Knauer, G.A., Martin, J.H., and Ward,
B.B.(1984), "Chemolithotrophic bacterial production in association with rapid sinking particles: Implication of oceanic carbon cycles and mesopelagic food webs", Nature, Vol. 309, pp. 54~56.
[41] Karl, D.M., G. A. Knauer, and Martin, J.H.(1988),
"Downward flux of particulate organic matter in the ocean:a particle decomposition paradox", Nature, Vol 332, pp. 438~441.
[42] Knauer, G.A., Hebel, D., and Cippriano, F.(1982),
"Marine snow: Major site of primary production in coa.stal waters", Nature, Vol. 300, pp. 630~631.
[43] Knauer, G.A., Redalje D.G., Harrison W.G. and Karl, D.M.(1990), "New production at the VERTEX time-series site", Deep-Sea Res., Vol. 37(7), pp. 1121~
1134
[44] Lorenzen, C.J.(1972), "Extinction of light in the ocean
by phytoplankton", J. Cons. Int. Explor. Mer., Vol. 34, pp. 262~267.
[45] Lorenzen, C.J.(1976), "Primary production in the sea", pp. 173~185. In: Ecology of the Seas (D. H. Cushing and J. J. Walsh, eds.). Blackwell Scientific Publications, Oxford.
[46] Mantoura, R.F. and Llewellyn, C.A.(1983), "The rapid determination of algal chlorophyll and carotenoid pigments and their breakdown products in natural waters by reverse-phase high-performance liquid chromatography", Anal. Chim. Acta, Vol. 151, pp. 297~
314.
[47] Marra, J., Houghton, R.W., Boardman, D.C., and Neale, P.J.(1982), "Variability in surface chlorophyll a at a shelf break front", J. Mar. Res., Vol. 40, pp. 575~591.
[48] McCave, I. N.(1975), "Vertical flux of particles in the ocean", Deep-Sea Res., Vol. 22, pp. 491~502.
[49] Noh. I.(1996), "Algal pigments and their degradation products in suspended and sinking particulate material in the Gulf of Mexico", Journal of the Korean Environmental Sciences Society, Vol. 5(2), pp 153~170.
[50] Noh, I.(2011 in press), "Carotenoid pigments from suspended and sinking particulate matter in Prydz Bay, Antarctica", Journal of the Korean Environmental Sciences Society.
[51] Parsons, T.R., Stronach, J., Borstad, G.A., Louttit, G., and Petty, R.I.(1981), "Biological fronts in the Strait of Georgia, British Colombia", Mar. Ecol. Prog. Ser., Vol.
6, pp. 237~242.
[52] Rowe, G.T. and Gardner, W.D.(1979), "Sedimentation rates in the slope water of the northwest Atlantic Ocean measured directly with sediment traps", J. Mar.
Res., Vol. 37, pp. 581~600.
[53] Sakshaug, E. and Holm-Hansen, O.(1984), "Factors governing pelagic production in po1ar oceans", pp. 1~
17. In: Marine Phytoplankton and Productivity (L. Bolis and R. Gilles, eds.). Springer-Verlag, Berlin
[54] Seliger, H.H., McKinley, K.R., Biggley,, W.H., Rivkin, R.B., and Aspden, K.R.H.(1981), "Phytoplankton patchiness and frontal regions", Mar. Biol., Vol. 61, pp.
119~131.
[55] Shanks, A.L. and Trent, J.D.(1979), "Marine Snow:
Microscale nutrient patches", Limnol. Oceanogr., Vol.
24, pp. 850~854.
[56] Silver, M.W., Shanks, A.L., and Trent, J.D.(1978),
"Marine snow: microplankton habitat and sources of small-scale patchiness in pelagic populations", Science, Vol. 201, pp. 371~373.
[57] Smith, W.O.Jr., and Nelson, D.M.(1985), "Phytoplankton
bloom produced by a receding ice edge in the Ross Sea: Spatial coherence with the density field", Science, Vol. 227, pp. 163~166.
[58] Steele, J.H.(1962), "Environmental control of photosynthesis in the sea", Limnol. Oceanogr., Vol. 7, pp. 137~150.
[59] Stephens, F.C.(1989), "Effects of ultraviolet light on photosynthesis and pigments of Antarctic marine phytoplankton", PhD. Dissertation, Texas A&M University, 121pp.
[60] Strickland, J.D.H. and Parsons, T.R.(1972), "A Practical Handbook of Seawater Analysis", Fish. Res. Board Can. Bull. 167, 2nd ed. Ottawa, Canada.
[61] Suess, E.(1980), "Particulate organic carbon flux in the oceans: surface productivity and oxygen utilization", Nature, Vol. 288, pp. 260~263.
[62] Tilzer, M.M., von Bodungen, B., and Smetacek, V.(1985), "Light-dependence of phytoplankton photosynthesis in the Antarctic Ocean: Implications for regulating productivity", pp. 60~69. In: Antarctic Nutrient Cycles and Food Webs (W. R. Siegfried, P. R.
Condy, m1d R. M. Laws, eds.). Springer-Verlag, Berlin.
[63] Tilzer, M.M., Elbraechter, M., Gieskes, W.W., and Beese, B.(1986), "Light-temperature interactions in the control of photosynthesis in Antarctic phytoplankton", Polar Biol., Vol. 5, pp. 105~111.
[64] Trent, J.D., Shanks, A.L., and Silver, M.W.(1978), "In situ and laboratory measurements on macroscopic aggregates in Monterey Bay, California", Limnol.
Oceanogr., Vol. 23, pp. 626~635.
[65] Urrere, M.A. and Knauer, G.A.(1981), "Zooplankton fecal pellet fluxes and vertical transport of particulate organic material in the pelagic environment", J. Plank.
Res., Vol. 3, pp. 369~387.
[66] Weber, L.H. and El-Sayed, S.Z.(1985), "Spatial variability of phytoplankton and the distribution and abundance of krill in the Indian sector of the Southern Ocean", pp. 284~293. In: Antarctic Nutrient Cycles and Food Webs (W. R. Siegfried, P. R. Condy, and R. M.
Laws, eds.). Springer-Verlag, Berlin.
[67] Welschmeyer, N.A. and Lorenzen, C.J.(1985), "Chlorophyll budgets: zooplankton grazing and phytoplankton growth in a temperate fjord and the central pacific gyres", Limnol. Oceanogr., Vol. 30, pp. 1~21.
Received 18 May 2011 Revised 14 June May 2011 Accepted 22 June 2011