1. Introduction
Terrestrial laser scanner generates point cloud, based on the flight time of laser which is emitted from a scanner and reflected from targets. The terrestrial laser scanner can rapidly observe 3D shape of objects and has been applied in various fields such as Building Information Modeling (BIM), construction survey, and disaster management. For example, Cho et al.(2015) used terrestrial laser scanner in Antarctica and could achieve topographic map having accuracy of decimeter level. Hong et al.(2015) evaluated accuracy of terrestrial laser scanning in indoor BIM and verified the performance of terrestrial laser scanner. Moreover, for application of
point cloud data in BIM, Lee et al.(2015) compared accuracy of terrestrial scanning with image‐based 3D reconstruction technique and addressed that terrestrial laser scanner has better performance in obtaining detail information of building components.
In spite of the accuracy and precision of terrestrial laser scanner, the point cloud generated by scanner can havegeometric and radiometric errors caused by mechanical errorof a scanner, scanning geometry, and target properties. For effective application of theterrestrial laser scanner, performance evaluation is necessary to predict and quantify error sources which have significant effect on laser scanning data.
Geometric error sources in laser‐based distance measurement and angular error of scanning mirror
Received: 2016.06.01, revised: 2016.06.29, accepted: 2016.07.01
* MemberㆍPh.D. Student, School of Civil and Environmental Engineering, Yonsei University, [email protected]
** MemberㆍPh.D. Student, School of Civil and Environmental Engineering, Yonsei University, [email protected]
*** Ph.D. Student, School of Civil and Environmental Engineering, Yonsei University, [email protected]
**** MemberㆍResearch Associate, School of Civil and Environmental Engineering, Yonsei University, [email protected]
***** Corresponding AuthorㆍMemberㆍProfessor, School of Civil and Environmental Engineering, Yonsei University, [email protected]
Evaluation of Geometric Error Sources for Terrestrial Laser Scanner
1)
Lee, Ji Sang*ㆍHong, Seung Hwan**ㆍPark, Il Suk***ㆍ Cho, Hyoung Sig****ㆍSohn, Hong Gyoo*****
Abstract
As 3D geospatial information is demanded, terrestrial laser scanners which can obtain 3D model of objects have been applied in various fields such as Building Information Modeling (BIM), structural analysis, and disaster management. To acquire precise data, performance evaluation of a terrestrial laser scanner must be conducted. While existing 3D surveying equipment like a total station has a standard method for performance evaluation, a terrestrial laser scanner evaluation technique for users is not established. This paper categorizes and analyzes error sources which generally occur in terrestrial laser scanning. In addition to the prior researches about categorizing error sources of terrestrial Laser scanning, this paper evaluates the error sources by the actual field tests for the smooth in‐situ applications.The error factors in terrestrial laser scanning are categorized into interior error caused by mechanical errors in a terrestrial laser scanner and exterior errors affected by scanning geometry and target property. Each error sources were evaluated by simulation and actual experiments. The 3D coordinates of observed target can be distortedby the biases in distance and rotation measurement in scanning system. In particular, the exterior factors caused significant geometric errors in observed point cloud. The noise points can be generated by steep incidence angle, mixed‐pixel and crosstalk. In using terrestrial laser scanner, elaborate scanning plan and proper post processing are required to obtain valid and accurate 3D spatial information.
Keywords : Terrestrial Laser Scanner, Point Cloud, Accuracy, Precision, Performance Evaluation, BIM
79
Vol.24 No.2 June 2016 pp.79-87
Research Paper
ISSN: 2287-6693(Online)
http://dx.doi.org/10.7319/kogsis.2016.24.2.079
have been analyzed to developtheself‐calibration method for the terrestrial laser scanner (Reshetyuk, 2006; Lichti, 2007; Schulz, 2007). In particular, Lichti (2010) defined the error sources with calibration parameters and analyzed the correlation among the parameters.
As well as the error sources in laser scanner system, scanning geometry and target properties also can have significant influence on the quality of observed point cloud (Lichti et al., 2005; Wunderlich et al., 2013). For example, Soudarissanane et al.(2011) conducted an experiment to assess the influence of scanning geometry on terrestrial laser scanning data.Furthermore, due to the characteristics of a laser signal, unpredictable noise points can be generated. For example, the noise points generated around edge components make observation quality of complex structure such as construction site into lower level. Before application of terrestrial laser scanner, the error factors must be evaluated and considered in design of laser scanning.
In this regard, this paper categorized and analyzed error sources which have been found in terrestrial laser scanning by experiments.The influence of mechanical errors in a terrestrial laser scanner was analyzed by simulation test with parameterized error sources andthe effect of scanning geometry and target property was evaluated from actual field test.
2. Error Sources in Terrestrial Laser Scanning
The terrestrial laser scanner generates point cloud data using the observed distance which is calculated from the flight time of laser signals. During the process, the mechanical property of scanner, scanning geometry and target property can cause observation errors. This paper categorized the errors into two types:interior error caused by mechanical error of terrestrial laser scanner device; and external errors affectedby scanning geometry and target property.
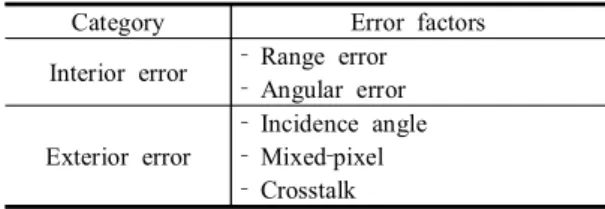
The error sources can cause several problems in terrestrial laser scanning. The error sources can be summarized by Table 1.
Table 1. Error Categorization
Category Error factors
Interior error ‐ Range error
‐ Angular error
Exterior error
‐ Incidence angle
‐ Mixed‐pixel
‐ Crosstalk
2.1 Mechanical Error
Terrestrial laser scanner emits thelasersignals in direction of horizontal angle ( q
h) and vertical angle ( q
v)which are pre‐calculated by the device. The device calculates 3Dcoordinates ( , , x y z ) of target object combining the angles and the flight distance ( r )which is derived from the laser flight time. The geometric equations can be represented by Eqs. (1), (2) and (3).
cos cos
v hx = r q q (1) cos sin
v hy = r q q (2) sin
vz = r q (3)
According to the above equations, the mechanical error is caused by the errors in the flight distance of laser, horizontal angle and vertical angle(Reshetyuk, 2006; Lichti, 2007; Schulz, 2007; Park et al., 2013).The laser flight distance can be calculated from the laser signal flight time. In measuring distance by laser,laser flight time errormight occur by bias derived from the internal signal delay of laser flight time measurement instrument. In addition, the emittance direction of laser signal is determined by the function of rotating mirror.The mechanical errors of horizontal and vertical rotationof mirror cause angular errors.
2.1.1 Range Error
The range distance between scanner and target can be determined by flight time of laser signal and Eq.
(4) represents basic formula that calculates the distance between scanner and the object.
2 c n r = t
(4)
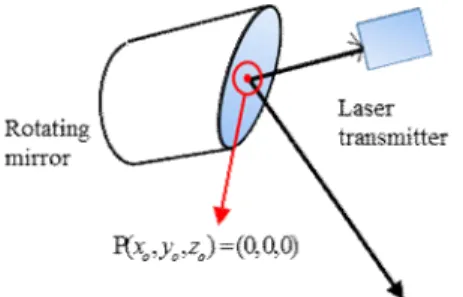
Figure 1. Disagreement between laser zero point and center of rotating mirror.
where, r represents distance to object, c for speed of light, n for refraction coefficient and t for time difference. The key of accuracy in laser scanning is to figure out the time difference precisely as possible.
When the calculation is not accurate, not only the distance can be distorted, but also the angular location can be wrong. Fig. 1 describes the disagreement between laser zero point and center of rotating mirror.
As shown in Fig. 1, the scanning center should be located on the center of the rotating mirror. However, when the distance between rotating mirror and laser transmitter is miscalculated, it causes the laser point fall into the wrong position and error in the calculation of the object location.The error factor is called range error.
2.1.2 Angular Error
Fig. 2 describes top view of internal system of terrestrial laser scanner.
When the rotating mirror is correctly assembled, the laser beam would fly exactly vertical to the horizontal axis as depicted by dashed line in Fig. 2.
But when the rotating mirror is dislocated, the error would occur as depicted by solid linein Fig. 2. This kind of erroris called collimation error.
Fig. 3 describes side view of internal system of terrestrial laser scanner.
Same as the case of collimation error, when the rotating mirror is assembled correctly, the beam would go parallel to the vertical axis as depicted by dashed line in Fig. 3. But when the dislocation occurs, the laser beam route would also make an error as depicted by solid line in Fig. 3. The error
factor is called vertical angular error.
As the mirror rotates for observation, laser would make a circle as shown in Fig. 4.
Figure 2. Top view of rotatingmirror
Figure 3. Side view of rotating mirror.
Figure 4. Front view of rotatingmirror.
Due to the gravity and mechanic error, the rotation would be slightly instable. So the circle that generated by the laser would be also slightly crushed.
This can be detected when the user locates the scanner opposite in 180 degree to the original pose as depicted in dashed line. This discordance is called vertical axis error.
2.2 Scanning geometry and target property Since terrestrial laser scanning generates point clouds with laser flight time and reflection intensity, laser incidence angle to the target object and target properties as shape and material quality might influence to the point cloud quality in addition to the mechanical error sources.
2.2.1 Laser incidence angle
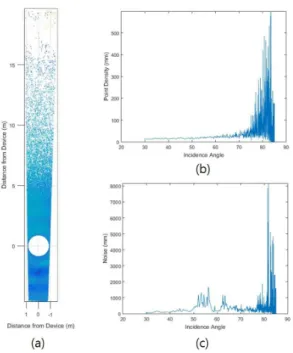
Because the flight time is measured by the signal reflected from a target, the laser incidence angle directly influences to the point cloud quality.When the incidence angle condition is not properly fulfilled, the point cloud may not be generated even using long‐range scanner within effective distance (Soudarissanane et al., 2011). These characteristics may cause crucial defect in observing road, tunnel, building and slope.
2.2.2 Mixed‐pixel
At the edge of target objects, which makes a discontinuous plane in generating point cloud, ghost pointsmight occur. The ghost points generated at the edge is generally called mixed‐pixel(Hebert and Krotkov, 1992; Tang et al., 2009). The mixed‐pixel is caused when the laser signal is partly reflected at the edge of a target object. The mixed pixel should be significantly considered in observing facilities with complicated structure asplants and bridges.
2.2.3 Crosstalk
When a laser signal is reflected from an object, the material and color can has an influence on measuring laser flight time of the target as well as received signal intensity (Amann et al., 2001; Pesci and Teza, 2008). The phenomenon generates noisesin point cloud and is called crosstalk (Hebert and Krotkov,
1992). The noise occurrence might affect to the precision of point cloud. In particular,phenomenon is often found in observing Black & White (BW) targets for registration and degrades the precision of point cloud.
3. Experiments
3.1 error
Terrestrial laser scanner is expensive and precise equipment so the mechanical errors aregenerally too smallto analyze (Lichti, 2010; Park, 2013). To evaluate influence of the mechanical errors in a terrestrial laser scanner, we conducted simulation analysis.
To identify the interior error sources, the mechanical error factor must be included in the geometric equation (Eqs. (1), (2) and (3)). For the simulation, the model proposed by Lichti(2010) and Reshetyuk (2010) was adopted. The error model can be represented by following Eqs. (5), (6) and (7).
2 2 2
0 d
x y z k e
r = + + = + + r (5)
0 1 2
arctan( )
sec tan
h
h h v h v
x
k k e
q
q q q
=
= + + + (6)
2 2 0
arctan
v v v
z k e
q = x y = + + q
+ (7)
where, r
0, q
h0, and q
v0represent true value of distance, horizontal angle and vertical angle respectively. And also k
d, k
h1, k
h2and k
vrepresent range error, collimation error, vertical angular error, and vertical axis error, respectively.
3.2 Evaluation of influence of scanning geometry and target property
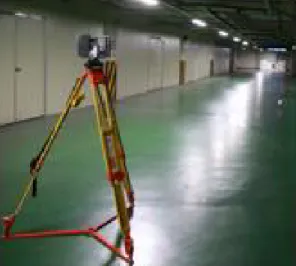
Theexperiment was conducted at the underground parking lot of Engineering Park in Yonsei University.
Fig. 5 shows the experiment site and terrestrial laser scanner.
A set of targets shown in Fig. 7 was established at
the distance of 55m. And scanning condition for
point resolution was set as 6.136mm/10m.
Figure 5. Experiment site and terrestrial laser scanner
Table 2. Specification of terrestrial laser scanner Terrestrial laser scanner Focus 3D
Manufacturer Faro
Instrument type Amplitude Modulated Continuous Wave (AMCW) Field of view
(vertical / horizontal)
Hori : 360°
Vert : 305°
Maximum measurement
range 120m
Maximum scan rate 976,000 points/sec Maximum Resolution 0.6mm @ 10m
0.95mm @ 25m
Focus 3D from FARO corporation was used for the experiment. Table 2 summarizes the specification of Focus 3D.
The Focus 3D uses the signal of Amplitude Modulated Continuous Wave (AMCW) which measures flight time of laser signal based on phase difference. The maximum effective range is about 120m.And point density of scanning in the experiments was set by 0.6 mm at 10 m. Fig. 6 shows the point cloud acquired by Focus 3D.
To analyze the error sources, O‐shape target were designed. To successfully identify the target in point cloud, point density and size of target were considered.Fig. 7 represents the design of set of targets.
Figure 6. Point cloud data acquired by Focus3D
Figure 7. Set of targets for error factor analysis:
O‐type target: (a) specific design, (b) picture
of real target.
4. Experimental Results
4.1 Influence of mechanical error
With respect to gradual changes of k k k k
d, ,
h1 h2,
v, point coordinates of target objects would change. To analyze change (dx, dy,dz) of point coordinates, a simulation test was done. The test applied simulated biases of range and angular error values on twofixed target point coordinatesobserved in low vertical angle ( (x, y, z) (5,30, 2) = , 3.7623 degree) and high vertical angle( (x, y, z) (5,3,11) = , 62.0725degree), respectively.
And the simulation followed error equati ons presented on prior chapters(Eq. Eqs. (1), (2) and (3), Eqs. (5), (6) and (7)). The results from (x,y,z) (5,30,2) =
Figure 8. Correlation between k
dand point location
Figure 9. Correlation between k
h1and point location
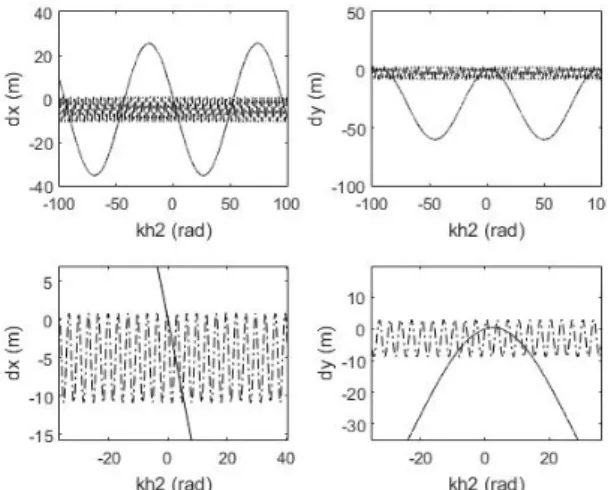
Figure 10. Correlation between k
h2and point location
Figure 11. Correlation between k
vand point location
is represented in solid line and the result from (x, y, z) (5,3,11) = are represented in dashed line in following Figs. 8, 9, 10 and 11, respectively.
In Fig. 8, correlations between k
dand point location errorsshowed linear relation since Eq. (5) is in linear form. The error amount of target location estimation seems to differ according to the target location.
As shown in Figs. 9, 10 and 11, correlationsbetween
1
k
h, k
h2, k
vand point location error wererepresented
in sine functional graph since the variables are
related with trigonometrical functions.Especially on
Fig. 10, additional graphs were shown whose range
of x axis was shorten for readability. Since
frequencies of graphs were highly different. Alike the case of k
dcorrelation, the graphs representing change amounts of target location estimation including frequency, width and wavelength differed in shape according to the target location.In particular,
1