Fatigue Crack Growth Behavior for Welded Joint of X80 Pipeline Steel
Youngpyo Kim*
✝, Cheolman Kim*, Woosik Kim* and Kwangseon Shin**
Abstract The fatigue crack growth behavior of high strength X80 pipeline steel was investigated with compact tension specimens that crack growth directions were aligned either parallel or normal to the rolling direction of the pipeline. Also, the fatigue crack growth rates for welded joint of X80 pipeline steel were investigated with compact tension specimens that crack growth directions were aligned either parallel or normal to the welding line. The experimental results indicated the fatigue crack growth behavior was markedly different in three zones, weld metal, heat affected zone and base metal of welded joints. There was a trend toward increment in the fatigue life of weld metal and heat affected zone as compared with the X80 pipeline steel.
Keywords: Fatigue Crack Growth Rate, X80 Pipeline Steel, Weld Metal, Heat Affected Zone, Crack Growth Direction
[논 문] - 비파괴 검사학 회지 Journal of the Korean Society for Nondestructive Testing Vol. 29, No. 1 (2009. 2)
[Received: October 1, 2008, Revised: February 5, 2009, Accepted: February 12, 2009] *R&D Division, Korea Gas Corporation, 638-1, Il-dong Sangnok-gu, Ansan, Gyeonggi-do, 425-790, Korea, **Research Institute of Advanced Materials, School of Materials Science and Engineering Seoul National University, 599 Gwanangno, Gwanak-gu, Seoul, 151-744, Korea, ✝Corresponding Author: [email protected]
1. Introduction
In order to reduce the total construction cost of long distance pipeline, the need for high strength pipelines has been increased because material and welding costs can be reduced by thinner pipe wall and gas transportation efficiency can be improved by increased opera- tion pressure. Low grade line pipe below API 5L X65 has been widely used in the 1980s. The application of high strength pipeline such as API 5L X70 and X80 grade has been increased for natural gas transmission since the 1990s to raise the operating efficiency. Gas pipelines have established an impressive safety record over the years. However, fatigue failure can be occurred on the gas pipeline because of undergoing operating pressure fluctuation(Chapetti et al., 2002). The girth weld in the gas pipeline especially is the most likely sites for fatigue
crack initiation. Some efforts have been made to characterize the behavior of cracks in pipeline steels and their welds(Shi et al., 1990; Tsay et al., 2001; Vosikovsky, 1980; Zhong et al., 2005).
However, little information is available on the behavior of the fatigue cracks in welded joints of X80 pipelines. Therefore, this study was undertaken to characterize propagation of fatigue cracks in X80 pipeline steel, heat affected zone (HAZ) and weld metal over a wide range of stress intensities in laboratory air.
2. Experimental Procedure
The materials used in this study are X80
pipeline steel having 25.0 mm in wall thickness
and 1,067 mm in outside diameter. The V-bevel
butt joint configuration has been prepared for
joining the pipeline in accordance with API
standard 1104. The girth weld of this pipeline
Table 1 Chemical compositions of X80 steel and SMAW weld metal
Element (wt%) C Mn Si P S Ni Cr Mo Nb V Ti
X80 steel 0.06 1.82 0.23 0.0040 0.0001 0.28 0.01 0.26 0.039 0.010 0.010
SMAW
weld metal 0.05 1.42 0.58 - - 1.30 0.17 0.13 0.012 0.010 0.023
Table 2 Mechanical properties of X80 steel and SMAW weld metal
Test position (orientation) Yield strength [MPa]
Tensile strength [MPa]
Elongation [%]
X80 steel (parallel to rolling direction) 601 651 25.2
SMAW weld metal (parallel to welding direction) 549 700 25.7
(a) SMAW weld metal / CGHAZ (b) FGHAZ
Fig. 1 Microstructures in girth weld of X80 pipeline steel was welded by gas tungsten arc welding
(GTAW) with ER70S-G filler metal for the root and hot pass, and shielded metal arc welding (SMAW) with low hydrogen E10016-G electrode for the remaining passes. The chemical compositions and the tensile properties of X80 pipeline steel and SMAW weld metal are summarized in Tables 1 and 2, respectively.
It is well known that the pipeline steel plates manufactured by thermo-mechanical control process have different microstructure and mechanical properties according to chemical composition and rolling conditions such as reduction ratio, reduction start temperature, reduction finish temperature and acceleration cooling rate (Hobuyuki et al., 2006; Shin et al., 2007). The microstructure of X80 pipeline steel mainly consists of acicular ferrite and bainite with an average grain size of about 3 m. Fig.
1 shows the microstructures of weld metal and
HAZ obtained by the welding process employed in this study. The microstructure of SMAW weld metal consisted of grain boundary ferrite and acicular ferrite. And the microstructure of coarse grained HAZ(CGHAZ) near fusion line was coarsened by the welding thermal cycle and mainly consisted of upper and lower bainite, together with minor amount of Widmanstätten ferrite. On the other hand, the microstructure of the fine grained HAZ(FGHAZ) near base metal was a very fine grain and mainly consisted of equiaxed ferrite and pearlite.
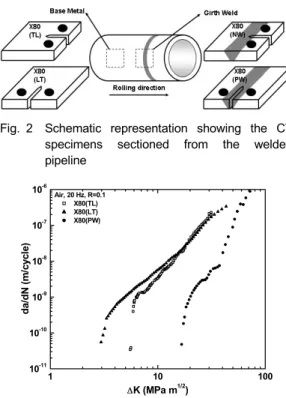
Fig. 2 shows the schematic representation of
the compact tension(CT) specimens sectioned
from the welded pipeline. The crack growth
directions for CT specimens of X80 pipeline
steel were aligned either parallel or normal to
the rolling direction of the pipeline, which were
designated as X80(TL) and X80(LT) specimens
according to ASTM E647, respectively. The
Fig. 2 Schematic representation showing the CT specimens sectioned from the welded pipeline
1 10 100
10
-1110
-1010
-910
-810
-710
-6Air, 20 Hz, R=0.1 X80(TL) X80(LT) X80(PW)
d a/ d N ( m /c yc le )
Δ K (MPa m
1/2)
Fig. 3 Fatigue crack growth rates of X80(TL), X80(LT) and X80(PW) specimens as a function of ΔK
notch was put at the center of weld metal and such specimens with the crack growth direction parallel to the welding direction were named as the parallel-weld specimens, X80(PW). The effect of various microstructures in the girth weld on the fatigue crack growth behavior was investi- gated by making the crack growth direction normal to the welding direction. Such specimens were named as the normal-weld specimens, X80(NW). All CT specimens were cut near the outside surface of the pipeline. Therefore, X80(PW) and X80(NW) specimens were not included GTAW weld metal.
The CT specimens were machined with 6.35 mm of thickness and 50.8 mm of width according to ASTM E647. All fatigue crack growth tests were performed with 2.5 ton servo-hydraulic testing machine at room tempera- ture in air of 50~60 % relative humidity. The loading frequency was 20 Hz with a constant amplitude sinusoidal waveform of the applied load at load ratio of 0.1.
The crack length was measured by the direct observation with traveling microscope.
3. Results and Discussion
Fig. 3 shows fatigue crack growth behavior of X80 pipeline steel according to the crack growth directions and weld metal with the crack growth direction parallel to the welding direction.
The fatigue crack growth rate of X80 pipeline steel was very sensitive to the crack growth direction. The X80(TL) specimen exhibited a much lower fatigue crack growth rate than the X80(LT) specimen at low stress intensity factor range (ΔK) value. The fatigue threshold stress intensity factor ranges (ΔK th ) of the X80(TL) and X80(LT) were 5.62 and 3.09 MPa m , respectively. On the other hand, the weld metal had significantly lower fatigue crack growth rate as compared to the X80 pipeline steel at the same ΔK value. And, the weld metal had higher ΔK th value as compared to the X80 pipeline steel at a load ratio of 0.1. The ΔK th value of the weld metal was 16.68 MPa m . It is indicated that the weld metal in the X80 pipeline possesses higher extrinsic resistance against fatigue crack growth as compared to the X80 pipeline steel.
The welded joint of X80 pipeline has shown
a gradient of microstructure and mechanical
properties from the weld metal to the unaffected
base metal in Fig. 1 and Table 2. Significant
researches regarding the microstructure change
and the mechanical properties of X80 pipelines
have been performed (Junhua et al., 2004; Cota
et al., 2000; Zhang et al., 2003). The evaluation
of fatigue crack growth behavior in weld,
especially in narrow HAZ, however, is one of
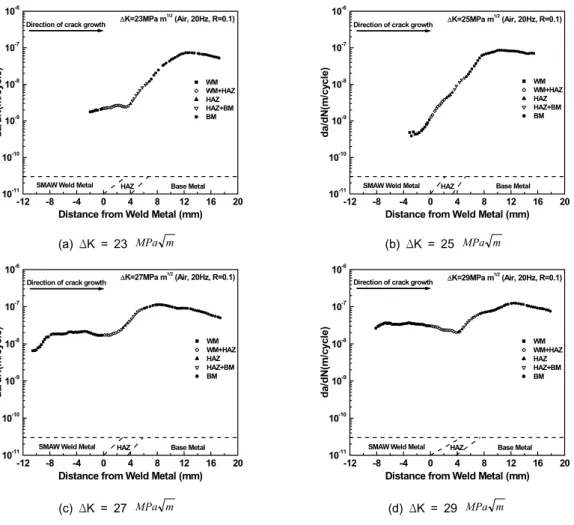
the most difficult research fields. Fig. 4 shows
the results of fatigue crack growth test for the
X80(NW) specimens and weld geometry of CT
specimen used. As the crack propagated cross
the weld metal, a mixed region with weld metal
and HAZ, HAZ and a mixed region with HAZ
-12 -8 -4 0 4 8 12 16 20 10
-1110
-1010
-910
-810
-710
-6ΔK=23MPa m1/2 (Air, 20Hz, R=0.1) Direction of crack growth
Base Metal SMAW Weld Metal HAZ
WM WM+HAZ HAZ HAZ+BM BM
da/ d N (m /cy cl e)
Distance from Weld Metal (mm)
-12 -8 -4 0 4 8 12 16 20
10
-1110
-1010
-910
-810
-710
-6ΔK=25MPa m1/2 (Air, 20Hz, R=0.1) Direction of crack growth
Base Metal SMAW Weld Metal HAZ
WM WM+HAZ HAZ HAZ+BM BM
da/ d N (m /cy cl e)
Distance from Weld Metal (mm)
(a) ΔK = 23 MPa m (b) ΔK = 25 MPa m
-12 -8 -4 0 4 8 12 16 20
10
-1110
-1010
-910
-810
-710
-6ΔK=27MPa m1/2 (Air, 20Hz, R=0.1) Direction of crack growth
Base Metal HAZ
SMAW Weld Metal
WM WM+HAZ HAZ HAZ+BM BM
d a/ d N( m /c ycl e)
Distance from Weld Metal (mm)
-12 -8 -4 0 4 8 12 16 20
10
-1110
-1010
-910
-810
-710
-6ΔK=29MPa m1/2 (Air, 20Hz, R=0.1) Direction of crack growth
Base Metal HAZ
SMAW Weld Metal
WM WM+HAZ HAZ HAZ+BM BM
d a/ d N( m /c ycl e)
Distance from Weld Metal (mm)
(c) ΔK = 27 MPa m (d) ΔK = 29 MPa m
Fig. 4 Fatigue crack growth rates of X80(NW) specimens at the constant ΔK and base metal into the base metal at the
constant ΔK value, the fatigue crack growth rates are continuously increased at all tested ΔK values. The fatigue crack growth rates of HAZ are lower than those of base metal at all tested ΔK values. The results demonstrated that HAZ have a significant higher resistance to crack propagation than base metal.
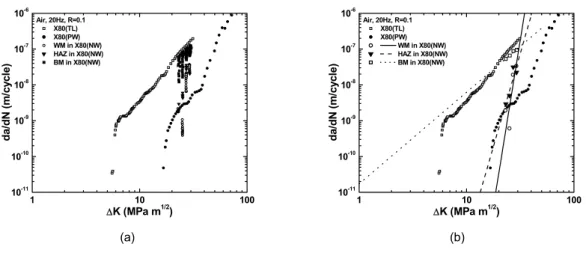
The fatigue crack growth rates of weld metal, HAZ and base metal in the X80(NW) specimen in Fig. 4 are replotted in Fig. 5(a) as a function of ΔK. Also, the test results of X80(TL) and X80(PW) specimens are redrawn as the reference fatigue crack growth rate curves from Fig. 3. Fig. 5(b) shows the average fatigue crack growth rates of weld metal, HAZ and base metal in the X80(NW) specimen at each ΔK
value. The average fatigue crack growth rates of weld metal, HAZ and base metal in the X80(NW) specimen, as shown in Fig. 5(b) are fitted by linear least square lines to the following eqns. (1) through (3);
for weld metal,
( )
18.5710
3542 . 2
/ dN K
da = ×
−Δ (1)
for HAZ,
( )
10.4010
2386 . 1
/ dN K
da = ×
−Δ (2)
and for base metal,
( )
2.5610
1173 . 1
/ dN K
da = ×
−Δ (3)
for ΔK in MPa m and da/dN in m/cycle.
1 10 100 10
-1110
-1010
-910
-810
-710
-6Air, 20Hz, R=0.1 X80(TL) X80(PW) WM in X80(NW) HAZ in X80(NW) BM in X80(NW)
d a/d N ( m /c yc le )
Δ K (MPa m
1/2) 1 10 100
10
-1110
-1010
-910
-810
-710
-6Air, 20Hz, R=0.1 X80(TL) X80(PW)
WM in X80(NW) HAZ in X80(NW) BM in X80(NW)