• 검색 결과가 없습니다.

Tracking and Face Recognition of Multiple People Based on GMM, LKT and PCA

N/A
N/A
Protected

Academic year: 2021

Share "Tracking and Face Recognition of Multiple People Based on GMM, LKT and PCA"

Copied!
23
0
0

로드 중.... (전체 텍스트 보기)

전체 글

(1)

Tracking and Face Recognition of Multiple People Based on GMM, LKT and PCA

Won Oh Lee

, Young Ho Park

††

, Eui Chul Lee

†††

, HeeKyung Lee

††††

, Kang Ryoung Park

†††††

ABSTRACT

In intelligent surveillance systems, it is required to robustly track multiple people. Most of the previous studies adopted a Gaussian mixture model (GMM) for discriminating the object from the background.

However, it has a weakness that its performance is affected by illumination variations and shadow regions can be merged with the object. And when two foreground objects overlap, the GMM method cannot correctly discriminate the occluded regions. To overcome these problems, we propose a new method of tracking and identifying multiple people. The proposed research is novel in the following three ways compared to previous research: First, the illuminative variations and shadow regions are reduced by an illumination normalization based on the median and inverse filtering of the L*a*b* image. Second, the multiple occluded and overlapped people are tracked by combining the GMM in the still image and the Lucas-Kanade-Tomasi (LKT) method in successive images. Third, with the proposed human track- ing and the existing face detection & recognition methods, the tracked multiple people are successfully identified. The experimental results show that the proposed method could track and recognize multiple people with accuracy.

Key words: Intelligent surveillance system, tracking multiple people, GMM, LKT, face recognition

※ Corresponding Author : Kang Ryoung Park, Address:

(100-715) Division of Electronics and Electrical Engin- eering, Dongguk University, Pil-dong 3-ga, Jung-gu, Seoul, Republic of Korea, TEL : +82-10-3111-7022, FAX

: +82-2-2277- 8735, E-mail : [email protected] Receipt date : Sep. 23, 2011, Revision date : Dec. 25, 2011 Approval date : Jan. 27, 2012

††††

Division of Electronics and Electrical Engineering, Dongguk University, Seoul, Republic of Korea (E-mail: [email protected])

†††††

Division of Electronics and Electrical Engineering, Dongguk University, Seoul, Republic of Korea (E-mail: [email protected])

†††††

Department of Computer Science, Sangmyung University, Seoul, Republic of Korea

(E-mail: [email protected])

††††

Broadcasting and Telecommunications Convergence Research Laboratory, Electronics and Telecommu- nications Research Institute (ETRI), Daejeon, Republic of Korea

(E-mail: [email protected])

†††††

Division of Electronics and Electrical Engineering, Dongguk University, Seoul, Republic of Korea

※ This work was supported by the R&D program of KCC. (09912-03002, Development of Interactive View Control Technologies for IPTV).

1. INTRODUCTION

With the widespread use of closed circuit TV (CCTV) cameras, intelligent surveillance systems have become a hot research topic in the computer vision field [1,2]. These systems have various ap- plications, such as access monitoring in a specific area, crowd congestion analysis, detection of ab- normal behaviors [3], traffic monitoring, human identification at a distance, etc [1].

Previous researches are divided into two cate-

gories: the hardware-based and the software-

based methods. The multimodal sensor-based

system is an example of the hardware based

method. It detects and identifies the objects of in-

terest by using pyroelectricity infrared (PIR) sen-

sors, audio sensors, or Doppler sensors [4-6]. Most

of the software-based methods adopt the use of

digital image processing and computer vision

[1,7-31], which have the advantages of using

(2)

cheaper camera systems and the obtaining of more detailed information of the object than the hardware-based ones. The software-based meth- ods start with motion detection. Motion detection usually involves environment modeling and motion segmentation [1]. For environment modeling, many algorithms have been introduced, including the temporal average of an image sequence [22,23], adaptive Gaussian estimation [24], and parameter estimation based on the pixel processes [25,26].

Motion segmentation includes background sub- traction [9,27,32], temporal difference [28], optical flow [29-31] and Gaussian mixture modeling (GMM) [14-17,22]. With the recent technological development of intelligent surveillance systems, it is required to track multiple persons robustly, tak- ing into account the changes in illumination and background. However, most of previous studies into environment modeling and motion segmenta- tion use the information from a still image or that found in successive images. The motion segmen- tation based on GMM, which has been used in most cases, has a weakness in that its performance is affected by illumination variations and in that the shadow regions can be merged with the object [14-17,22]. In order to solve these problems, many methods using color, texture, and reflectance esti- mations have been proposed [18,19]. However, these methods are too slow to be used in a re- al-time surveillance environment. In addition, when two foreground objects overlap, the GMM method cannot discriminate the occluded regions [33].

In previous researches, SVM-based combining method based on Retinex filtering and histogram stretching [34], and fuzzy-based Retinex filtering [35] have been introduced, which are designed for face recognition instead of real-time surveillance system.

In order to overcome these problems, we propose a new method of tracking and identifying multiple people. The proposed research is novel in the fol- lowing three ways compared to previous research:

First, the illuminative variations and shadow re- gions are reduced by an illumination normalization based on the median and inverse filtering of the L*a*b* image. Second, the multiple occluded and overlapped people are tracked by combining the GMM in the still image and the Lucas-Kanade- Tomasi (LKT) method in successive images.

Third, with the proposed human tracking and the existing face detection & recognition methods, the tracked multiple people are successfully identified.

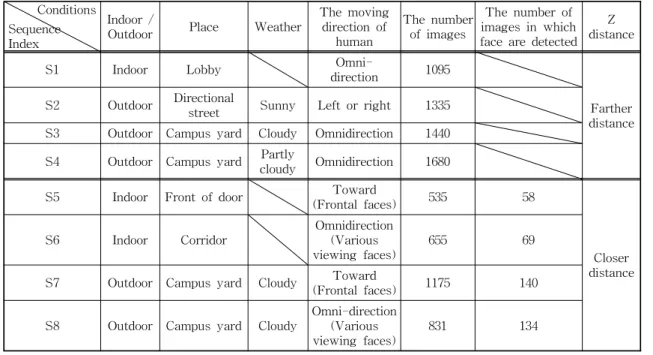
Although many face recognition systems have been studied [36-41], there are few researches into the adoption of face recognition technology in a surveillance environment [20,21]. However, these few studies performed face detection and recog- nition using simple backgrounds or an indoor environment. Alternatively, the proposed method can track multiple people with face information, in indoor and outdoor environments having a complex background. The rest of this paper is organized as follows: The proposed method is explained in Section 2. Experimental results and conclusions are shown in Section 3 and 4, respectively.

2. The Proposed Method

2.1 The overview of the proposed method

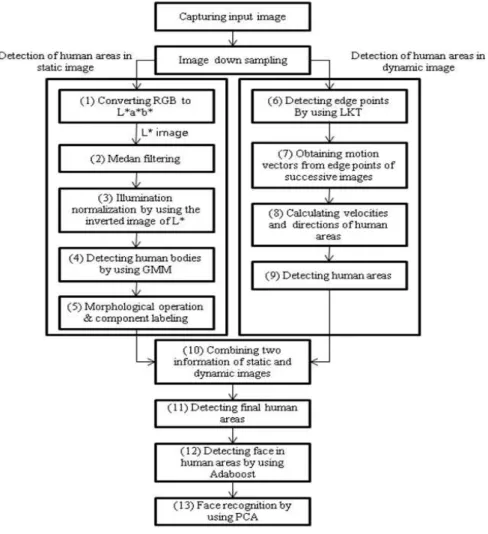
Fig. 1 shows an overview of the proposed

method. First, a RGB color image is captured and

transformed into a L*a*b* color image in order to

extract the lightness component (L) for the reduc-

tion of the illumination variation of the captured

image, as shown in step (1) of Fig. 1. The L image

is blurred by the median filter, as shown in step

(2) of Fig. 1 and the inversion of the L image is

used for the illumination normalization, as shown

in step (3) of Fig. 1. The illumination variation is

reduced by adding the original captured image to

the inverted one. The regions of interest (ROIs) of

the human objects are extracted using the GMM

method in the gray image, as shown in step (4)

of Fig. 1. A more accurate human area is deter-

(3)

Fig. 1 A flow chart of the proposed method.

mined through the morphological operation and the component labeling, as shown in step (5) of Fig. 1.

The edge points of the object are found by using the LKT method, as shown in step (6) of Fig. 1.

Through analyzing the correspondences between the edge points in the current and the previous frames by the LKT method, the multiple motion vectors can be calculated, as shown in steps (7) and (8) of Fig. 1. The human area is determined based on the motion vectors, as shown in step (9) of Fig. 1. Then, the information of motion vectors is combined with the detected human region by the GMM, as shown in step (10) of Fig. 1. From that, the genuine human areas are continuously ex- tracted, as shown in step (11) of Fig. 1, even if

multiple objects are overlapped. After that, the face area is detected by using the Adaboost face de- tector in the predetermined search region in the human area, as shown in step (12) of Fig. 1.

The detected face area is then normalized into a 32×32 pixel image. Finally, as shown in step (13) of Fig. 1, the extracted face is matched with the previously enrolled face template by using the PCA based face recognition method.

2.2 The foreground segmentation based on the GMM in the gray image

In order to discriminate the moving foreground

objects from the image, the background needs to

be determined. The GMM is a very popular method

(4)

Fig. 2. The detection of the human area by the GMM. Left figures: the original image. Middle figures:

the gray image. Right figures: the human area detected by using the GMM.

used to segment the objects through the modeling background robust to a little amount of local change [32]. Assuming that the distributions of the pixel values define the corresponding probability density functions (PDF), the background and the foreground can be adaptively determined through the updating of the PDF and checking whether the input pixel value is included in the PDF of the background. This is when the Gaussian probability model is usually used to define the PDF. The Gaussian probability model is suitable to represent that the data is assembled to the center of the average. Although the Gaussian probability model is widely used, it is restricted to making a uni-mo- dal distribution [42]. That is to say, the normal Gaussian model can represent only simple and slight changes of the pixel values. Therefore, we need a probability density function that is able to represent a more general form. This is the Gaussian mixture model and it is the sum of the plural num- ber of the Gaussian probability model, and can be presented as the following equation [32,33]:

(1)

where

(2) And

(3) where α is the learning rate. M

k,t

is assigned as 1 for the model to be detected and 0 for that not to be detected. And μ is the mean, Σ

k,t

is the var- iance which is defined as . Here, is unit matrix. After the Gaussians are ordered by the value of ω/α, the first B distributions are chosen as the background model.

(4)

where T is the minimum portion of the background model.

To increase the processing speed of the GMM,

a 24-bit RGB color image, as shown in the left ones

of Fig. 2, is converted to an 8-bit gray image, as

shown in the middle ones of Fig. 2. Then, as shown

in the right ones of Fig. 2, the human area is lo-

calized using the GMM.

(5)

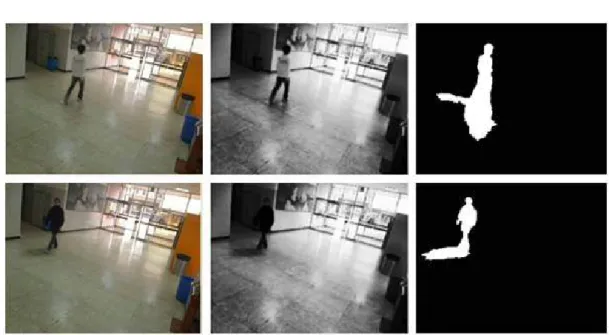
The GMM based method has a problem in that it is sensitive to illuminative variations, as shown in the right figures of Fig. 3. To overcome this problem, we reduce the influence of the lightness by normalizing the illuminative component of the image before determining the human area.

2.3 The illumination normalization method

In general, the images captured by camera have the variation of environmental light or shadow as shown in Fig. 3.

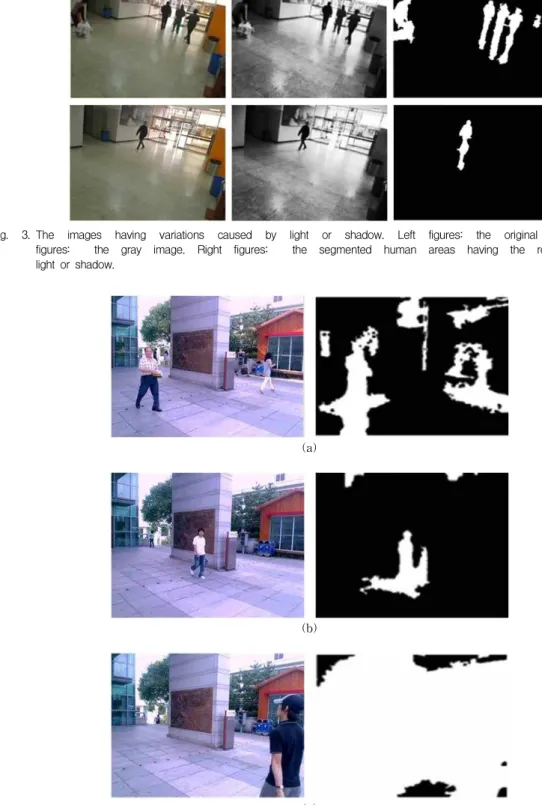
Since there is no significant visual difference between areas (having the variation of light or shadow) and those without it in successive images, the correct foreground region is difficult to be dis- criminated only by the GMM. If the shadows or the light reflective areas are connected to a human area, the size of detected human area becomes big- ger than the correct human area. If the shadows or light reflective areas are separate from the hu- man area, there can be a problem that the separate areas are falsely recognized as being other human ones. Fig. 4 shows the examples that are influenced by light reflection or shadow areas.

In face recognition, illumination normalization methods based on Retinex filtering have been in- troduced, but they are too slow to be used in a re- al-time surveillance environment, since it uses time consuming Gaussian convolutions and loga- rithmic operations using the whole image [35]. So, a fast algorithm for solving this problem is pro- posed as follows:

After the RGB image is converted to the L*a*b*

image, an illuminative component image is ac- quired by applying the 5×5 pixel median filter to the L image, as shown in Fig. 5 (b). The L image includes all the factors of illumination variation, and the gray component of objects and background.

Through median filtering, the illumination varia- tion can be approximated excluding the gray com- ponent of objects and background as shown in Fig.

5 (b).

The inverted image is obtained from this, as shown in Fig. 5 (c). The influence of the illumina- tive variation is suppressed by summing the in- verted image and the original L image, as shown in Fig. 5 (d). For example, the dark shadow on left bottom side of Fig. 5 (a) is reduced in Fig. 5 (d).

In addition, the dark corridor (the left of a person) of Fig. 5 (a) becomes brighter in Fig. 5 (d). And the lighting of all parts of Fig. 5 (d) becomes more uniform than that of Fig. 5 (a).

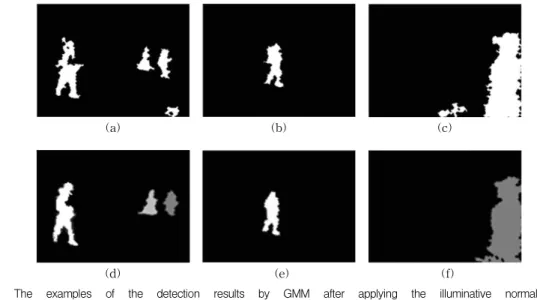
The processing time of proposed illumination normalization is 8.6ms in the input image of 320×240 pixels on average, while Retinex algorithm [35,43] takes 96ms in the image of same size. The total processing time is 90.6 ms (11 frames/sec) in a desktop computer, having an Intel® core 2™ Duo CPU 2.4GHz with 3GB RAM. Fig. 6 shows the re- sults of the GMM based foreground extraction af- ter applying the proposed illuminative normalization.

In previous research [44], the shadow of the foreground area can be removed on the basis that the color information of the shadow is similar to that of background in the detected foreground box, but the gray level of the shadow is different from that of background in the detected foreground box.

However, in our experiments, the parts of fore- ground area (especially, a user wearing white clothes) were also incorrectly removed as the shadow by this method, but through the proposed illumination normalization, the shadows of fore- ground are removed while the most of foreground area are maintained.

Along with the detected foreground regions

found by the illumination normalization and the

GMM, additional post-processing methods, such

as morphological operations and component labe-

ling, are performed. In morphological operation,

erosion and dilation are performed, through which

some holes or concave regions can be filled and

the uneven boundaries of foreground can be

smooth. Through component labeling, the noise

region whose size is small and isolated can be

(6)

Fig. 3. The images having variations caused by light or shadow. Left figures: the original image. Middle figures: the gray image. Right figures: the segmented human areas having the reflection of the light or shadow.

(a)

(b)

(c)

Fig. 4. Examples of images that include illuminative variation (left) and the resultant images using GMM

(right). (a) the case of noise that is generated by illuminative variation. (b) the case including

shadow. (c) the case including an abrupt change of illumination.

(7)

(a) (b)

(c) (d)

Fig. 5. An example of illumination modeling. (a) the original image (b) The illuminative component acquired by median filtering (c) The inverted image of (b) (d) result image combining (a) and (c).

(a) (b) (c)

(d) (e) (f)

Fig. 6. The examples of the detection results by GMM after applying the illuminative normalization. (a) the result with Fig. 4 (a) (left one). (b) the result with Fig. 4 (b) (left one). (c) the result with Fig.

4 (c) (left one). In addition, the examples of the detection results obtained by further post-processing.

(d) the result with Fig. 6 (a). (e) the result with Fig. 6 (b). (f) the result with Fig. 6 (c).

removed. Using these methods a more accurate foreground area can be obtained, as shown in Fig. 6.

2.4 Solving the occlusion problem by combin- ing the GMM and the LKT

However, when multiple foreground objects are tracked, occlusion or overlap problems can happen.

In the case of exclusively using the GMM method,

the occlusion problem causes the detection of im-

poster foreground objects. In addition, if the

(8)

Fig. 7. The detected motion vectors by the LKT (points: the detected corner points by the LKT, arrows : the motion vectors calcu- lated from the moved corner points in the successive images, box : the final box of human area).

tracked multiple objects are overlapped, the GMM can extract only one merged area. To overcome these problems, our new method of combining the GMM in the still image and the Lucas-Kanade- Tomasi (LKT) method in the successive images is proposed as follows. The LKT method calculates motion vectors, which are created based on the shifted corner points found in the successive im- ages [45,46].

The LKT method tracks feature points by cal- culating the correlations among them on the basis of the mean square error (MSE) [46,47]. This algo- rithm is represented by the following equation [11]:

) ( ) ( )

( x I x d n x

J = - + (5)

where I( ) is the brightness in the current frame, x is the location of the pixel, d is the displacement vector, n( ) is the noise, and J( ) is the brightness of the next frame. As shown in Eq. (6), feature tracking is carried out in the direction that mini- mizes the MSE of the feature window W [48].

))

2

( ) (

å

Î

( - -

=

jW

I x

j

d J x

j

e (6)

where ε is the MSE. The brightness function needs to be approximated using the Taylor series ex- pansion [46]. By repeating this procedure, the opti- mal displacement vector d is found.

Consequently, the feature points in the detected eye regions are extracted by using the Shi and Tomasi detection algorithm [49], and then, these feature points are tracked by the LKT method [48].

The detected motion vectors obtained by the LKT are shown by the arrows in Fig. 7.

The final human area is detected in order to combine the human areas based on the GMM and the LKT. In detail, inside the box region including the detected area of GMM, the motion vectors (the arrows of Fig. 7) are located by the LKT. Based on the outmost starting and ending points of the motion vectors, one box (the box of Fig. 7) is de- fined as the final human area. By using these schemes, the occlusion problem can be solved be- tween the moving objects, as shown in Fig. 8. In Fig. 8, the numbers (#1122~#1136) below each fig- ure represent the frame number.

Fig. 9 shows the detection results of Fig. 3 by using proposed methods.

2.5 The face detection using the Adaboost algorithm and face recognition based on the PCA

Our research uses the adaptive boosting (Ada- boost) algorithm for detecting the face region [50, 51]. Through the training of the Adaboost algo- rithm, a highly accurate simple classifier is posi- tioned in front of the hierarchical structures, which reduces false detections. Fig. 10 shows an example of the detection of the face region by using the Adaboost face detector inside of the detected hu- man area.

Only when the width of the box detected by the

GMM and the LKT is greater than the predeter-

mined threshold is the face detection performed. In

the case that it is less than the threshold, even if

the face region is detected successfully, the face

recognition frequently fails due to the shortage of

pixel information in the facial region. The optimal

threshold was empirically determined to be 50 pix-

els in order to have accurate face recognition.

(9)

#1122 #1124 #1126 #1128

#1130 #1132 #1134 #1136

(a)

#1122 #1124 #1126 #1128

#1130 #1132 #1134 #1136

(b)

Fig. 8. Examples of tracking multiple and overlapped objects (a) by using GMM and (b) by combining GMM and LKT.

(a) (b)

Fig. 9. The detection results of Fig. 3 by using proposed methods. (a) the case of Fig. 3 (a). (b) the case of Fig. 3 (b).

In order to reduce false face detection errors and the processing time, the face region is detected only in the predetermined area located inside the fore- ground region. The rough positions of the eyes and

lips are detected by using binarization and compo-

nent labeling in the predetermined area inside the

detected face region. Based on them, a more accu-

rate face region is defined and then is normalized

(10)

(a) (b)

Fig. 10. An example of detecting face region by using Adaboost face detector inside of the detected human area. (a) Detected human area. (b) and (c) show the detected face region.

Fig. 11. The examples of the eigen-faces.

to 32×32 pixels for face recognition.

In this research, face recognition is performed based on the principal component analysis (PCA) method. The PCA is a statistical method which can reduce the dimensions of the original feature space, thereby an optimal feature space can be obtained [52,53]. The PCA method, being the most popular method in face recognition, is used in order to get a low dimensional component which includes the principal component from a face image. In previous research, the comparisons of PCA-based computer face recognition and human face recognition ac- cording to facial components were also performed [54]. The obtained vectors that represent the low dimensional space are called eigen-faces, which are obtained from the training images. In general, the PCA makes eigen-vectors by using covariance matrix C

T i M

i

i

m )( m )

M (

C = å - -

=

x x

1

1 (7)

where x

i

is one dimensional vector of ith face

image (p×q pixels size), and m is the average vec- tor of face images of training data. By calculating covariance matrix C, basis vector U is determined by choosing k vectors whose magnitude of ei- gen-value is larger. From that, the eigen-vector w is determined by projecting face image (x) to basis vector U.

) m

T

( -

= U x

w (8)

The examples of the obtained eigen-faces are shown in Fig. 11. With N eigen-faces, an input face image is represented as N eigen-coefficients. The optimal number of eigen-faces was empirically de- termined to ensure the accuracy of the face recognition.

As shown in Fig. 10 (b), in order to match the

input images having arbitrary views, the ei-

gen-coefficients from multiple images with six

different views (allowing the yaw of -20~+20 de-

grees, the tilt of -20~0 degrees) are stored for

each person in the enrollment stage (see the Ex-

perimental Results section and Fig. 14). Since the

(11)

Table 1. The eight different image sequences used for the experiments Conditions

Sequence Index

Indoor /

Outdoor Place Weather The moving direction of

human

The number of images

The number of images in which face are detected

distance Z

S1 Indoor Lobby Omni-

direction 1095

Farther distance S2 Outdoor Directional

street Sunny Left or right 1335 S3 Outdoor Campus yard Cloudy Omnidirection 1440 S4 Outdoor Campus yard Partly

cloudy Omnidirection 1680

S5 Indoor Front of door Toward

(Frontal faces) 535 58

Closer distance

S6 Indoor Corridor Omnidirection

(Various

viewing faces) 655 69

S7 Outdoor Campus yard Cloudy Toward

(Frontal faces) 1175 140

S8 Outdoor Campus yard Cloudy Omni-direction (Various

viewing faces) 831 134

camera is positioned above the face of human in conventional surveillance system, we do not con- sider the tilt greater than 0 degrees. The similarity is measured by calculating the Euclidean distance between the enrolled coefficients and those of the input image.

3. The Experimental Results

For the experiment, the images were collected by using a low priced and conventional webcam, such as the Logitech PN 960-000057. The spatial resolution and frame rate are 640×480 pixels and 15 frames per second, respectively [55]. A desktop computer, having an Intel® core 2™ Duo CPU 2.4GHz with 3GB RAM, is used in experiment.

3.1 The performance evaluation of the human tracking

A number of image sequences were acquired ac- cording to four different scenarios and activities, as shown in Table 1. The sequences of S1~S4 are used for testing the performance of human tracking

at a distance. The sequence of S5~S8 are used for testing the performances of both human tracking and face recognition at a closer distance. That is because the face cannot be recognized at farther distance due to the shortage of image pixel.

The performance is measured by using two measurement schemes: “Recall” and “Precision”.

“Recall” is the average detection rate, in which the detection is counted when the area of manually drawn is overlapped with that automatically detected. “Precision” is calculated by averaging the true positively detection rate by following equation:

(9) where N

tp

is the number of true positives and N

fp

the number of false positives in the image sequence [7]. True positives mean correctly detecting object, while false positives mean incorrectly detecting objects. Consequently, if the value of Recall is close to 1, the accuracy of people detection is high. And the value of precision is close to 1, all the detected objects are correct with 0 false positive.

Table 2 shows the experimental result with S1

(12)

Table 2. The measured “Recall” and “Precision” with the test sequence sets of S1, S2, S3, and S4 of Table 1 Sets of sequences

Measurement Schemes

S1

S2 S3 S4

The included number of people in image less than 3 persons more than 3 persons

Recall (%) 95.36 88.70 96.79 97.45 88.70

Precision (%) 97.50 92.13 93.75 97.94 92.13

Table 3 The measured “Recall” and “Precision” with test sequence sets of S5, S6, S7, and S8 of Table 1 Sets of sequences

Measurement Schemes S5 S6 S7 S8

Recall (%) 92.53 92.89 91.96 92.56

Precision (%) 90.27 91.4 91.07 90.85

Table 4. The measured “Recall” and “Precision” of the proposed method with CAVIAR datasets

Database Measurement

Scheme CAVIAR

Recall (%) 94.78

Precision (%) 99.48

~S4 which were collected at farther distance of Table 1. And Table 3 shows the experimental re- sult with S5~S8 which were collected at closer distance of Table 1.

The average recall of S1~S4 is 93.4% and aver- age precision is 94.69%. S1 is captured in the smaller place (lobby) than the others. So, if there are more than 3 persons in that place, this area is very crowded. That is the reason why only S1 is divided into two cases according to the included number of people in image. The case of more than 3 persons in S1 shows lower Recall (88.70%) and Precision (92.13%) compared to other cases. This is why many people are overlapped in small place.

S4 shows lower Precision (92.13%) than the others, because illumination variation frequently happens due to the influence of partly cloudy.

The average of recall of S5~S8 is 92.49% and average of precision is 91.9%. Overall Recall and Precision of S5~S8 at closer distance sequence, are lower than those at farther distance (The aver- age recall of S1~S4 is 93.4%, and that of S5~S8 is 92.49%. The average precision of S1~S4 is 94.69%, and that of S5~S8 is 91.9%). That is be- cause the size of object is bigger in image at closer distance, the number of background pixel is re- duced, which can degrade the performance of GMM because the GMM models the background.

Fig. 12 shows the examples of the tracked humans in the sets of sequences of S1~S8.

We performed the experiments with additional open datasets, CAVIAR database [56]. These data- sets include 3683 images of people walking alone, meeting with others, fighting and passing out, leaving a package in a public place, resting, and browsing, etc. Table 4 shows the experimental re- sult with CAVIAR.

The CAVIAR datasets collected image frames with a wide angle camera lens in the entrance lobby. So, sizes of objects are relatively smaller than our datasets, and there is no illumination var- iation or the noise of background such as the movement of trees. Accordingly, background mod- eling is robust by using GMM, and precision (99.48%) is high. But recall (94.78%) is relatively lower than precision. It is because the sizes of ob- jects are small, and objects are incorrectly recog- nized as noise, consequently. Fig. 13 shows the ex- amples of the tracked humans by the proposed method in CAVIAR datasets.

We compared the performances of MeanShift

[57,58] and CamShift tracking method [59] to those

(13)

(a)

(b)

(c)

(d)

(14)

(e)

(f)

(g)

(h)

Fig. 12. Examples of human tracking by using the proposed method (a) S1 (b) S2 (c) S3 (d) S4 (e)

S5 (f) S6 (g) S7 (h) S8.

(15)

Fig. 13. the examples of the tracked humans by the propose method in CAVIAR datasets.

Fig. 14. the examples of false detection by using MeanShift method in CAVIAR datasets.

of the proposed method. The MeanShift and CamShift methods are based on the color histo- grams of the object to be tracked. In case of using the MeanShift method to track objects, the accu- rate kernel and parameters are required. Conse- quently, if the region to be tracked includes even

a little background information, MeanShift method incorrectly recognizes background regions as ob- ject regions. Fig. 14 shows the examples of false detection by using MeanShift method.

To overcome these problems, CamShift can be

used and we compared the proposed method to the

(16)

Table 5. The measured “Recall” and “Precision” with our datasets and CAVIAR datasets by using CamShift method

Sets of sequences Measurement

Schemes S1 S2 S3 S4 S5 S6 S7 S8 CAVIAR

Recall(%) 64.28 51.76 26.24 23.95 72.02 77.63 80.35 84.11 44.53 Precision(%) 66.93 49 35.48 32.1 78.14 45.32 74.47 83.45 53.85

Fig. 15. the examples of false tracking result by the CamShift method with S3, S4 datasets.

CamShift method. Table 5 shows the experiment results with our datasets and CAVIAR datasets by using CamShift method.

Although CamShift method has better perform- ance than MeanShift method, it has weakness that if background is complex or the histogram of back- ground is similar to that of objet to be tracked, tracking performances are severely decreased. The average recall of our datasets and CAVIAR is 58.32% and average precision is 57.64% by using CamShift method. As shown in Table 5, the per- formance of S3 (The recall is 26.24% and precision is 35.48%) and S4 (The recall is 23.95% and pre- cision is 32.1%) were worse than other cases since background regions are very complex and object regions are relatively smaller in these cases. Fig.

15 shows the examples of false tracking result with S3, S4 datasets.

S5~S8 datasets have higher accuracies (The average recall of S5~S8 is 78.53% and average precision is 70.35%) than S1~S4 (The average re- call of S1~S4 is 41.56% and average precision is 45.88%) datasets. That is because the images of S5~S8 are collected for testing face recognition, the sizes of objects are bigger than S1~S4 datasets.

So, it is easy to track based on color histogram

having many color information. But as shown in

Table 5, the precision of S6 is worse than S7, S8,

and S9 datasets. That is because in case of S6,

there are a lot of situation that initially background

is incorrectly recognized as object, and this back-

ground region continues to be recognized as object

in successive images. By comparing Table 2~4 to

Table 5, we could know that the performances of

the proposed method were better than previous

methods with our database and open database.

(17)

Fig. 16. 6 directional face images for enrollment.

Table 6. The experimental result using S5 of Table 1

Face detection rate (%) Face recognition rate (%)

Frontal face Rank 1 ~Rank 3 ~Rank 5 ~Rank 7

93.1 74.07 94.44 100 100

Table 7. The experimental result using S6 of Table 1

Face detection rate (%) Face recognition rate (%)

Frontal face Side face Rank 1 ~Rank 3 ~Rank 5 ~Rank 7

94.74 54.00

57.78 68.89 84.44 100

65.22

Table 8. The experimental result using S7 of Table 1

Face detection rate (%) Face recognition rate (%)

Frontal face Rank 1 ~Rank 3 ~Rank 5 ~Rank 7

90 82.54 95.24 100 100

Table 9. The experimental result using S8 of Table 1

Face detection rate (%) Face recognition rate (%)

Frontal face Side face Rank 1 ~Rank 3 ~Rank 5 ~Rank 7

92 50.46

73.08 91.03 100 100

58.21

3.2 The performance evaluation of the face recognition

To measure the performance of face recognition, we use four sets of sequences, S5~S8, as shown in Table 1. In our experiment, open databases, such as the Notre Dame Dataset or the UCSD Dataset, were not used because they were not captured in surveillance environment including various factors, such as illumination variations, complicated back- ground and variations of face size [60].

The eigen-coefficients from 50 persons with 6 images per person including various views are en- rolled for the face recognition. Since the face image

with arbitrary view can be obtained in surveillance environment as shown in Fig. 10, they include 6 directional face images: the frontal face, the left side face, the right side face, the bottom frontal face, the bottom left side face, and the bottom right side face, as shown in Fig. 16.

The images in which the viewing directions of faces are top front, top left and top right were not used for enrollment because the cameras of sur- veillance system are installed at high position in general.

Tables 6~9 show the experimental results of

1-to-N identification. In Tables 6~9, “Rank 7”

(18)

(a) (b) (c)

Fig. 17. Example of correctly matching in face recognition system (a) original image (b) detected face image (c) the face images for enrollment which are correctly matched.

represents that the accuracy of the face recognition through counting results in the 1st~7th candidates matching. That is, if the corrected matching face is same to or higher rank than the 7th of the whole matching list (e.g. 1st, 2nd … 7th rank), it is re- garded as a correct recognition.

The average rank 1 rate of face recognitions of Table 6~9 is 71.87%, the average rank 3 rate is 87.4%, the average rank 5 rate is 96.11%, and the average rank 7 rate is 100%. The experimental re- sults showed that the matching results of the face images captured in the outdoor environment were better than those of the indoor environment (The rank 1 rate (82.54%) of face recognition of S7 is higher than that (74.07%) of S5, And the rank 1 rate (73.08%) of face recognition of S8 is higher than that (57.78%) of S6). This is the reason why we performed the illuminative normalization of the 32×32 face image. In most cases, the result in out- door environment showed a better performance because the natural environmental light is more uniform than that in the indoor environment. Also, the image sequence including only frontal faces showed better performance than those having var- ious viewing faces. So, S7 shows the best perform- ance (The rank 1 rate of face recognition is 82.54%), while S6 shows the worst performance (The rank 1 rate of face recognition is 57.78%). In all cases, the face recognition rate becomes 100%

in Rank 7. So, we can know that the proposed method can be used in the surveillance monitoring system with human administrator, which is often the case with conventional intelligent surveillance system. Fig. 17 shows the examples of correctly matching as “Rank 1”. Fig. 18 shows example of incorrectly matching.

Experimental results showed that the total proc- essing time is 90.6 ms (11 frames/sec).

S1~S4 datasets were captured without any control, supervision and cooperate of image pro- viders. But S5~S8 datasets were captured under control and supervision in order to measure espe- cially the performance of face recognition. That is because if the sizes of faces are too small or direc- tions of faces are too rotated, the face recognition cannot be done. However, considering the actual surveillance environment, S5~S8 datasets were collected with the minimal instruction of moving direction and distance. By conclusion, S1~S4 and additional open database of CAVIAR were mainly used for measuring the performance of tracking.

And S5~S8 were mainly used for the perform- ances of tracking and face recognition.

4. CONCLUSIONS

In this paper, a new surveillance system that is

robust for illumination variation and which can

(19)

(a) (b) (c) (d)

Fig. 18. Example of incorrectly matching in face recognition system (a) original image (b) detected face image (c) Rank 1 matching image (d) the face image for enrollment of detected person in (a).

track multiple people irrespective of occlusion and overlap is proposed. The proposed research has following novelties.

(1) The illuminative variations and shadow re- gions are reduced by an illumination normalization based on the median and inverse filtering of the L*a*b* image.

(2) The multiple occluded and overlapped people are tracked by combining the GMM in the still im- age and the Lucas-Kanade-Tomasi (LKT) method in successive images.

(3) With the proposed human tracking and the existing face detection & recognition methods, the tracked multiple people are successfully identified.

The experimental results show that the average recall of our datasets and CAVIAR is 93.17% and average precision is 93.65%. The average of rank 1 rate of face recognition is 71.87%, the rank 3 rate is 87.4%, the rank 5 rate is 96.11%, and the rank 7 rate is 100%, respectively.

In future work, we would test the proposed method in more varied environments. We also plan to study a method for increasing the performance of face detection and face recognition irrespective of the viewing directions of the face.

REFERENCES

[ 1 ] W. Hu, T. Tan, L. Wang, and S. Maybank,

“A Survey on Visual Surveillance of Object Motion and Behaviors,” IEEE Trans. on Sys- tems, Man, and Cybernetics, P art C: Appli- cations and Reviews, Vol.34, No.3, pp.

334-352, 2004.

[ 2 ] A. Dore, M. Soto, and C.S. Regazzoni, “Baye- sian Tracking for Video Analytics,” IEEE Signal Processing Magazine, Vol.27, Issue 5, pp. 46-55, 2010.

[ 3 ] V. Saligrama, J. Konrad, and P. Jodoin, “Video Anomaly Identification,” IEEE Signal P ro- cessing Magazine, Vol.27, Issue 5, pp. 18-33, 2010.

[ 4 ] J. Houser and L. Zong, “The ARL Multimodal Sensor: A Research Tool for Target Signature Collection, Algorithm Validation, and Em- placement Studies,” Proc. International Conference on Computer Vision and Pattern Recognition, 2007. (페이지 정보가 없습니다) [ 5 ] Z. Zhu, W. Li, E. Molina, and G. Wolberg,

“LDV Sensing and Processing for Remote Hearing in a Multimodal Surveillance Sys- tem,” P roc. International Conference on Computer Vision and Pattern Recognition, 2007. (페이지 정보가 없습니다)

[ 6 ] P. Smaragdis, B. Raj, and K. Kalgaonkar,

“Sensor and Data Systems, Audio-Assisted Camera, and Acoustic Doppler Sensors,”

Proc. International Conference on Computer

(20)

Vision and Pattern Recognition, 2007. (페이지 정보가 없습니다)

[ 7 ] C. Town, “Sensor Fusion and Environmental Modeling for Multimodal Sentient Comput- ing,” P roc. International Conference on Computer Vision and Pattern Recognition, 2007. (페이지 정보가 없습니다)

[ 8 ] T. Zhao, M. Aggarwal, T. Germano, L. Roth, A. Knowles, R. Kumar, H. Sawhney, and S.

Samaraskera, “Toward a Sentient Environ- ment: Real-time Wide Area Multiple Human Tracking with Identities,” Machine Vision and Applications, Vol.19, No.5-6, pp. 301-314, 2008.

[ 9 ] I. Haritaoglu, D. Harwood, and L.S. Davis,

“W4 : Real-time Surveillance of People and Their Activities,” IEEE Trans. on Pattern Analysis Machine Intelligence, Vol.22, Issue 8, pp. 809- 830, 2000.

[10] B. Wu and R. Nevatia, “Tracking of Multiple, Partially Occluded Humans Based on Static Body Part Detection,” P roc. International Conference on Computer Vision and Pattern Recognition, Vol.1, pp. 951-958, 2006.

[11] H. Lim, V.I. Morariu, O.I. Camps, and M.

Sznaier, “Dynamic Appearance Modeling for Human Tracking,” Proc. International Conference on Computer Vision and Pattern Recognition, Vol.1, pp. 751-757, 2006.

[12] T. Zhao, R. Nevatia, and F. Lv, “Segmentation and Tracking of Multiple Humans in Complex Situations,” IEEE Trans. on Pattern Analysis and Machine Intelligence, Vol.26, No.9, pp.

1208-1221, 2004.

[13] Y. Wum and T. Yu, “A Field Model for Human Detection and Tracking,” IEEE Trans.

on Pattern Analysis and Machine Intelli- gence, Vol.28, No.5, pp. 753-765, 2006.

[14] J. Varona, J. Gonzàlez, I.R. Juan, and J. Vill- anueva, “Importance of Detection for Video Surveillance Applications,” Optical Engin- eering, Vol.47, No.8, pp. 087201-1-087201-9,

2008.

[15] W. Lin, M.T. Sun, R. Poovendran, and Z.

Zhang, “Activity Recognition using a Combi- nation of Category Components and Local Models for Video Surveillance,” IEEE Trans.

on Circuits and Systems for Video Technol- ogy, Vol.18, No.8, pp. 1128-1139, 2008.

[16] T. Xiang and S. Gong, “Activity Based Sur- veillance Video Content Modeling,” Pattern Recognition, Vol.41, Issue 7, pp. 2309-2326, 2008.

[17] D. Makris, T. Ellis, and J. Black, “Intelligent Visual Surveillance: Towards Cognitive Vision Systems,” The Open Cybernetics and Syste- mics J ournal, Vol.2, No.??, pp. 219-229, 2008.

(호 기입 요함!!!) (본 저널의 형식상 호가 없습 니다.)

[18] Z. Liu, K. Huang, T. Tan, and L. Wang, “Cast Shadow Removal with GMM for Surface Re- flectance Component,” Proc. International Conference on Pattern Recognition, Vol.1, pp.

727-730, 2006.

[19] Y. Matsushita, K. Nishino, K. Ikeuchi, and M.

Sakauchi, “Shadow Elimination for Robust Video Surveillance,” Proc. Workshop on Motion and Video Computing, pp. 15-21, 2002.

[20] R. Liu, X. Gao, R. Chu, X. Zhu, and S. Z. Li,

“Tracking and Recognition of Multiple Faces at Distances,” Advances in Biometrics, Vol.4642, pp. 513-522, 2007.

[21] L. Jiangwei and W. Yunhong, “Video-Based Face Tracking and Recognition on Updating Twin GMMs,” Advances in Biometrics, Vol.4642, pp. 848-857, 2007.

[22] N. Friedman and S. Russell, “Image Segmen- tation in Video Sequences: a Probabilistic Approach,” Proc. the 13th Conf. Uncertainty in Artificial Intelligence, pp. 1-3, 1997.

[23] D. Koller, J. Weber, T. Huang, J. Malik, G.

Ogasawara, B. Rao, and S. Russel, “Toward

Robust Automatic Traffic Scene Analysis in

Real-time,” Proc. International Conference

(21)

on Pattern Recognition, pp. 126-131, 1994.

[24] M. Köhle, D. Merkl, and J. Kastner, “Clinical Gait Analysis by Neural Networks: Issues and Experiences,” P roc. IEEE Symposium on Computer-Based Medical Systems, pp. 138- 143, 1997.

[25] H. Z. Sun, T. Feng, and T. N. Tan, “Robust Extraction of Moving Objects from Image Sequences,” Proc. Asian Conf. Computer Vision, pp. 961-964, 2000.

[26] W.E.L. Grimson, C. Stauffer, R. Romano, and L. Lee, “Using Adaptive Tracking to Classify and Monitor Activities in a Site,” Proc. IEEE Conference on Computer Vision and Pattern Recognition, pp. 22-31, 1998.

[27] S. McKenna, S. Jabri, Z. Duric, A. Rosenfeld, and H. Wechsler, “Tracking Groups of People,”

Computer Vision Image Understanding, Vol.80, No.1, pp. 42-56, 2000.

[28] A.J. Lipton, H. Fujiyoshi, and R.S. Patil,

“Moving Target Classification and Tracking from Real-time Video,” P roc. IEEE Work- shop Applications of Computer Vision, pp. 8- 14, 1998.

[29] D. Meyer, J. Denzler, and H. Niemann, “Model Based Extraction of Articulated Objects in Image Sequences for Gait Analysis,” P roc.

IEEE International Conference on Image Processing, pp. 78-81, 1998.

[30] J. Barron, D. Fleet, and S. Beauchemin,

“Performance of Optical Flow Techniques,”

International J ournal of Computer Vision, Vol.12, No.1, pp. 42-77, 1994.

[31] D. Meyer, J. Psl, and H. Niemann, “Gait Classification with HMM’s for Trajectories of Body Parts Extracted by Mixture Densities,”

Proc. British Machine Vision Conference, pp.

459-468, 1998.

[32] C. Stauffer and W.E.L. Grimson, “Adaptive Background Mixture Models for Real-time Tracking,” Proc. International Conference on Computer Vision and P attern Recognition,

Vol.2, pp. 246-252, 1999.

[33] Y. Tian, M. Lu, and A. Hampapur, “Robust and Efficient Foreground Analysis for Real- time Video Surveillance,” Proc. Internatio- nal Conference on Computer Vision and Pattern Recognition, Vol.1, pp. 1182-1187, 2005.

[34] G.P. Nam, B.J. Kang, and K.R. Park, “Robust- ness of Face Recognition to Variations of Illumination on Mobile Devices Based on SVM,” KSII Transactions on Internet and Information Systems, Vol.4, No.1, pp. 25-44, 2010.

[35] G.P. Nam, B.J. Kang, E.C. Lee, and K.R. Park,

“New Fuzzy-based Retinex Method for the Illumination Normalization of Face Recogni- tion on Mobile Device,” IEEE Transactions on Consumer Electronics, in submission.

[36] D. Swets and J. Weng, “Discriminant Anal- ysis and Eigenspace Partition Tree for Face and Object Recognition from Views,” Proc.

International Conference on Automatic Face and Gesture Recognition, pp. 182-187, 1996.

[37] B. Moghaddam, W.Wahid, and A. Pentland,

“Beyond Eigenfaces: Probabilistic Matching for Face Recognition,” Proc. International Conference on Automatic Face and Gesture Recognition, pp. 30-35, 1998.

[38] G. Guo, S. Li, and K. Chan, “Face Recognition by Support Vector Machines,” Proc. Interna- tional Conference on Automatic Face and Gesture Recognition, pp. 196-201, 2000.

[39] H. Rowley, S. Baluja, and T. Kanade, “Neural Network Based Face Detection,” IEEE Trans.

on Pattern Analysis and Machine Intelli- gence, Vol.20, Issue 1, pp. 23-38, 1998.

[40] B. Menser and M. Wien, “Segmentation and Tracking of Facial Regions in Color Image Sequences,” Proc. SPIE Visual Communicat- ions and Image Processing, Vol.4067, pp.

731-740, 2000.

[41] A. Saber and A.M. Tekalp, “Frontal-view

Face Detection and Facial Feature Extraction

(22)

using Color, Shape and Symmetry Based Cost Functions,” Pattern Recognition, Vol.19, No.8, pp. 669-680, 1998.

[42] P. KaewTraKulPong, and R. Bowden, “An Improved Adaptive Background Mixture Model for Real-time Tracking with Shadow Detection,” Proc. the 2nd European Work- shop on Advanced Video Based Surveillance Systems, pp. 1-5, 2001.

[43] G.D. Hines, Z. Rahman, D.J. Jobson, and G.A.

Woodell, “Single-scale Retinex Using Digital Signal Processors,” Proc. Global Signal P rocessing Expo, pp. 335-343, 2004.

[44] R. Cucchiara, C. Grana, M. Piccardi, and A.

Prati, “Detecting Moving Objects, Ghosts, and Shadows in Video Streams,” IEEE Trans. on P attern Analysis and Machine Intelligence, Vol.25, No.10, pp. 1337-1342, 2003.

[45] B.D. Lucas and T. Kanade, “An Iterative Image Registration Technique with an Appli- cation to Stereo Vision,” Proc. International Joint Conference on Artificial Intelligence, pp.

674-679, 1981.

[46] C. Tomasi and T. Kanade, Detection and Tracking of Point Features, Technical Report CMU-CS-91-132, Carnegie Mellon University, 1991.

[47] J.Y. Bouguet, Pyramidal Implementation of the Lucas Kanade Feature Tracker Descrip- tion of the Algorithm, Intel Corporation, Microprocessor Research Labs. OpenCV Documents, 2003.

[48] W.O. Lee, E.C. Lee, and K.R. Park, “Blink Detection Robust to Various Facial Poses,”

J ournal of Neuroscience Method, Vol.193, No.2, pp. 356-372, 2010.

[49] J. Shi, C. Tomasi, “Good Features to Track,”

Proc. Int Conference on CVPR, pp. 593-600, 1994.

[50] Y. Freund and R.E. Schapire, “A Short

Introduction to Boosting,” Journal of Japanese Society for Artificial Intelligence, Vol.14, No.5, pp. 771-780, 1999

[51] P. Viola and M.J. Jones, “Robust Real-Time Face Detection,” International Journal of Computer Vision, Vol.57, No.2, pp. 137-154, 2004.

[52] H. Abdi and L.J. Williams, “Principal Compo- nent Analysis,” Computational Statistics, Vol.

2, issue 4, pp. 433-459, 2010

[53] M. Turk and A. Pentland, “Eigenfaces for Recognition,” Journal of Cognitive Neurosci- ence, Vol.3, No.1, pp. 71-86, 1991.

[54] H.H. Nam, B.J. Kang, and K.R. Park,

“Comparison of Computer and Human Face Recognition According to Facial Compo- nents,” Journal of Korea Multimedia Society, Vol.15, No.1, pp. 40-50, 2012

[55] Logitech Camera, http://www.logitech.com (accessed on December 24, 2011)

[56] http://homepages.inf.ed.ac.uk/rbf/CAVIAR/

(accessed on December 24, 2011)

[57] D. Comaniciu, V. Ramesh, and P. Meer,

“Kernel-Based Object Tracking”, IEEE Trans. on Pattern Analysis and Machine Intelligence, Vol.25, No.5, pp. 564-577, 2003.

[58] D. Comaniciu, V. Ramesh, and P. Meer, “Real- Time Tracking of Non-Rigid Objects using Mean Shift,” P roc. IEEE Conference on Computer Vision and Pattern Recognition (CVP R ‘00), Vol.2, pp. 142-149, 2000.

[59] G.R. Bradski, Computer Video Face Tracking for Use in a Perceptual User Interface, Tech- nical report, Intel Technology Journal, Q2, 1998.

[60] D. Thomas, K.W. Bowyer, and P.J. Flynn

“Strategies for Improving Face Recognition from Video,” Advances in Biometrics, pp.

339-361, 2008.

(23)

Won Oh Lee

~2009. 2. Bachelor in Dept. of Electronics Engineering, Dong- guk University

~Current: Unified Master and Doctorial in Div. of Electron- ics Electrical Engineering, Dongguk University

Research interests : biometrics, image processing, pat- tern recognition

Young Ho Park

~2010.2. Bachelor in Dept. of Electronics Engineering, Dong- guk University

~Current: Master in Div. of Electronics Electrical Engin- eering, Dongguk University Research interests : biometrics,

image processing

Eui Chul Lee

~2005.2. 7 7Bachelor in Dept. of software, Sangmyung Uni- versity

~2007.2. Master in Dept. of Computer Science, Sangmyung University

~2010.2. Ph.D in Dept. of Computer Science, Sang- myung University

~2012.2. Senior researcher in NIMS

~Current: Full time lecture in Dept. of Computer Science, Sangmyung University Research interests:

computer vision, image processing, pattern recog- nition, egonomics, BCI and HCI

Heekyung Lee

~1999. 2. Bachelor in Dept. of Computer Eng., Yeungnam University

~2002. 2. Master in Dept. of Engineering, Information and Communication University (ICU)

~Current: Senior engineering staff in Electronics and Telecommunications Research Institute (ETRI) Research interests : personalized service via metadata,

HCI, bi‐directional AD, and video content analysis.

Kang Ryoung Park

~1994. 2. Bachelor in Dept. of Electronics Eng., Yonsei Uni- versity

~1996. 2. Master in Dept. of Electronics Eng., Yonsei Uni- versity

~2000. 2. Ph.D in Dept. of Electrical and Computer Eng., Yonsei University

~2003. 2. Senior researcher in LG Elite

~2008. 2. Full time lecturer and assistant professor in Div. of Digital Media Tech., Sangmyung University.

~Current: Assistant professor and associate professor in Div. of Electronics and Electrical Eng., Dongguk University

Research interests : image signal processing, pattern

recognition, biometrics

수치

Fig. 1 A flow chart of the proposed method.
Fig. 2. The detection of the human area by the GMM. Left figures: the original image. Middle figures:
Fig. 4. Examples of images that include illuminative variation (left) and the resultant images using GMM (right)
Fig. 6. The examples of the detection results by GMM after applying the illuminative normalization
+7

참조

관련 문서