INTRODUCTION
Consumer’s perception is the core idea that en- courage their trust and loyalty for specific brand among corporation’s various marketing strategies.
And this is appearing various types according to con- sumer’s personality, lifestyle, individual value, per- ceived risk, marketing strategy and the other valu- ables (Chang & Wu 2012).
Consumer’s perception about their satisfaction and behavior after purchasing is affected much by their perceived risk. Because service offerings have
large intangibility in natural, consumers are unable to assess the purchase outcome prior to experience.
And they perceive specified risks about their dissa- tisfaction in service organizations (Laroche et al 2004;
Manuela & Sicilia 2013). In other words, it means that consumers feel various risks at buying process on ac- count of service’s intangibility. So service corpo- rations are making diverse efforts to support tangible clues to reduce perceived risk of consumer. Tangible clues generally suggested to be composed of service process, participants, physical evidence among dif-
Culinary Science and Hospitality Research (October 2015)Vol. 21, No. 5, pp. 38-49
Does Tangible Clue influence on Perceived Risk
and Overall Satisfaction? : Focused on the Customers at Family Restaurants in South Korea
Tae-Hwan Yoon
1, Gang-Chun Lee
2and Young-Jun Choi
1¶1¶Dept. of Culinary Art, The University of Kyungdong, Korea
2Dept. of Culinary Art, The University of KIT, Korea
ABSTRACT: The purpose of this study was to investigate tangible clues influence on perceived risk and
overall satisfaction of customers at family restaurant in South Korea. In this research overall CFA and SEM were employed to analyze the data. Tangible clues were divided to 3 factors and perceived risk to 6 factors.
Tangible clue 1 'physical evidence', had negative(—) influence on financial risk(p<0.01), performance risk(p<0.01) and psychological risk(p<0.001). Tangible clue 2 'employee' affected negatively(—) time risk(p<0.001), performance risk(p<0.001), psychological risk(p<0.01) and social risk(p<0.001). And tangible clue 3 'service process' influenced negatively(—) physical risk(p<0.01), time risk(p<0.05), financial risk (p<0.001) and performance risk(p<0.01). And among customer's perceived risks, 3 factors(time risk~p<
0.001, performance risk~p<0.001, social risk~p<0.001) influenced negatively(—) their overall satisfaction.
Through these results, it appears that customers perceive various tangible clues and risks at family restaurants. And they are likely to satisfy or dissatisfy according to their perceived risks. As a result, food service companies need to research various customers' perceived risks as important marketing strategy, and reduce them for increase and induction of customers' satisfaction.
Keywords: tangible clue, perceived risk, overall satisfaction, family restaurant, South Korea
¶ Corresponding Author: Tae-Hwan Yoon, Ph.D. Professor, Dept. of Culinary Art, Kyungdong University, San 244 Nohak-dong, Sokcho-city, Gangwon-do 217-711, South Korea, Tel. +82-33-639-0551, Fax. +82-33-639-0514, E-mail: [email protected]
ferent classification (Gary & Rosa 2013).
Meanwhile, researches about perceived risk are fulfilled in the field of economics, psychology, deci- sion making, insurance, management and public poli- cy to the present. Perceived risk has been a popular area of research within consumer psychology for over three decades. In general, risk perception is thought as arising from unanticipated and uncertain consequences of a dissatisfied and unpleasant nature resulting from the purchasing of product and service (Klerck & Sweeney 2004; Pi & Sangruang 2011). As the results of that research, it has proved that con- sumer’s perceived risk influenced positively or nega- tively their purchasing behavior, satisfaction and loy- alty (Shim & Lee 2011). However, there has been found few previous research about the case of food service industry. Hence, there is a need for develop- ing a deeper understanding of the linkage among tangible clues, perceived risk and satisfaction. Espe- cially the risk perception of customers about food service purchase appears differently in comparison with buying each of tangible goods and service (Zeithaml 2006). In other words, because restaurant is the complicated place that sells tangible food and intangible service together, it is expected more dif- ferentiated research results about risk perception of customer than purchasing service only of insurance, bank and mobile service. The purpose of this study is to investigate tangible clues’ influence on per- ceived risk, and perceived risk's influence on overall satisfaction of customers at family restaurant in South Korea. It means whether tangible clue can re- duce perceived risk of customers or not. And this current study hopes to contribute to suggest adopt- ing the results for the food service corporations.
Therefore it wishes theoretical and practical applica- tion for managers of hospitality industry.
Tangible Clues
On buying service goods, consumer is confused on account of intangible characteristics. Intangibility is a meaning that which cannot be easily defined, formulated or grasped mentally and the lack of phy- sical evidence (Brent et al 2011). In the study of rela- tions among service marketing mix(7ps), perceived quality and satisfaction, Bitner (1990) proposed tan-
gible clues influenced consumer’s satisfaction and loyalty. Yelkur (2000) suggested that tangible clue was composed of physical evidence, place, parti- cipants and service process. And this affected pos- itively or negatively consumer’s satisfaction, creation of new customer and retention of loyalty. However, Laroche et al (2004) asserted that service had 3 kinds of perceived risk which were physical intangibility, generality, and mental intangibility. And intangibility influenced positively consumer’s perceived risk.
Namely, this means that tangible clue is possible to reduce their perceived risk. Ziethaml et al (2006) pro- posed that physical evidence, service process and employee differentiated service corporation’s mar- keting strategy from existing marketing strategy.
And these tangible clues reduced consumer’s per- ceived risk due to intangibility in service. In this study service process, employee and physical evi- dence were adopted as variables of tangible clue through following previous literature from Rafig &
Ahmed (1995), Zeithaml et al (2006).
Perceived Risk
Perceived risk is an important concept in the so- cial sciences with abundant and deep previous literature. And it has been researched focused on the evaluation about buying decision, selection and buy- ing behaviors (Pi & Sangruang 2011). Perceived risk means the degree of various risks at purchasing process and consumer’s perception of special brand.
And it has much influence on the consumer’s per- ception of buying decision (Pires et al 2004; Martin
& Camarero 2009). Researchers conceptualized risk which has two components namely, uncertainty and consequence. Uncertainty means a possibility which is arousing unexpected results. And consequence is importance by itself and risk degree.
Jacoby & Kaplan (1972) fulfilled the study of per- ceived risk was made up of social, psychological, physical, financial and performance risk (Dowling &
Staelin 1994; Pi & Sangruang 2011). After this re-
search suggested to confirm 5 perceived risks af-
fected significantly overall perceived risk, Booker per-
formed extended study to add time risk, and as-
serted result that time risk influenced other per-
ceived risks. Through the compared study about
manufactured goods with service in perceived risk, Murray & Schalcter (1990) proposed overall service quality heighten perceived risk (quoted from Laro- che et al 2004). Meantime, according to enlarged study of Mitchell & Hogg (1999) with product ca- tegory risk and specific risk, it was found that higher product category risk was lower allowed risk, and significant difference was between product category risk and specific risk by individual income. Perceived risk is viewed as an individual and subjective expec- tation about purchasing behavior (Chang & Wu 2012).
Buy the way, perceived risk is conceptualized ge- nerally as follows. According to the previous liter- ature, physical risk can be defined as the potential loss of bodily harmfulness and injury after buying be- havior due to safety of service and products (Stone
& Gronhaug 1993; Srivastav & Sharma 2011). Psy- chological risk is the latent loss of self-image and self-concept as the purchasing behavior (Mitchell &
Greatorex 1993; Pi & Sangruang 2011). And financial risk means the potential loss of money related with the process of information search, purchasing and buying results (Mitchell & Hogg 1999; Chang & Wu 2012). Social risk is the definition as the potential loss of honor, esteem, respect, special concern and fri- endship from other people (Shim & Lee 2011). At last, time risk can mean the potential loss of time and effort related to service and products (Martin &
Camarero 2009).
While there are studies of relations among various valuables~information search method, intangibility, brand, quality, etc except for tangible clues and per- ceived risk (Pi & Sangruang 2011). In this study, we argue that tangible clues are antecedent to the per- ceived risk. Therefore we followed Ziethaml et al (2006) proposed tangible clues could reduce con- sumer’s perceived risk due to intangibility in service.
And because Laroche et al (2004) suggested in- tangibility affected positively perceived risk, ad- versely this means tangible cues can have negative influence on it.
Meanwhile, the reason why intangibility, hetero- geneity, perishability, inseparability and variability exist in properties of service, services tend to be per- ceived as riskier to buy than manufactured goods (Pi
& Sangruang 2011). That is, consumers may feel low-
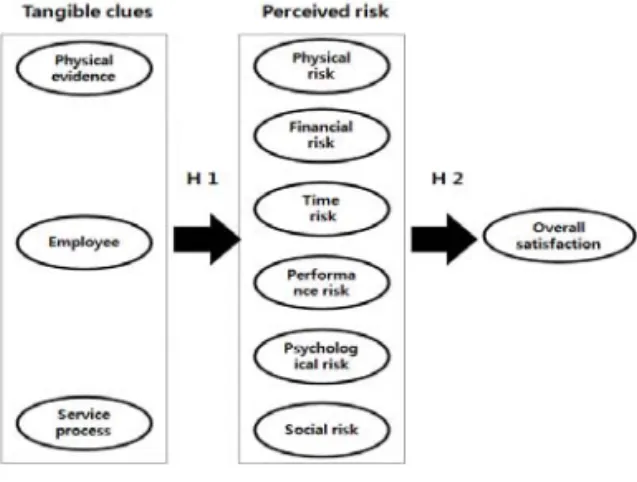
Figure 1. Research model.
er confidence and higher uncertainty in the making decision. Therefore, the aim of this research was un- derstanding whether tangible clues have significant influence on the perceived risk and satisfaction or not (Figure 1).
Tangible Clues, Perceived Risk and Satisfaction While intangibility is generally thought to the cau- se of perceived risk. a few research about relation- ships between 3 factors of tangible clues and six di- mensions of perceived risk have been found. Name- ly, the major hypothesis is that tangible clue does in- fluence negatively(—) the perceived risk.
Hypothesis 1 : Tangible clues influence nega- tively(—) the perceived risk.
Measurement of satisfaction has been performed by various researchers. Generally it is realized by transaction~specific approach method, overall sa- tisfaction and accumulated satisfaction. The trans- action-specific approach method means consump- tion at the latest point of specified time. This has de- finite weakness of frequent and extreme variation by recent conditional variables. On the other hand, overall satisfaction and accumulated satisfaction is the consideration method of consumer’s satisfaction through accumulated evaluation about various as- pects of special goods (Xuemei & Moutinho 2011).
Perceived risk means the degree of risk that con- sumer feels in the purchasing process and decision.
This affected significantly behavior such as satis- faction and loyalty (Chang & Wu 2012). Bobbitt &
Dabholkar (2001) and Brent et al (2011) suggested
psychological risk had the most negative influence on the consumer’s satisfaction in the purchasing through internet. And another study was that higher social risk induces lower satisfaction (Pi & Sangruang 2011). Therefore, we suggested following hypothesis 2, how six kinds of perceived risk affect customer’s satisfaction.
Hypothesis 2 : Perceived risk influence nega- tively(—) customer’s overall satisfaction.
RESEARCH METHODS
Instrument and Survey Procedures
Subject of investigation was customers at three family restaurants~TGI Friday, Vips and Ashley in Seoul city and Busan city of South Korea. A list of questions is composed of tangible clue~15 items, perceived risk~24 items and overall satisfaction~3 items.
Self-administered questionnaires were completed by a convenience sample of 900 restaurant’s custom- ers in 2 cities. Surveys with written comments were encouraged during the completion of the question- naire, and they were collected immediately upon completion. 817 sample~lists of questions were adopted without 83, faulty and insufficient samples among total of 900 visiting customers.
At first, 100 questionnaires were pre-tested with adult customers at 3 family restaurants from Novem- ber 1
stto December 15
thin 2014 year. After those ad- justment and supplementation, main research of 900 questionnaires performed from January 1
stto Fe- bruary 30
thin 2015 year. The questionnaires were divided into 3 family restaurants in each city(total 6 places in 2 cities).
Measurement
All measurement were based on the previous re- search-tangible clues to perceived risk, and per- ceived risk to satisfaction (Laroche et al 2004; Chang
& Wu 2012). And 7~point scales were used.
Tangible clues were composed of items from physical evidence, service process and employee of participants. We used customer’s perceived perfor- mance of tangible clues after visiting family res- taurants. And these items were measured by strongly
disagree(1 point), normally agree(4 point) and st- rongly agree(7 point).
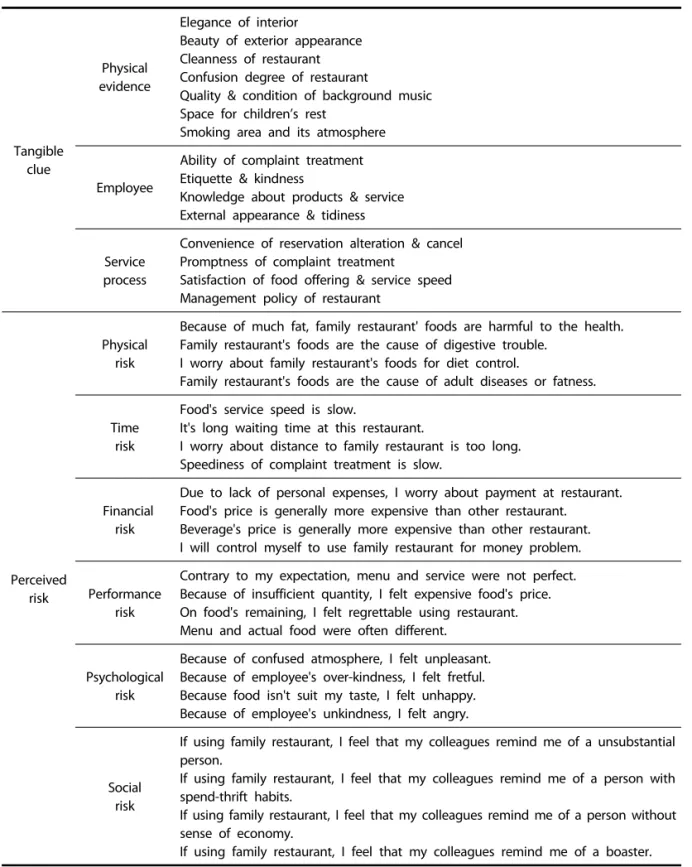
And perceived risk was made up of items namely, 6 factors~physical risk, time risk, financial risk, per- formance risk, psychological risk and social risk. The perceived risk scales were adapted from them devel- oped by Laroche et al (2004), Martin & Camarero (2009) and Shim & Lee (2011). The scales demon- strated fine reliability and Validity in previous re- search. These items were measured by strongly dis- agree(1 point), normally agree(4 point) and strongly agree(7 point). And these all items are presented in Table 1. At last, measurement of customer’s overall satisfaction was 3 items. This measured by strongly disagree(1 point), normally agree(4 point) and st- rongly agree(7 point).
Data Analysis Method
The model were tested by structural equation pro- cedure proposed by Laroche et al (2004) and Chang
& Wu (2012). SPSS 18.0 package program and AMOS 5.1 were adopted to analyze the data. With using the maximum-likelihood estimation method to examine the fit of models to their respective observed va- riance-covariance metrics, we used confirmatory fac- tor analysis in AMOS software.
At first, we performed confirmatory factor analy- sis(CFA) to evaluate construction of validity and to identify reliability of tangible clue, perceived risk and satisfaction. In the second place, we tested the SEM(path analysis) from tangible clues to perceived risk(H1) and from perceived risk to overall satis- faction(H 2). The result of empirical model is pre- sented in Figure 2.
RESULTS AND DISCUSSION
CFA of Tangible Clue, Perceived Risk and Ov- erall Satisfaction
CFA(Confirmatory Factor Analysis) of tangible clue, perceived risk and satisfaction was used to test the adequacy of the measurement model. And it was summarized in Table 2. According to the result, ade- quacy numerical indexes were χ
2=32.275, p=0.000
<0.05, GFI=0.917, AGFI=0.912, PGFI=0.425, NFI=
0.903 and RMR=0.159. It appeared good adequacy to
show RMR over 0.05, and all of GFI, AGFI, NFI near
1. Although χ
2was under 0.05, the most parts of ade- quacy numerical indexes had validity on account of near 1. Therefore reliability and validity of this study
were confirmed.
Testing the Structure Equation Model
Tangibleclue
Physical evidence
Elegance of interior
Beauty of exterior appearance Cleanness of restaurant Confusion degree of restaurant
Quality & condition of background music Space for children’s rest
Smoking area and its atmosphere
Employee
Ability of complaint treatment Etiquette & kindness
Knowledge about products & service External appearance & tidiness
Service process
Convenience of reservation alteration & cancel Promptness of complaint treatment
Satisfaction of food offering & service speed Management policy of restaurant
Perceived risk
Physical risk
Because of much fat, family restaurant' foods are harmful to the health.
Family restaurant's foods are the cause of digestive trouble.
I worry about family restaurant's foods for diet control.
Family restaurant's foods are the cause of adult diseases or fatness.
Time risk
Food's service speed is slow.
It's long waiting time at this restaurant.
I worry about distance to family restaurant is too long.
Speediness of complaint treatment is slow.
Financial risk
Due to lack of personal expenses, I worry about payment at restaurant.
Food's price is generally more expensive than other restaurant.
Beverage's price is generally more expensive than other restaurant.
I will control myself to use family restaurant for money problem.
Performance risk
Contrary to my expectation, menu and service were not perfect.
Because of insufficient quantity, I felt expensive food's price.
On food's remaining, I felt regrettable using restaurant.
Menu and actual food were often different.
Psychological risk
Because of confused atmosphere, I felt unpleasant.
Because of employee's over-kindness, I felt fretful.
Because food isn't suit my taste, I felt unhappy.
Because of employee's unkindness, I felt angry.
Social risk
If using family restaurant, I feel that my colleagues remind me of a unsubstantial person.
If using family restaurant, I feel that my colleagues remind me of a person with spend-thrift habits.
If using family restaurant, I feel that my colleagues remind me of a person without sense of economy.
If using family restaurant, I feel that my colleagues remind me of a boaster.
Table 1. The components of tangible clue and perceived risk
Variables Factors
Confirmatory factor analysis
Estimate S.E. C.R. p
Tangible clue
Physical evidence
v1 0.660 0.070 9.353 0.000
v2 0.861 0.063 13.012 0.000
v3 1.000 - - -
v4 0.955 0.701 13.923 0.000
v5 0.850 0.070 11.891 0.000
v6 0.812 0.063 13.221 0.000
v7 0.537 0.054 10.010 0.000
Employee
v8 0.920 0.062 12.752 0.000
v9 0.800 0.062 11.251 0.000
v10 1.000 - - -
v11 0.866 0.108 12.907 0.000
Service process
v12 1.000 - - -
v13 0.833 0.080 10.221 0.000
v14 0.351 0.064 5.456 0.000
v15 0.705 0.054 12.542 0.000
Perceived risk
Physical risk
v16 0.778 0.052 14.811 0.000
v17 0.895 0.054 16.702 0.000
v18 1.000 - - -
v19 0.821 0.052 12.323 0.000
Time risk
v20 0.700 0.046 16.512 0.000
v21 0.911 0.048 19.654 0.000
v22 0.958 0.070 11.837 0.000
v23 1.000 - - -
Financial risk
v24 0.641 0.050 12.701 0.000
v25 0.970 0.621 19.231 0.000
v26 0.927 0.049 17.589 0.000
v27 1.000 - - -
Performance risk
v28 1.000 - - -
v29 0.837 0.045 14.881 0.000
v30 0.874 0.064 16.110 0.000
v31 0.963 0.053 14.911 0.000
Psychological risk
v32 0.751 0.071 10.372 0.000
v33 0.869 0.074 11.869 0.000
v34 1.000 - - -
v35 0.778 0.070 11.360 0.000
Social risk
v36 0.862 0.062 13.855 0.000
v37 1.000 - - -
v38 0.941 0.072 12.782 0.000
v39 0.618 0.073 8.455 0.000
Overall satisfaction
v40 1.000 - - -
v41 0.833 0.052 14.791 0.000
v42 0.633 0.031 3.145 0.000
χ2=32.275, p<0.05, GFI=0.917, AGFI=0.912, PGFI=0.425, NFI=0.903, RMR=0.159
Table 2. CFA about tangible clue, perceived risk and overall satisfaction
In order to research the results of the models, we performed the structural equation model(Figure 2).
Owing to the weakness of first analysis’s adequacy, second analysis with adjustment of index limitation to 4. And good result showed like χ
2=7.012, p=
0.231(>0.05), GFI=0.945(≒1.0), AGFI=0.923(≒1.0), PG- FI=0.309, NFI=0.910(≒1.0), RMR=0.042(<0.05), RMSEA
=0.000(<0.05).
The first hypothesis(H 1) means that the three fac- tors of tangible clue influence significantly the six di- mensions of perceived risk. This hypothesis proved to be supported in that some tangible clues affected significantly parts of perceived risk. Physical evidence affected negatively(—) financial risk~estimate=—0.145, C.R.=—3.211, p=.001; performance risk~estimate=
—0.172, C.R.=—3.215, p=.001, and psychological risk~
estimate=—0.376, C.R.=—7.200, p= .000. We can infer that physical evidence reduce the psychological, per- formance and financial risk to buy foods with service at family restaurant in this research’s result. Speci- fically, it proved that physical evidence had sig- nificantly the most negative influence on the psycho- logical risk. As perception of risk is felt individually on account of different and intangible character of service, it is related to the uncertainty in the mental and psychological representation of service (Brent et al 2011). Meanwhile, regardless of whether the ser-
vice or products have a physical presence or not, it is a theory that consumer who are unable to develop a mental representation of service or products will have difficulty evaluating them (Guan 2010).
Buy the way, employee influenced negatively(—) time risk~estimate=—0.258, C.R.=—4.688, p=0.000;
performance risk~estimate=—0.294, C.R.=—5.501, p
=.000; psychological risk~estimate=—0.177, C.R.=—
3.392, p=.001, and social risk~estimate=—0.235, C.R.
=—4.215, p=.000. On researching this result, we gra- sped that tangible clues from employee affected the most negatively performance risk. According to the previous research, it proved that employee’s per- formance of service(ability of complaint treatment, etiquette and kindness, knowledge about products or service and external appearance or tidiness) in- ducted customer’s satisfaction (Pierre et al 2000; Jing
& Mitchell 2013). And Karl et al (2003) presented that a primary factor about employee effected perceived risk of customer’s purchasing decision and satis- faction in the hospitality industry.
At last, service process had negative influence on physical risk~estimate=—0.180, C.R.=—3.176, p=.001;
time risk~estimate=—0.111, C.R.=—2.009, p=.044; fi- nancial risk~estimate=—0.188, C.R.=—3.371, p=.000;
and performance risk~estimate=—0.155, C.R.=—2.909,
p=.004. In the research between intangibility and
Figure 2. The last analysis-diagram of model.
perceived risk (Laroche et al 2004; Chang & Wu 2012), researchers argued that intangibility of service generated the perceived risk of customer’s pur- chasing. And they persisted mental intangibility had the most significant effect on financial risk. Specially, on this study, service process had significantly the most negative influence on the financial risk. This means that service process has various factors of tan- gibility, and they influence positively customer’s feel-
ing of mental assurance on buying food items at family restaurant without supposition of uncertain consequence and financial loss. At last, Hypothesis 1 was partially supported.
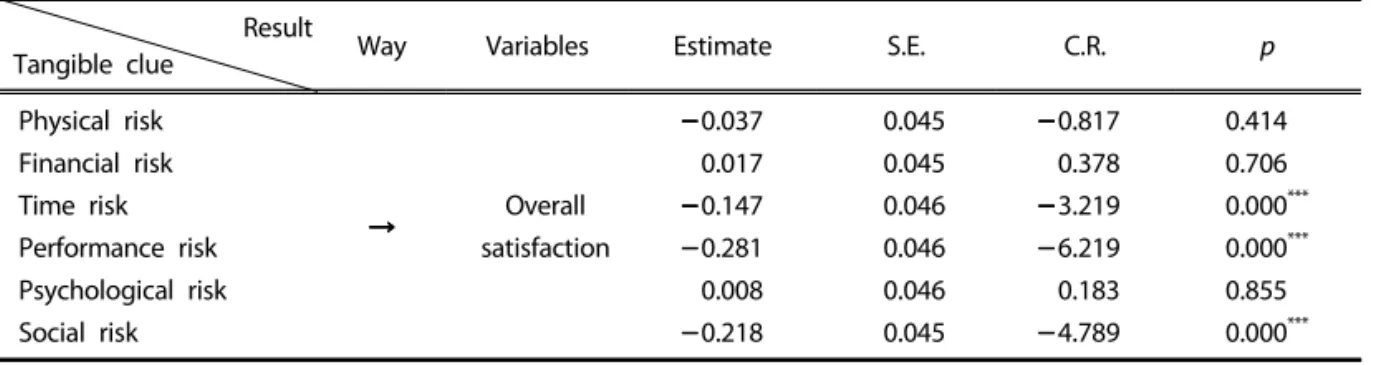
The second hypothesis(H 2) means that various perceived risks have significant influence on the cus- tomer’s overall satisfaction. Overall satisfaction was influenced negatively(—) by time risk~estimate=
—0.147, C.R.=—3.219, p=.000; performance risk~esti-
ResultTangible clue
Perceived risk Estimate S.E. C.R. p
Physical evidence
Physical risk Financial risk Time risk Performance risk Psychological risk Social risk
0.018 0.145 0.073 0.172 0.376 0.018
0.057 0.056 0.055 0.052 0.053 0.056
0.317 3.211 1.321 3.215 7.200 0.315
0.751 0.001**
0.186 0.001**
0.000***
0.753
Employ
Physical risk Financial risk Time risk Performance risk Psychological risk Social risk
0.026 0.087 0.258 0.294 0.177 0.235
0.057 0.056 0.055 0.053 0.052 0.056
0.453 1.566 4.688 5.501 3.392 4.215
0.651 0.117 0.000***
0.000***
0.001**
0.000***
Service process
Physical risk Financial risk Time risk Performance risk Psychological risk Social risk
0.180 0.188 0.111 0.155 0.073 0.057
0.057 0.056 0.055 0.053 0.052 0.056
3.371 3.371 2.009 2.909 1.409 1.026
0.001**
0.000***
0.044* 0.004**
0.159 0.305
* p<0.05, ** p<0.01, *** p<0.001
.
Table 3. Influence of tangible clue on perceived risk
Result
Tangible clue Way Variables Estimate S.E. C.R. p
Physical risk Financial risk Time risk Performance risk Psychological risk Social risk
Overall satisfaction
0.037 0.017 0.147 0.281 0.008 0.218
0.045 0.045 0.046 0.046 0.046 0.045
0.817 0.378 3.219 6.219 0.183 4.789
0.414 0.706 0.000***
0.000***
0.855 0.000***
* p<0.05, ** p<0.01, *** p<0.001
.
Table 4. Influence of perceived risk on overall satisfaction
mate=—0.281, C.R.=—6.219, p=.000, and social risk~
estimate=—0.218, C.R.=—4.789, p=.000. The time to buy or consume food items at family restaurant had significant influence on satisfaction. Namely, custom- er thinks the time as money, and especially the time to wait in the shop creates perception of the time risk (Leclerc et al 1995; Gary & Rosa 2013). And per- formance risk and social risk affected negatively(—) customer’s satisfaction. Specially, in the purchasing on the internet line, financial, psychological and per- formance risk proved to have significant influence on the customer’s satisfaction (Bobbitt & Dabholkar 2001; Youjae Yi et al 2013). Thus, Hypothesis 2 was partially supported.
CONCLUSION
This study conducted the questionnaire survey of customers at family restaurants in Seoul city and Busan city of South Korea. And this research fur- nishes theoretical and practical contributions to the service marketing and strategy literature. The results of this research provide partial support for the 2 propositions. At first, theoretical application is as follows.
This research confirmed a significant strong effect of tangible clue on the perceived risk. According to the results of analysis from tangible clue to perceived risk, ‘physical evidence’ affected negatively financial risk, performance risk and psychological risk. And
‘employee’ influenced negatively time risk, perform- ance risk, psychological risk and social risk. ‘Service process’ had negative influence on physical risk, time risk, financial risk and performance risk. In research between intangibility and perceived risk, researchers argued that intangibility of service generates the per- ceived risk of customer’s purchasing. In proportion to this result, Hypothesis 1 showed to support partially that specified tangible clue affected significantly parts of perceived risk. The previous research pre- sented the confirmation that strong mental repre- sentations and specific definitions of the products were critical to the making tangibility of services (Mittal 2002; Brent et al 2011). In the study with Laroche et al (2004), especially physical intangibility emerged as the least important dimension of overall intangibility, with significant impact emerging for
goods. And they persisted that consumer had more difficulty evaluating physical intangibility of service than goods (Chang & Wu 2012).
And overall satisfaction was influenced negatively by various perceived risks. The concept of time in service process is service duration. And this means the sum between customer’s waiting time and the time for service performance was like as total time of service delivery and contact time with customer.
Especially, customer’s waiting time at the restaurant is the original source of service delivery process (Yan et al 2013; Brent et al 2011). Therefore, food service corporation needs to improve suitable management of customer’s waiting time, service speed and speedi- ness of complaint treatment. On purchasing service, customer feels generally performance, psychological and social risk in the various perceived risk. The per- ceived risk arises in the various cases. Consumers are highly involved with the purchasing process, when there is little information about the product category (Christo 2002; Pi & Sangruang 2011), the product is new, the price is high, and the product has little or no tangible clue. Therefore, this means that these causes of customer’s perceived risk in purchasing process can be reduced by presentation of tangible clue, strengthening relation with customer and defi- nite information about service and goods.
In the second place, practical application is as follows. Physical evidences to reduce perceived risk of customer are composed of unique appearance of restaurant, differentiated interior, place for children and smoking area. Therefore food service corpo- rations need to improve these variables properly.
Meanwhile, Customers have stronger individual rela- tions with service corporate and its employees, when they are likely to feel less perceived risk (Jing &
Michell 2013). And they want to assist and support
service corporate and employee through the positive
expression of cooperation, protection and encoura-
gement for them (Manuela & Sicilia 2013). Especially,
because efforts with true service performance of em-
ployees influence positively repurchase and revisit of
customers, food service corporations need to have
best management for employee. Therefore, it is in-
troduced continuous training, education and job
satisfaction. Particularly it need to offer improvement
of job environment, promotion, fair compensation
with salary and assistance of benefits such as health insurance, pensions and employee discounts.
At last, limitations and future research of this study is as follows. The first limitation of this study was the time when collecting and gathering the questionnaire from customers at each family res- taurant. This means the considerable difference of the result according to the composition of the re- spondents(eg. the ratio of man vs. woman, house- wife and special democratic category). Therefore, we decided the compound collection time of 2 parts, namely, lunch time for eating market’s user owing to solve the physiological wants and dinner time for dinning market’s user in order to enjoy social and cultural needs. We performed questionnaire at PM.
2:00 to PM. 5:00 and PM. 7:00 to PM. 9:00 for 2 for two months.
Because of limited area collecting questionnaire in 2 cities. It means that this research may not be eva- luated as the study for whole South Korea. Therefore, this study hopes to perform at various cities and areas in the future research.
The various forms exist in the hospitality industry, namely service sector, and each service sector has peculiar degree of tangibility, intangibility and other service’s characters. Among the hospitality industry, the part of restaurant, while classified as a service, al- so has many tangible components such as the food, the packaging, and so on, namely means hybrid be- tween tangibility and intangibility. This proposes the meaning that a significant difference of result is able to happen in same study with another service sector.
Therefore, the continual research concerns the sub- ject that the study of comparison with various ser- vice sectors needs to be carried out in the future.
REFERENCES
Brent Lynn Selby Coker, Nicholas Jeremy Ashill, Beverley Hope (2011). Measuring internet prod- uct purchase risk. European Journal of Marketing 45(7/8):253-261.
Bitner MJ (1990). Evaluating service encounters: the effects of physical surroundings and employee responses. Journal of Marketing 54(2):69-82.
Bobbitt LL, Dabholkar PA (2001). Integrating attitudi- nal theories to understand and predict use of
technology-based self-service. International Jour- nal of Service Industry Management 12(5):423- 450.
Chang ML, Wu WY (2012). Revisiting perceived risk in the context of online shopping : an alternative perspective of decision-making styles. Psychol- ogy, Marketing 29(5):35-47.
Christo Boshoff (2002). Service advertising : An ex- ploratory study of risk perceptions. Journal of Service Research 4(4):290-298.
Dowling GR, Staelin R (1994). A model of perceived risk and risk handling activities. Journal of Consu- mer Research 21:119-134.
Douglas West, Gerard P Prendergast (2009). Advertis- ing and promotions budgeting and the role of risk. European Journal of Marketing 43(11/12):141- 151.
Gary Davies, Rosa Chun (2013). Employee as symbol : stereotypical age effects on corporate brand associations. European Journal of Marketing 46(5):
33-42.
Guan Ru Chen (2010). The risk reduction role of ad- vertising in relation to price rigidity. European Journal of Marketing 44(11/12):123-136.
Jing Yang Zhong, Mitchell VW (2013). When having is not enough: implications of being satisfied.
European Journal of Marketing 47(11/ 12):55-73.
Karl J Mayer, John T Bowen, Margaret T Moulton (2003), A proposed model of the descriptors of service process. The Journal of Services Marketing 17(6/7):621-636.
Klerck D, Sweeney JC (2004). The effect of knowledge types on consumer-perceived risk and adoption of genetically modified foods. Psychology, Mar- keting 24(2):314-325.
Laroche M, Gorcon HG, McDougall, Jasmin Bergeron, Zhiyong Yang (2004). Exploring how intangibi- lity affects perceived risk. Journal of Service Re- search 6(4):373-389.
Leclerc France, Schmitt Bernd H, Dube Laurette (1995). Waiting time and decision making: Is time like money? Journal of Consumer Research 22(1):
110-119.
Manuela López, Sicilia María (2013). How WOM mar- keting contributes to new product adoption:
Testing competitive communication strategies.
European Journal of Marketing 47(7):272-284.
Martin SS, Camarero C (2009). How perceived risk af- fects online buying. On Line Information Review 33(4):223-231.
Mittal B (2002). Services communications: from mind- less tangibilization to meaningful messages. Jour- nal of Services Marketing 16(5):421-431.
Mitchell VW, M Greatorex (1993). Risk perception and reduction in the purchase of consumer services.
The Service Industries Journal 13:179-200.
Mitchell VW, MK Hogg (1999). Consumer perceived risk: conceptualizations and models. European Journal of Marketing 33(1/2):163-195.
Pierre Chandon, Brian Wansink, Gilles Laurent (2000).
A benefit congruency framework of sales promo- tion effectiveness. Journal of Marketing 64(4):
65-81.
Pi SM, Sangruang J (2011). The perceived risks of on- line shopping in Taiwan. Social Behavior and Personality 39(2):87-97.
Rafiq M, PK Ahmed (1995). Using the 7Ps as a generic marketing mix: An exploratory survey of UK and European marketing academics. Marketing Intelli- gence, Planning 13(9):4-15.
Shim SI, Lee Y (2011). Consumer's perceived risk re- duction by 3D virtual model. International Journal of Retail, Distribution Management 39(12):107- 118.
Srivastava K, Sharma NK (2011). Exploring the multi- dimensional role of involvement and perceived
risk in brand extension. International Journal of Commerce, Manmagement 21(4):49-57.
Stone RN, Görnhaug Kjell (1993). Perceived risk : Further considerations for the marketing dis- cipline. European Journal of Marketing 27(3):39- 50.
Xuemei Bian, Luiz Moutinho (2011). The role of brand image, product involvement, and knowledge in explaining consumer purchase behaviour of coun- terfeits : Direct and indirect effects. European Journal of Marketing 45(1/2):55-68.
Yan Huang, Harmen Oppewal, Felix Mavondo (2013).
The influence of ethnic attributes on ethnic con- sumer choice of service outlet. European Journal of Marketing 47(5/6):143-160.
Yelkur R (2000). Customer satisfaction and the ser- vices marketing mix. Journal of Professional Ser- vices Marketing 21(1):105-110.
Youjae Yi, Hoseong Jeon, Beomjon Choi (2013). Se- gregation vs aggregation in the loyalty program:
the role of perceived uncertainty. European Jour- nal of Marketing 47(8):203-219.
Zeithaml VA, MJ Bitner, DD Gremler (2006). Services Marketing. McGRAW. HILL 4th. 54-75.
Received: 19 August, 2015 Revised: 15 September, 2015 Accepted: 15 October, 2015
유형적 근거가 지각된 위험 및 총만족에 미치는 영향 (패밀리레스토랑 고객을 대상으로)
윤태환1) 이강춘2) 최영준1)
1)
경동대학교 관광학부,
2)¶경남정보대학교 호텔조리학과
국문초록