한국컴퓨터정보학회 하계학술대회 논문집 제19권 제2호 (2011. 6)
351
The Characteristics of Degradation in Epoxy Composites for Molding Materials of PT
Geon-Ho Park○
○School of Mobile Technology, Chungkang College of Cultural Industries e-mail: [email protected]
● ABSTRACT ●
The electrical degradation phenomena of epoxy composites to be used as a molding material for transformers were studied. The electrets were first manufactured by applying high voltages to five kinds of specimens given a mixing rate, and then TSC(Thermally Stimulated Current) values at the temperature range of -160~200[℃] were measured from a series of experiments. The behaviour of carrier and its origin in epoxy composites were examined, respectively.
And various effects of electrical degradation on epoxy composites were also discussed in this study.
Keyword: degradation phenomena, Epoxy Composites, TSC(Thermally Stimulated Current)
Ⅰ. INTRODUCTION
As the scale of a power delivery system is increased, the insulating design techniques such as a materialization of high electric field and a security of reliability in insulating composition are required accordingly.
The main purpose of this research is to study the TSC values in electrical stressed epoxy composites and interrelationship between electrical stress and material degradation. The TSC values associated with the determination of the currents which were released from poled specimens were measured as a function of temperature. Poling was accomplished by placing the specimen under a high DC stress and followed by cooling with liquid nitrogen to freeze the molecular motion of the polymer, resulting in immobilizing the charges.
When the specimens are warmed slowly, the trapped charges are released. By measuring the amount of charge released and their release characteristic temperature, inferences on the space charges which form in the polymer can be made.
It has been noticed that peak temperatures for a given heating rate depend on a variety of factors such as age of the specimen, thermal history, and charge density. To investigate the effect of the electrical degradation on properties of epoxy composites, the TSC spectra were measured as a function of temperature and the various aspects of electrical degradation effects were analyzed.
Ⅱ. EXPERIMENTAL
1. Specimens
The specimens used in this study were designed to have a constant mixing rate in the epoxy resin of Bisphenol-A type and the MeTHPA. Bisphenol-A type is in liquid phase at room temperature, and the MeTHPA is a hardener of acid hydro-anhydride system.
Also, the DY-040 and the SiO2 with amount of 5wt% are then added to improve both the impact strength and the machinery strength. and the silane coupling agents, which belong to an amino silane system have been used for surface treatment of fillers.
2. Design of Mixing Ratio
Since the electrical and physical properties of epoxy composites depend greatly on the mixing ratio among resin, hardener and filler, as well as the hardening conditions[1]~[2], these aspects need to be considered in manufacturing specimens. The design parameters and their condition used for this study are summarized in Table 1.
Samples Epoxy Hardener DY
-040 Filler Curing Condition
H 70FN 100 70 10 0 ▶1st Curing;
100[℃]×4[hr]
▶2nd Curing;
140[℃]×10[hr]
▶Deg. Curing;
140[℃]×240[hr]
H100FN 100 100 10 0
H130FN 100 130 10 0
H100F60 100 100 10 60
SH100F60 100 100 10 60
Table 1. Mixing Ratio [wt%]
한국컴퓨터정보학회 하계학술대회 논문집 제19권 제2호 (2011. 6)
352
3. Experimental Method
After the samples were degraded by appling high voltages, 22.9[㎸/㎝], during 5[hr], the electrets[3]~[4] were formed by appling a electric field, 10[㎸/㎝], to epoxy composites and then TSC spectra were measured at the temperature range of -160~200[℃] with a step of 5[℃/min]. A Schematic drawing of the experimental apparatus to be used for TSC values is given in Fig. 1.
Fig. 1. Experimental Apparatus
Ⅲ. RESULTS AND DISCUSSION
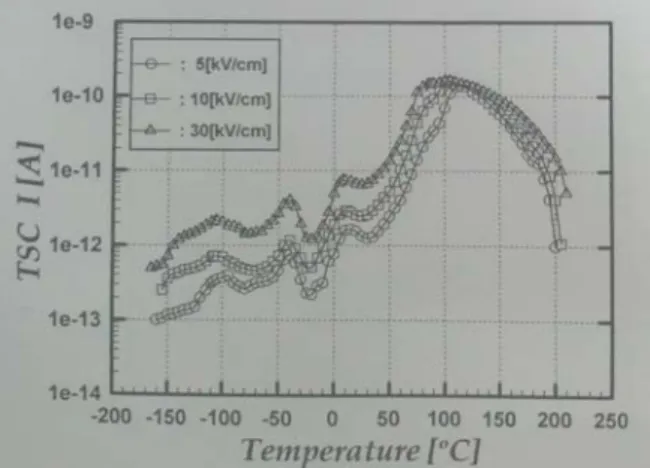
1. TSC Spectra due to Forming Electric Field Fig. 2 shows TSC spectra formed at 5, 10, and 30[㎸/㎝], which were observed from electrets for the 1st cured(100 [℃]×4[hr]) H100FN.
Similarly, Fig. 3 includes TSC spectra formed at 5, 10, and 30[㎸/㎝], using the 2nd cured(140[℃]×1[hr]) H100FN.
From the experimental study, the five peaks of δ, γ, β, α1 and α2 were obtained at the temperature of -100[℃], -40[℃], 20[℃], 100[℃] and 130[℃], respectively. The first three peaks which are observed at the region of low temperature below the glass transition temperature(Tg) are relaxation peaks due to the action of side chain or terminal radical.[5]
Also, both the α1 peak near 100[℃] and the α2 peak above Tg are peaks caused by ionic space charge. The causes of these peaks are as follows:
(1) Since the δ peaks have been suggested by either a methyl radical or a non-acted epoxy radical, the overall size of peaks is not so big. From the molecular structure, it is observed that the methyl radical is independently operated in proportion to the level of hardener added and it also affects curing reaction.
(2) The γ peak is produced by the mixture of hydroxyether
radical, methoxy radical, aliphatic ether radical, and aromatic ether radical which is related to hardener. Also, as the amount of hardener is increased, the size of peak is getting bigger likewise the δ peak.
(3) The β peak appears to be resulted from aromatic ether radical which is thermally oxided through the procedure of maximum reaction.
(4) The α1 peak is believed to be the effects from the virtue of molecule which is related to glass transition temperature.
(5) The α2 peak which is observed at the highest temperature is generated by the ionic space charge which is accumulated by impurities or inside defects.
Fig. 2. The Dependence on Forming Electrical Strength in the 1st Cured H100FN Samples
Fig. 3. The Dependence on Forming Electrical Strength in the 2nd Cured H100FN Samples
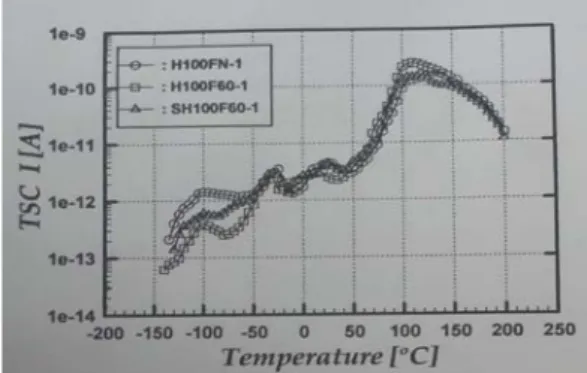
2. TSC Spectra due to Electrical Stress
TSC spectra, which are divided according to curing time and observed from electrets degraded by appling electrical stress, are shown in Fig. 4 and 5.
It is noted that in the case of the longest curing time, the
한국컴퓨터정보학회 하계학술대회 논문집 제19권 제2호 (2011. 6)
353 size of the α peak which is shown above 100[℃] is smaller
than those of 1st cured specimens and 2nd cured specimens.
Particularly, the amplitude among samples is not significant below Tg and this result implies that the radicals shown at low temperature are affected by electrical stress.[6]~[7]
On the other hand, molecular motion become dull because of excessive hardener, and the peak size of H130FN is decreased above Tg. Also, Im of SH100F60 is reduced above Tg but that of H100F60 is not reduced because of improving deformation of interfacial state.
(a) 1st Curing <100[℃]×4[hr]>
(b) 2nd Curing <140[℃]×10[hr]>
(c) Degradation <140[℃]×240[hr]>
Fig. 4. TSC Spectra according to Hardener
(a) 1st Curing <100[℃]×4[hr]>
(b) 2nd Curing <140[℃]×10[hr]>
(c) Degradation <140[℃]×240[hr]>
Fig. 5. TSC Spectra according to Filler
Ⅳ. CONCLUSION
In order to understand the degradation characteristics of epoxy composites due to electrical stress, TSC spectra were measured at the temperature range of -160~200[℃]. From a series of experiments, five peaks including δ, γ, β, α1 and α2 were obtained at the temperature of -100℃, -40℃, 20℃, 10 0℃, and 130℃, respectively. Results of this study indicates that (1) the δ peak is resulted from the methyl radical; the γ peak is produced due to the mixture by hydroxyether radical, methoxy radical, aliphatic ether radical and aromatic ether radical; the β peak is obtained from aromatic ether
한국컴퓨터정보학회 하계학술대회 논문집 제19권 제2호 (2011. 6)
354
radical; the α1 peak is possibly due to molecule which is related to glass transition temperature; and the α2 peak seems to turn up by the ionic space charge, and (2) in the case of the longest curing time, the size of the α peak which is shown above 100[℃] is smaller than those of 1st cured specimen and 2nd cured specimens. Particularly, the amplitude among samples is not significant below Tg and this result implies that the radicals shown at low temperature are affected by electrical stress. And, molecular motion become dull because of excessive hardener, and the peak size of H130FN is decreased above Tg. Also, Im of SH100F60 is reduced above Tg but that of H100F60 is not reduced because of improving deformation of interfacial state.
REFERENCES
[1] G. M. Sessler, “Electret”, Springer-Verlag, pp.81~201, 1980
[2] T. Takahama, O. Hayashi, F. Sato, “Electric Strength of Epoxide Resins and its Relation to the Structure”, J. Appl. Poly. Sci., Vol.26, pp.2211~2220, No.5, 1981
[3] J. V. Duffy and G. F. Lee, “The Effect of Steric Hinderance on Physical Properties in an Amine-Cured Epoxy”, J. Appl.
Poly. Sci., Vol.35, pp.1367~1375, 1988
[4] M. Ochi, M. H. Okasaki, M. Shimbo, “Mechanical Relaxation Mechanism of Epoxide Resins Cured Aliphatic Diamines”, J. Poly. Sci., Phys. Ed., Vol.20, pp.689~699, 1982 [5] L. Simoni, “A General Approach to the Endurance of Electrical
Insulation under Temperature and Voltages”, Colloid &
Polymer Sci., 260, pp.297~302, 1982
[6] R. Schifani, “Surface Discharge Effects on Dielectric Properties of Epoxy Resins”, IEEE Trans. Electr. Insul., Vol.EI-18, pp.504~512, No.5, Oct., 1983
[7] S. S. Sastry, G. Satyanandam, “Effects of Fillers on Electrical Properties of Epoxy Composites”, J. Appl. Poly. Sci., Vol.26, pp.1607~1615, 1988
![Table 1. Mixing Ratio [wt%]](https://thumb-ap.123doks.com/thumbv2/123dokinfo/4832836.525698/1.892.460.785.996.1135/table-mixing-ratio-wt.webp)