1. Introduction
The detection and attribution of global climate change resulting from anthropogenic activities is one of the main themes of current climate research (Bonsal et al., 2001). The Intergovernmental Panel on Climate Change (IPCC) concluded that anthro- pogenic effects have discernibly influenced the glob-
al climate. One such effect is a rise in global mean temperature of 0.6±0.2˚C since the second half of the 19thcentury (Houghton et al., 2001). However, the trend has been uniform neither spatially nor temporally and a rise in the mean would not neces- sarily lead to a rise in extreme events. If the change in mean is related to a shift in distribution then a major impact on society and ecosystems could
* This work has supported by the faculty research fund of Konkuk University.
** Assistant Professor, Dept. of Geography, Konkuk University, Seoul, Korea, [email protected]
Trends on Temperature and Precipitation Extreme Events in Korea*
Youngeun Choi**
한국의 극한 기온 및 강수 사상의 변화 경향에 관한 연구*
최 영 은**
Abstract : The aim of this study is to clarify whether frequency and/or severity of extreme climate events have changed significantly in Korea during recent years. Using the best available daily data, spatial and temporal aspects of ten climate change indicators are investigated on an annual and seasonal basis for the periods of 1954-1999. A systematic increase in the 90thpercentile of daily minimum temperatures at most of the analyzed areas has been observed. This increase is accompanied by a similar reduction in the number of frost days and a significant lengthening of the thermal growing season. Although the intra-annual extreme temperature range is based on only two observations, it provides a very robust and significant measure of declining extreme temperature variability. The five precipitation-related indicators show no distinct changing patterns for spatial and temporal distribution except for the regional series of maximum consecutive dry days. Interestingly, the regional series of consecutive dry days have increased significantly while the daily rainfall intensity index and the fraction of annual total precipitation due to events exceeding the 95thpercentile for 1961-1990 normals have insignificantly increased.
Key Words : temperature and precipitation extremes, climate change indicators, frost days, thermal growing season length, intra-annual extreme temperature range, maximum consecutive dry days
요약: 기상과 관련된 재해의 직접 원인이 되는 극한 기후 사상의 발생 빈도 및 강도의 변화 경향을 파악하는
것이 본 연구의 목적이다. 일최저기온, 일최고기온, 일강수량 자료를 이용하여, 10개 기후 변화 지시자를 산출하였 고, 그 변화 경향의 공간 분포를 파악하였다. 일최저기온을 이용하여 산출된 온난야의 발생 빈도는 한반도에서 증가하는 추세를 나타냈고, 최저기온의 증가로 인하여 서리일수는 감소하고 생장기간은 증가하였다. 매해의 일최 저기온과 일최고기온의 차로 산출되는 연극한기온교차는 최고기온은 변화하지 않았지만, 최저기온의 증가로 인 하여 감소하고 있다. 강수와 관련된 지시자들은 기온 관련 지시자에 비하여 변화 경향이 뚜렷하지 않지만, 무강 수일수의 한반도 시계열은 감소하는 경향이 나타났고, 호우지수로 분류될 수 있는 강수강도는 증가하고 있다.
주요어 : 기온과 강수 극한사상, 기후 변화 지시자, 서리일수, 생장기간, 연극한기온교차, 최대 무강수일수
result.
IPCC Third Assessment Report (Houghton et al., 2001) has defined an extreme weather event as fol- lowing:
“An extreme weather event is an event that is rare within its statistical reference distribution at a partic- ular place. Definitions of “rare” vary, but an extreme weather event would normally be as rare or rarer than the 10th or 90th percentile. By definition, the characteristics of what is called extreme weather may vary from place to place. An extreme climate event is an average of a number of weather events over a certain period of time, an average which itself is extreme (e.g. rainfall over a season).”
Changes of climate extremes should be consid- ered as critical factors toward an improved under- standing of past and potential future global climate change. Various indicators for monitoring change in climate extremes have been developed through a number of international workshops and leading research centers (Jones et al., 1999; Nicholls and Murray, 1999; Manton et al., 2001; Frich et al., 2002) as increasingly, climate change detection and attribu- tion studies have focused on changes in extreme events. One problem in examining extreme events is that long-term time series of reliable and homoge- neous daily values are required to describe accurate- ly the spatial and temporal characteristics of daily and extreme events (Manton et al., 2001). Recently, several observational analyses involving daily and/or extreme temperature trends and variability over various regions of the globe have been identi- fied. Most of the findings reveal significant decreases in frequency of days with extreme low daily temper- ature but significant increases in the number of heavy precipitation events (Easterling et al., 2000;
Bonsal et al., 2001; DeGaetano and Allen, 2002).
Likewise, several studies have examined trends on temperature and precipitation, particularly changes in average conditions, over Korea. The mag- nitude of trends varies due to differences in study period, stations, and of methods used for analyses.
The observed mean annual temperature shows a warming trend in Korea with a rate of 0.23˚C/
decade and all seasons reveal positive trends both on maximum and minimum temperatures (Jung et al., 2002). Furthermore, trends are stronger in winter than in summer. Only a few studies on the behavior of extreme events in Korea have been conducted.
Choi (2002) demonstrated that the increases of pre- cipitation totals in the southern part of Korea mainly resulted from the extreme events showing that pre- cipitation days with < 20 mm/day (the long-term 90thpercentile) have drastically decreased while those with ≥ 20mm/day have increased.
The aim of this study is to clarify whether fre- quency and/or severity of extreme climate events have changed significantly in recent years.
Indicators for monitoring changes in climatic extremes worldwide are those recommended by the Statistical and Regional dynamical Downscaling of Extremes for European regions (STARDEX) research project. This method will compare the magnitude of trends with results from other parts of the world.
Emphasis is placed on analyzing trends and vari- ability in the extreme ends of the daily temperature and precipitation distribution. Using the best avail- able daily data, spatial and temporal aspects of the daily and extreme variables are investigated on an annual and seasonal basis for the periods of 1954- 1999.
2. Methodology
The World Meteorological Organization the Commission for Climatology/ Climate Variability and Predictability (WMO CCL/CLIVAR) Joint Working Group on Climate Change Detection rec- ommended that a list of ten simple and feasible indices be produced shown in Table 1 (Frich et al., 2002). It was also emphasized that development of indices should focus on indicators that are not high- ly correlated and indices should be also considered
on a regional basis. Further consideration should also be given to measure changes in climate variabil- ity on a variety of space and time scales. Among the ten indicators, the first five are related with the tem- perature field while the last five are relate to the pre- cipitation field.
Generally, linear trend analyses of very rare events do not give significant results on traditional seasonal and regional scales, and time series would rarely provide the robustness needed (Fomby and Vogelsang, 2002; Frich et al., 2002). Because robust- ness is a key requirement, the selection of less extreme, and less noisy, but hopefully more robust indicators will be selected for this study.
1) The Selection of Indicators and Data
This study focuses on temperature and precipita- tion regimes. The indices presented in Table 1 poten- tially can cover many aspects of a changing global cli- mate. Tn90 is the percentage of observations exceed- ing the daily 90thpercentile for the 1961-1990 base period and identifies warm nights during the year.
Frost days can be sampled from the winter half-year in all extratropical regions and the intra-annual extreme temperature range uses the most extreme maximum temperature event of the summer season and the most extreme minimum temperature event of
the winter season. The heat wave duration index sam- ples the daytime maxima throughout the year.
Length of the thermal growing season (GSL) samples spring and autumn anomalies in the higher latitudes.
The criteria for including indicator time series based on daily data was that a year was considered missing in a station record if it contained > 10 percent missing daily values or > 3 months during the years contained
> 20 percent missing daily values. Furthermore, each station record also must have at least 40 years data between 1954 and 1999. The 14 stations that meet these criteria are shown in Figure 1.
2) The Selection of Statistical Methods
Before describing the direction and magnitude of trends at each station, the geographical pattern of trend for each index was examined. This provides a clear picture of the spatial variation in the direction of trends and their statistical significance. The Kendall-tau test was used to test significance of the trend. All trends noted as significant were significant at 95 or 99 percent level.
Two methods were also employed to analyze each of the extreme indicator series. The first method compares the average of two 23-year periods by means of a t-test. The second method aims to spatial- ly average the results of each indicator time series.
Table 1. Suggested 10 indicators for monitoring change in climate extreme worldwide (after Frich et al., 2002)
Indicator Definition Unit
Tn90 Percent of time Tmin>90thpercentile of daily minimum temperature(Tmin) % Fd Total number of frost days (days with minimum temperature < 0˚C)days ETR Intra-annual extreme temperature range: difference between the highest temperature observation of any
0.1 K given calendar year (Th) and the lowest temperature reading of the same calendar year (Tj)
GSL Growing season length: period between when daily mean temperature(Tday) > 5˚C for >5 days and Tday< 5˚C for >5 days days HWDI Heat wave duration index: maximum period > 5 consecutive days with maximum temperature(Tmax) > 5˚C
above the 1961-1990 daily Tmaxnormal days
R10 No. of days with precipitation ≥ 10 mm day-1 days
CDD Maximum number of consecutive dry days (Rday< 1mm day-1)days
R5d Maximum 5-day precipitation totals mm
SDII Simple daily intensity index: annual total/number of Rday>1mm day-1 mm day-1 R95T Fraction of annual total precipitation due to events exceeding the 1961-1990 95thpercentile %
Indicator Definition Unit
Time series of the central area were constructed using four stations and those of the southern area were constructed using eight stations (Table 2). Time series of Korea were constructed using 14 stations.
Two island stations, Jeju and Ulleungdo, were includ- ed to construct the Korea series, but excluded for the regional series.
3. Results
1) Temperature Extremes (1) Warm Nights
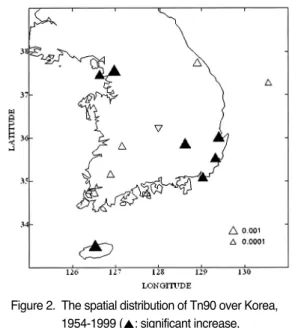
The percentage of time when the daily minimum temperature is above the 90thpercentile of the daily 1961-1990 normal (Tn90), can be a direct measure of the number of anomalously warm nights. This indi-
cator could reflect potential harmful effects of the absence of nocturnal cooling, a main contributor to heat related stress and a greenhouse gas-forced cli- mate resulting from additional humidity and cloud cover being available for nocturnal condensation (Frich et al., 2002). The trend of nocturnal warming across most of Korea is clear from the Tn90 indicator map (Figure 2). Eight out of 14 stations experience statistically significant changes of mean Tn90 during recent years. Generally, the frequency of warm mini- mum temperature extremes has increased world- wide over the comparison period (Easterling et al., 2000; Frich et al., 2002). This variable can be a better indicator of change in anomalously warm nights here because it occurs more frequently than nights when the minimum temperature exceeds 25˚C. The Figure 1. The geographical location of stations used for
this study
Table 2. The list of stations used to construct regional time series Stations
Central area Gangneung(105), Seoul(108), Incheon(112), Chupungnyeong(135)
Korea Southern area Pohang(138), Daegu(143), Jeonju(146), Ulsan(152), Kwangju(156), Busan(159), Mokpo(165), Yeosu(168)
Jeju(184), Ulleungdo(115)
Stations
Figure 2. The spatial distribution of Tn90 over Korea, 1954-1999 (▲: significant increase,
▼: significant decrease, △: insignificant increase, ▽: insignificant decrease)
frequency of such tropical nights was highest over the southern area with 5-15 days. The central area has 0-6 such days during the period of 1954-1999, and the variability of tropical nights was greater than Tn90.
Figure 3 shows the variation of annual percentage of Tn90 with a 11-year moving average for (A) Korea;
(B) central area; and (C) southern area. All time series showed similar variations with increasing trends.
Table 3 shows the results of t-tests of regional Tn90 frequency series. Clearly, warm nights in Korea are increasing in frequency both regionally and at indi- vidual stations during the recent years, probably due to global warming.
(2) Extreme Temperature Range
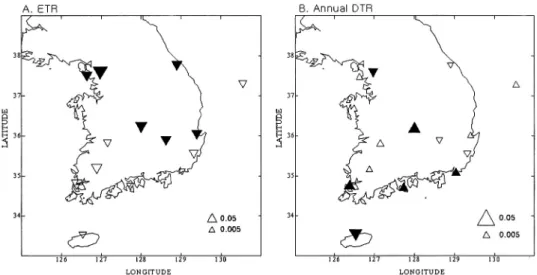
Intra-annual extreme temperature range (ETR) is the difference between the highest temperature observation of any given calendar year and the low- est temperature of the same calendar year. It is a simple but useful measure of temperature range for each year. ETR is expected to decrease as a direct result of increased nocturnal warming under clear sky conditions and an additional decrease may be expected from reduced daytime solar insolation through a thickening cover of cirrus clouds (Frich et al., 2002). The spatial distribution of ETR shows a consistently significant decline over Korea (Figure 4A) at 6 of the 14 stations. Four stations among 6 sta- tions came from the central area and the magnitudes of decreasing trends are larger at stations from the central area.
Several previous studies have identified decreas- ing trends in diurnal temperature range (DTR) throughout a large area of globe over recent decades, largely because minimum temperatures have increased more than maximum temperatures (Karl et al., 1993; Easterling et al., 1997). Figure 4(B) shows the trends of annual DTR over Korea during recent years; half of the stations experienced increas-
Table 3. The results of t-tests of Tn90 between 1954- 1976 and 1977-1999
Region Mean difference (%)T value Sig. (2-tailed)
Korea -.024 -2.547 .018*
Central area -.024 -2.983 .007**
Southern area -.023 -2.260 .034*
**: significant at 99 percent level, *: significant at 95 percent level
Region Mean difference (%) T value Sig. (2-tailed) C. Southern Area
25 20 15 10 5
01950 1960 1970 1980 1990 2000
Year
Percent
A. Korea 25
20 15 10 5
01950 1960 1970 1980 1990 2000
Year
Percent
B. Central Area 25
20 15 10 5
01950 1960 1970 1980 1990 2000
Year
Percent
Figure 3. The variation of annual Tn90, 1954-1999 (Bold curve: 11-year moving average): A. Korea, B.
Central area, and C. Southern area
es. ETR shows more consistent changes over Korea than DTR, thereby suggesting that it can be a better indicator to define the impact of climate change on the regional climate.
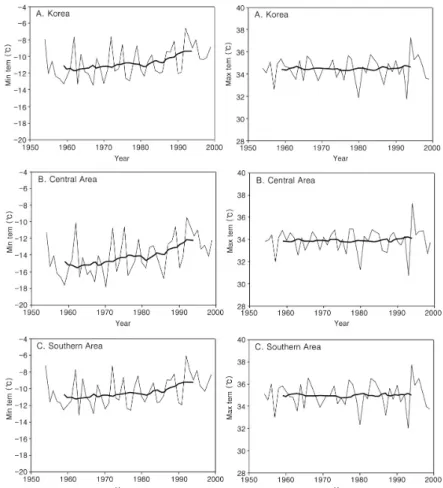
Figure 5 shows the annual variation of the lowest minimum and the highest maximum temperature for each year at Korea, central area and southern area. All three regions show an evidence of an increase in the lowest minimum temperature, partic- ularly after the 1980s. On the other hand, insignifi- cant changes in the high maximum temperature series were observed. It can be said that the decrease of ETR is mainly attributed to the increase of low minimum temperature. As shown in Table 4, the magnitude of the low minimum temperature changes in the central area is about 0.69˚C/decade higher than that for the southern area.
(3) Frost Days
Frost days (FD) are defined as total number of days per year with minimum temperature ≤ 0˚C.
Effects on agriculture, gardening, and recreation, especially in extra-tropical regions, are important and the meaning of FD is easily understood by gen- eral public. FD is hypothesized to be decreased as a
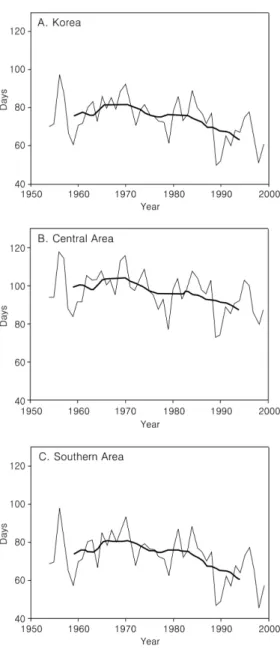
result of a general increase in local and global tem- perature. The annual number of frost days shows a near-uniform decrease over the second part of the 20thcentury over Korea (Figure 6). Most of stations also show significant decreases during the latter 23- year period as compared with a previous 23-year period except for a few stations. Figure 7 shows the variation of FD for each regional series indicating more distinct decreasing trends for the central area.
(4) Heat Wave Duration
Heat wave duration (HWD) index is defined as the maximum number of consecutive days in a year (exceeding five) with Tmax> 5˚C above the 1961-1990 daily maximum temperature(Tmax) normal. This variable has been linked with mortality statistics.
Heat waves are expected to increase in length and severity over time due to a direct effect of reduced soil moisture in some regions. Significantly longer HWD has been observed in Korea, especially over the western part (Figure 8).
(5) Growing Season Length
Growing season length (GSL) is the period when Tmin> 5˚C for at least five consecutive days and Tday
< 5˚C for five consecutive days and is expected to be Figure 4. The spatial distribution of intra-annual extreme temperature range (A. ETR, left panel) and annual diurnal
temperature range (B. Annual DTR, right panel) over Korea, 1954-1999
increased due to a direct result of increasing temper- ature. A lengthening of the thermal growing season has been observed throughout Korea (Figure 9). A significant increase in GSL has been observed over
Figure 5. The annual variation of the lowest minimum temperature (left panel) and the highest temperature (right panel), 1954-1999
Table 4. Trends in the lowest minimum and highest maximum temperature for Korea along with central and sothern area, 1954-1999
Region Lowest minimum Highest maximum temperature temperature
Korea -0.050* +
Central area -0.069** +
Southern area -0.046* -
**: significant at 99 percent level, *: significant at 95 percent level
Region Lowest minimum Highest maximum temperature temperature
Figure 6. The spatial distribution of FD over Korea, 1954-1999
major parts of the Northern Hemisphere mid-lati- tudes (Frich et al., 2002). Growing season indices defined here are generally not appropriate for the relatively warm climate areas. A few stations over the extreme southern part of Korea would be consid- ered to be in permanent growing conditions.
2) Precipitation Extremes
Five precipitation-related indicators have been
examined. R10 is the number of days per year with precipitation ≥ 10 mm a day while CDD is the max- imum number of consecutive dry days in the year (Rday< 1 mmd-1). R5d is the maximum annual five- day precipitation totals, SDII is the simple daily intensity index (annual total/number of Rday> 1 mm day-1), and R95T is the fraction of annual total pre- cipitation due to events exceeding the 1961-1990 95th
Figure 9. The spatial distribution of GSL over Korea, 1954-1999
Figure 8. The spatial distribution of HWD over Korea, 1954-1999
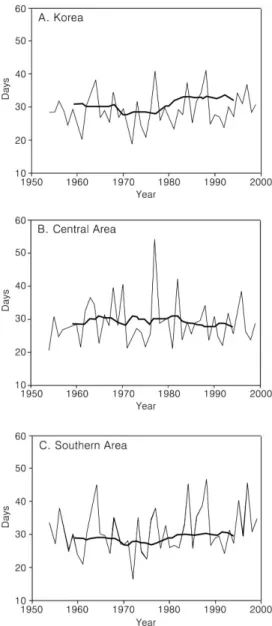
Figure 7. The variation of FD, 1954-1999
percentile. CDD can be used as a drought indicator while R95T and R10 can be heavy rainfall indicators.
Among them, maximum number of consecutive dry days (CDD) showed more distinct trends for the regional series, especially in the southern area, where a statistically-significant temporally-increas- ing trend of CDD occurred (Figure 10). By contrast, a decreasing trend over the central area was observed, although those trends mostly were not statistically significant. Thus, an increased possibility of droughts seems to exist over the southern area, com- pared with the central region (Table 5). The increase in the southern regional CDD series resembles the trend for Korea as a whole.
The R95T showed no significantly-increasing or decreasing trends for the spatial distribution except for a few stations. Also, all three regional series showed insignificantly-increasing trends on an annu- al and summer basis (Table 6). When comparing the first 23 years and the last 23 years, the annual and summer Korea series have been statistically increased. Thus, the southern area may experience more extreme events, including a possible increase in severe floods and increase in drought in the future.
4. Summary and Conclusions
A systematic increase in the 90thpercentile of daily minimum temperatures, warm nights, throughout most of the analyzed areas over Korea has been observed. This increase is accompanied by a similar reduction in the number of frost days and a signifi- cant lengthening of the thermal growing season.
Although the intra-annual extreme temperature is based on only two observations, it provides a very robust and significant measure of declining extreme temperature variability. This particular indicator is considered a direct measure of anthropogenic impacts on the global atmosphere.
The five precipitation-related indicators show no distinct changing patterns for spatial and temporal
Figure 10. The variation of CDD, 1954-1999
Table 5. Trends in CDD for Korea along with the central and southern area, 1954-1999
Region Trend
Korea .310**
Central area -.249
Southern area .339**
**: significant at 99 percent level.
Region Trend
distribution except for the regional series of the max- imum number of consecutive dry days.
Interestingly, the regional series of CDD have increased significantly while the daily intensity index and the fraction of annual total precipitation due to events exceeding the 1961-1990 95thpercentile have insignificantly increased in the southern part of Korea. Thus, if similar trends continue into the future, the southern area may experience more extreme events under continued global warming scenarios, with possible increases in severe floods or drought.
References
Bonsal, B.R., Zhang, Z., Vincent, L.A. and Hogg, W.D., 2001, Characteristics of daily and extreme temperatures over Canada, Journal of Climate, 14, 1959-1976.
Choi, Y., 2002, Trends in daily precipitation events and their extremes in the southern region of Korea, Journal of Environmental Impact Assessment, 11, 189-203.
DeGaetano, A.T. and Allen, R.J., 2002, Trends in twentieth-century temperature extremes across the United States, Journal of Climate, 15, 3188-3205.
Easterling, D.R., Horton, B., Jones, P.D., Peterson, T.C., Karl, T., Parker, D., Salinger, J., Razuvayev, V., Plummer, N., Jamason, P.
and Folland, C., 1997, Maximum and mini- mum temperature trends for the globe, Science, 277, 364-366.
Easterling, D.R., Meehl, G.A., Parmesan, C., Chagnon, S.A., Karl, T. and Mearn, L.O., 2000, Climate extremes, observation, model- ing and impact, Science, 289, 2068-2074.
Fomby, T.B. and Vogelsang, T.J., 2002, The applica- tion of size-robust trend statistics to global warming temperature series, Journal of Climate, 15, 117-123.
Frich, P., Alexander, L.V., Della-Marta, P., Gleason, B., Haylock, M., Tank., A.M.G.K., and Peterson, T., 2002, Observed coherent changes in climatic extremes during the sec- ond half of the twentieth century, Climate Research, 19, 193-212.
Houghton, J.T., Ding, Y., Griggs, D.J., Noguer, M., Linden, P.J., Dai, X., Maskell, K. and Johnson C.A., 2001, Cimate Change 2001: The Scientific Basis. IPCC.
Jones, P.D., Horton, E.B., Folland, C.K., Hulme, M.
and Parker, D.E., 1999, The use of indices to identify changes in climate extreme, Climatic Change, 42, 131-149.
Jung, H.S., Choi, Y., Oh, J.H. and Lim, G.H., 2002, Recent trends in temperature and precipita- tion over South Korea, International Journal of Climatology, 22, 1327-1337.
Karl, T.R., Jones, P.D., Knight, R.W., Kukla, G., Plummer, N., Razuvayev, V., Gallo, K.P., Table 6. The results of t-test of annual and summer R95T between 1954-1976 and 1977-1999
Region Mean difference T value Sig. (2-tailed)
Korea -0.122 -2.375 .027**
Annual Central area -0.166 -1.615 .121
Southern area -0.104 -1.592 .126
Korea -0.120 -2.023 .055
Summer Central area -0.161 -1.249 .225
Southern area -0.103 -1.146 .264
**: significant at 99 percent level.
Region Mean difference T value Sig. (2-tailed)
Lindseay, J., Charlson, R.J. and Peterson, T.C., 1993, A new perspective on recent glob- al warming, Bulletin of the American Meteorological Society, 74, 1007-1024.
Manton, M.J. and Coauthors, 2001, Trends in extreme daily rainfall and temperature in southeast Asia and the South Pacific, 1961- 1998, International Journal of Climatology, 21, 269-284.
Nicholls, N. and Murray, W., 1999, Workshop on indices and indicators for climate extremes, Ashville, N.C., USA, 3-6 June 1997-Breakout
Group B, Precipitation, Climatic Change, 42, 23-29.
Received November 15, 2004 Accepted December 17, 2004
Correspondence : Youngeun Choi, Dept. of Geography, Konkuk University, Seoul, Korea(yechoi
@konkuk.ac.kr, phone: 02-450-3447, fax: 02-3436- 5433)
교 신 : 최영은, 143-701 서울시 광진구 화양동 1번지 건국대 학교 이과대학 지리학과(이메일 : yechoi@konkuk.
ac.kr 전화: 02-450-3447 팩스: 02-3436-5433)