Corresponding author: Hyun Yoon
Department of Clinical Laboratory Science, Wonkwang Health Science University, 514 Iksan-daero, Iksan 54538, Korea
E-mail: [email protected]
ORCID: https://orcid.org/0000-0002-4741-9664
ORIGINAL ARTICLE
Association between Pulse Pressure and Impaired Pulmonary Function in Non-Smoking Adults
Hyun Yoon
Department of Clinical Laboratory Science, Wonkwang Health Science University, Iksan, Korea
비흡연 성인에서 맥압과 폐기능 장애의 상관성
윤 현
원광보건대학교 임상병리과
ARTICLE INFO ABSTRACT
Received April 22, 2020 Revised 1st May 4, 2020 Revised 2nd May 6, 2020 Revised 3rd May 7, 2020 Revised 4th May 10, 2020 Revised 5th May 10, 2020 Accepted May 10, 2020
According to previous studies, an impaired pulmonary function is associated with arterial stiffness (AS). The pulse pressure (PP) is an important predictor of AS, but the association of an impaired pulmonary function with the PP is unclear. Therefore, this study assessed the associations between the PP and the predicted forced vital capacity (predicted FVC) and predicted forced expiratory volume in one second (predicted FEV
1) in Korean non-smoking adults. The data obtained from 6,857 adults during the 2013∼2015 Korean National Health and Nutrition Examination Survey were analyzed.
After adjusting for the related variables, the ORs of restrictive pulmonary disease (RPD, the predicted FVC<80.0% with FEV
1/FVC≥70.0%) using the normal PP group (PP≤60 mmHg) as a reference group was significant for the high PP group (PP>60 mmHg; 1.337 [95% confidence interval (CI), 1.049∼1.703]). In addition, the ORs of obstructive pulmonary disease (OPD, FEV
1/FVC<70.0%) using the normal PP group as a reference group were significant for the high PP group (1.339 [95%
CI, 1.093∼1.642]). In conclusion, a high PP is positively associated with both RPD and OPD in Korean non-smoking adults.
Copyright Ⓒ 2020 The Korean Society for Clinical Laboratory Science. All rights reserved.
Key words
Non-smokerObstructive pulmonary diseases Pulse pressure
Restrictive pulmonary diseases
INTRODUCTION
Chronic obstructive pulmonary disease (COPD) is the leading cause of mortality in high- (5.0%) and middle-income countries (6.9%) [1]. Impaired lung function, which is indicated by reduced forced expi- ratory volume in forced vital capacity (FVC) and first second of exhalation (FEV
1), contributes significantly to cardio- and cerebrovascular events and mortality [2, 3].
Impaired lung function occurs due to smoking, hypertension, chronic kidney disease, and type 2 diabetes mellitus [4, 5]. Some previous studies reported that arterial stiffness (AS) is increased in COPD [6-8]. It has been suggested that a link between vascular and pulmonary disease may explain a proportion of the excess cardiovascular mortality in COPD.
Pulse pressure (PP), which is the difference between systolic blood pressure (SBP) and diastolic blood pressure (DBP), is known to be a strong risk factor for cardiovascular events and mortality or all-cause mortality [9, 10]. In addition, PP is an important pre- dictor of AS and pulse wave velocity (PWV) because PP is determined by the elastic of the large arteries and the
Korean Society for Clinical Laboratory Science
magnitude of wave reflections [11, 12]. However, little research exists regarding the relationship between PP and impaired pulmonary function. Therefore, this study aimed to investigate the association between PP and impaired pulmonary function in Korean non- smoking adults aged ≥20 years using the data obtained in 2013∼2015 from the sixth Korean National Health and Nutrition Examination Survey (KNHANES-VI).
MATERIALS AND METHODS
1. Subjects
This study was based on most recent data from the KNHANES VI (2013∼2015). The KNHANES is a cross- sectional survey conducted nationwide by the Division of Korean National Health and Welfare. KNHANES comprises a health interview survey, a health behavior survey, a health examination survey, and a nutrition survey. Households as sampling units were stratified and collected through a multistage, probability-based sampling design based on sex, age, and geographic area, using household registries. At the time each survey was done, participants provided written informed consent for use of their data in further analyses and were given the right to refuse to par- ticipate, in accordance with the National Health Enhancement Act. In the KNHANES VI, 22,948 indi- viduals over age 1 were sampled for the survey. We excluded 13,524 subjects who were missing for pulmonary function test, and those (592 subjects) for whom data were missing for important analytic variables, such as various blood chemistry tests. In addition, we excluded the current-smoker (1,975 subjects who smoked more than one cigarette a day).
Finally, 6,857 subjects were included in the statistical analysis. The KNHANES VI study has been conducted according to the principles expressed in the De- claration of Helsinki (2013-07CON-03-4C, 2013- 12EXP-03-5C, 2015-01-02-6C). All survey participants agreed with the use of epidemiological research to identify risk factors and death causes of chronic
diseases. Participants’ records and information in the KNHANES were anonymous and de-identified prior to analysis. Further information can be found in “The KNHANES V Sample,” which is available on the KNHANES website. The official website of KNHANES (http://knhanes.cdc.go.kr) is currently operating an English-language information homepage. The data of the respective year are available to everyone free of charge. If the applicant completes a simple sub- scription process and provides his/her email address on the official website of KNHANES, the data of the respective year can be downloaded free of charge. If additional information is required, the readers may contact the department responsible for the storage of data directly (Su Yeon Park, [email protected]).
2. General characteristics and blood chemistry
Research subjects were classified by gender and by
age into less than 50 years, 50∼59 years, 60∼69 years,
and 70 years or older. Research subjects were classified
by sex (men and women), alcohol drinking (yes or no),
and regular exercise (yes or no). Alcohol drinking was
indicated as “yes” for participants who had consumed
at least one glass of alcohol every month over the last
year. Regular exercise was indicated as “yes” for
participants who had exercised on a regular basis
regardless of indoor or outdoor exercise. Regular
exercise was defined as 30 min at a time and 5 times/wk
in the case of moderate exercise, such as swimming
slowly, doubles tennis, volleyball, badminton, table
tennis, and carrying light objects; and for 20 min at a
time and 3 times/wk in the case of vigorous exercise,
such as running, climbing, cycling fast, swimming fast,
football, basketball, jump rope, squash, singles tennis,
and carrying heavy objects. Anthropometric mea-
surements included body mass index (BMI), waist
measurement (WM), SBP, and DBP. Blood chemistry
included measurement of triglycerides (TGs), high-
density lipoprotein cholesterol (HDL-C), fasting blood
glucose (FBG), predicted forced vital capacity (pre-
dicted FVC), predicted forced expiratory volume in 1
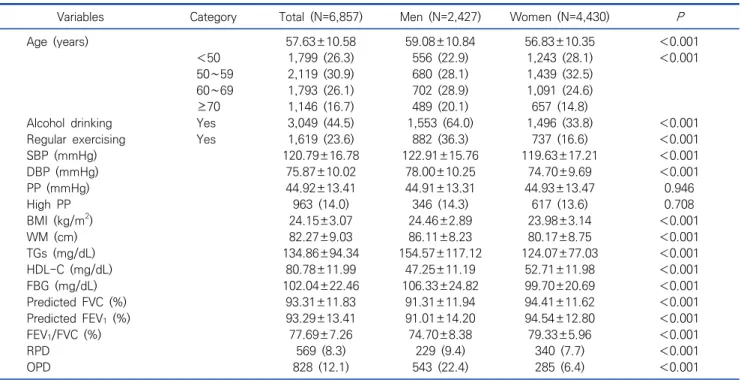
Table 1. General characteristics of research subjects
N (%), Mean±SD, (N=6,857)
Variables Category Total (N=6,857) Men (N=2,427) Women (N=4,430) P
Age (years) 57.63±10.58 59.08±10.84 56.83±10.35 <0.001
<50 1,799 (26.3) 556 (22.9) 1,243 (28.1) <0.001
50∼59 2,119 (30.9) 680 (28.1) 1,439 (32.5)
60∼69 1,793 (26.1) 702 (28.9) 1,091 (24.6)
≥70 1,146 (16.7) 489 (20.1) 657 (14.8)
Alcohol drinking Yes 3,049 (44.5) 1,553 (64.0) 1,496 (33.8) <0.001
Regular exercising Yes 1,619 (23.6) 882 (36.3) 737 (16.6) <0.001
SBP (mmHg) 120.79±16.78 122.91±15.76 119.63±17.21 <0.001
DBP (mmHg) 75.87±10.02 78.00±10.25 74.70±9.69 <0.001
PP (mmHg) 44.92±13.41 44.91±13.31 44.93±13.47 0.946
High PP 963 (14.0) 346 (14.3) 617 (13.6) 0.708
BMI (kg/m
2) 24.15±3.07 24.46±2.89 23.98±3.14 <0.001
WM (cm) 82.27±9.03 86.11±8.23 80.17±8.75 <0.001
TGs (mg/dL) 134.86±94.34 154.57±117.12 124.07±77.03 <0.001
HDL-C (mg/dL) 80.78±11.99 47.25±11.19 52.71±11.98 <0.001
FBG (mg/dL) 102.04±22.46 106.33±24.82 99.70±20.69 <0.001
Predicted FVC (%) 93.31±11.83 91.31±11.94 94.41±11.62 <0.001
Predicted FEV
1(%) 93.29±13.41 91.01±14.20 94.54±12.80 <0.001
FEV
1/FVC (%) 77.69±7.26 74.70±8.38 79.33±5.96 <0.001
RPD 569 (8.3) 229 (9.4) 340 (7.7) <0.001
OPD 828 (12.1) 543 (22.4) 285 (6.4) <0.001
Abbreviations: SBP, systolic blood pressure; DBP, diastolic blood pressure; PP, pulse pressure; High PP, PP>60 mmHg; WM, waist measurement; BMI, body mass index; TGs, triglycerides; HDL-C, high density lipoprotein cholesterol; FBG, fasting blood glucose; Predicted FVC, predicted forced vital capacity; Predicted FEV
1, predicted forced expiratory volume in 1 second; RPD, restrictive pulmonary diseases, predicted FVC<80.0% with FEV
1/FVC≥70.0%; OPD, obstructive pulmonary diseases, FEV
1/FVC<70.0%.
second (predicted FEV
1), and FEV
1/FVC.
3. Definitions of PP, RPD, OPD
PP was calculated as the difference between SBP and DBP. High PP was classified when the PP was >60 mmHg [13] because the cutoff for the high PP was not yet clear. The obstructive pulmonary disease (OPD) was defined FEV
1/FVC<70.0% and restrictive pulmonary disease (RPD) was defined the predicted FVC<80.0%
with FEV
1/FVC≥70.0% [14, 15].
4. Statistical analysis
The collected data were statistically analyzed using SPSS WIN version 18.0 (SPSS Inc., Chicago, IL, USA).
The distributions of the participant characteristics were converted into percentages, and the successive data were presented as averages with standard de- viations. The distribution and average difference in clinical characteristics and iron related indices according to normal PP and high PP were calculated
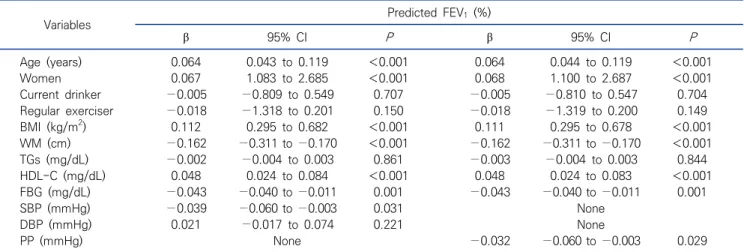
using chi-squared and an independent t test. Multiple linear regression analysis models were constructed for the predicted FVC and FEV
1and FEV
1/FVC: model 2) were adjusted for age, gender, drinking alcohol, regular exercise, TGs, HDL-C, FBG, BMI, WM, and either SBP and DBP or PP. In the case of logistic regression for odds ratio of OPD and RPD, the 4 models constructed were:
1) non-adjusted; 2) adjusted for age, gender, drinking, and regular exercising; 3) further adjusted for TGs, HDL-C, and FBG; 4) further adjusted for BMI and WM.
The significance level for all of the statistical data was set as P<0.05.
RESULTS
1. Clinical characteristics of research subjects
The clinical characteristics of the research subjects
are shown in Table 1. The prevalence rates of high PP in
men and women were 346 (14.3%) and 617 (13.6%),
respectively. The prevalence rates of RPD and OPD
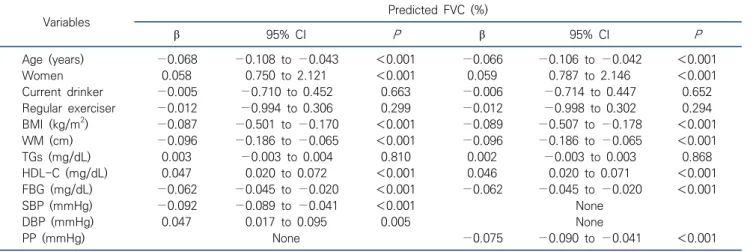
Table 3. Multiple linear regression analysis for the independent factors determining predicted FVC
(N=6,857)
Variables Predicted FVC (%)
β 95% CI P β 95% CI P
Age (years) −0.068 −0.108 to −0.043 <0.001 −0.066 −0.106 to −0.042 <0.001
Women 0.058 0.750 to 2.121 <0.001 0.059 0.787 to 2.146 <0.001
Current drinker −0.005 −0.710 to 0.452 0.663 −0.006 −0.714 to 0.447 0.652
Regular exerciser −0.012 −0.994 to 0.306 0.299 −0.012 −0.998 to 0.302 0.294
BMI (kg/m
2) −0.087 −0.501 to −0.170 <0.001 −0.089 −0.507 to −0.178 <0.001
WM (cm) −0.096 −0.186 to −0.065 <0.001 −0.096 −0.186 to −0.065 <0.001
TGs (mg/dL) 0.003 −0.003 to 0.004 0.810 0.002 −0.003 to 0.003 0.868
HDL-C (mg/dL) 0.047 0.020 to 0.072 <0.001 0.046 0.020 to 0.071 <0.001
FBG (mg/dL) −0.062 −0.045 to −0.020 <0.001 −0.062 −0.045 to −0.020 <0.001
SBP (mmHg) −0.092 −0.089 to −0.041 <0.001 None
DBP (mmHg) 0.047 0.017 to 0.095 0.005 None
PP (mmHg) None −0.075 −0.090 to −0.041 <0.001
Abbreviations: See Table 1.
Table 2. Clinical characteristics of subjects according to normal and high pulse pressure
N (%), Mean±SD, (N=6,857)
Variables Normal PP (N=5,894) High PP (N=963) P
Age (years) 56.00±10.04 67.63±7.95 <0.001
Women 3,813 (64.7) 617 (64.1) 0.708
Alcohol drinker 2,718 (46.1) 331 (34.4) <0.001
Regular exerciser 1,407 (23.9) 212 (22.0) 0.208
BMI (kg/m
2) 24.10±3.09 24.51±2.95 <0.001
WM (cm) 81.88±9.07 84.66±8.37 <0.001
SBP (mmHg) 116.86±13.70 144.83±13.58 <0.001
DBP (mmHg) 76.00±9.73 75.02±11.57 0.005
PP (mmHg) 40.86±8.73 69.81±9.67 <0.001
TGs (mg/dL) 133.11±92.96 145.62±101.73 <0.001
HDL-C (mg/dL) 50.98±12.01 49.50±11.83 <0.001
FBG (mg/dL) 101.12±21.87 107.71±25.06 <0.001
Predicted FVC (%) 93.81±11.58 90.28±12.82 <0.001
Predicted FEV
1(%) 93.37±12.96 92.80±15.92 0.223
FEV
1/FVC (%) 78.09±7.03 75.24±8.13 <0.001
Restrictive pulmonary diseases 456 (7.7) 113 (11.7) <0.001
Obstructive pulmonary diseases 629 (10.7) 199 (20.7) <0.001
Abbreviations: See Table 1; Normal PP, PP≤60 mmHg; High PP, PP>60 mmHg.
were 569 (8.3%) and 828 (12.1%), respectively. The following parameters were significantly higher (P<
0.001) in men than in women: alcohol intake, regular exercise, SBP, DBP, BMI, WM, TGs, FBG, OPD, and RPD.
However, the following were significantly lower (P<
0.001) in men than in women: HDL, predicted FVC, predicted FEV
1, and FEV
1/FVC.
2. Clinical characteristics of subjects according to normal and high pulse pressure
The clinical characteristics of subjects according to
normal and high PP are shown in Table 2. Age (P<
0.001), BMI (P<0.001), WM (P<0.001), SBP (P<0.001),
DBP (P=0.005), PP (P<0.001), TGs (P<0.001), and FBG
(P<0.001) were higher in the high PP group than in the
normal PP group. HDL-C (P<0.001), predicted FVC
(P<0.001), and FEV
1/ FVC (P<0.001) were lower in the
high PP group than in the normal PP group, but
predicted FEV
1(P=0.223) was not significant.
Table 5. Comparisons of the odds ratio of high pulse pressure according obstructive and restrictive pulmonary diseases
(N=6,857)
Variables High PP (PP>60 mmHg)
Model 1 Model 2 Model 3 Model 4
Normal 1 1 1 1
Restrictive pulmonary diseases 1.872 (1.499∼2.338) 1.404 (1.107∼1.781) 1.365 (1.074∼1.735) 1.337 (1.049∼1.703) Obstructive pulmonary diseases 2.390 (1.996∼2.862) 1.333 (1.090∼1.631) 1.363 (1.113∼1.669) 1.339 (1.093∼1.642) Abbreviations: See Table 1; Model 1 [ORs (95% CI)], Non-adjusted; Model 2 [ORs (95% CI)], Model 1 adjusted for age, gender, alcohol drinking, and regular exercising; Model 3 [ORs (95% CI)], Model 2 further adjusted for TGs, HDL-C, and FBG; Model 4 [ORs (95% CI)], Model 3 further adjusted for BMI and WM.
Table 4. Multiple linear regression analysis for the independent factors determining predicted FEV1