CD4
+CD25
highFoxP3
+Regulatory T-cells in Hematologic Diseases
Hee-Won Moon, M.D.1, Bo Hyun Kim, M.T.1, Chul Min Park, M.D.1, Mina Hur, M.D.1, Yeo-Min Yun, M.D.1, Sung-Yong Kim, M.D.2, and Mark Hong Lee, M.D.2
Departments of Laboratory Medicine1 and Internal Medicine2, Konkuk University School of Medicine, Seoul, Korea
Background: CD4+CD25+ regulatory T-cells (Tregs) play a critical role in immune responses. We explored the status of Tregs in neo- plastic and autoimmune hematologic diseases. We also evaluated the technical aspects of Treg measurement in terms of sample type and detection markers.
Methods: A total of 68 subjects were enrolled: 11 with AML, 8 with MDS, 10 with autoimmune diseases, and 39 controls. Tregs were analyzed in peripheral blood (PB) and bone marrow (BM) samples from each subject. Flow cytometry and the Human Regulatory T cell Staining Kit (eBioscience, USA) for CD4, CD25, and FoxP3 (forkhead box P3) were used.
Results: The CD4+CD25high/CD4 and CD4+CD25highFoxP3+/CD4 populations were significantly correlated (P<0.0001). The AML and high-risk MDS groups had significantly larger CD4+CD25high/CD4 and CD4+CD25highFoxP3+/CD4 populations in PB than the autoim- mune (P=0.007 and 0.012, respectively) and control groups (P=0.004 and 0.006, respectively). Comparable findings were observed in BM. The CD4+CD25highFoxP3+/CD4 population was significantly larger in PB than in BM (P=0.0003).
Conclusions: This study provides comparison data for Tregs in AML, MDS, and autoimmune hematologic diseases, and would be helpful for understanding the different immunologic bases of various hematologic diseases. Treg measurement using CD4, CD25, and/or FoxP3 in PB rather than in BM seems to be practical for routine hematologic purposes. Large-scale analysis of the diagnostic role of Treg measurement is needed.
Key Words: Regulatory T-cells, FoxP3, Hematologic disease, Peripheral blood, Bone marrow
Received: February 28, 2011 Manuscript No: KJLM-11-017 Revision received: May 16, 2011
Accepted: June 17, 2011
Corresponding author: Mina Hur, M.D.
Department of Laboratory Medicine, Konkuk University School of Medicine, Konkuk University Hospital, 4-12 Hwayang-dong, Gwangjin-gu, Seoul 143-729, Korea
Tel: +82-2-2030-5581, Fax: +82-2-2636-6764, E-mail: dearmina@hanmail.net ISSN 1598-6535 © The Korean Society for Laboratory Medicine.
This is an Open Access article distributed under the terms of the Creative Commons Attribution Non-Commercial License (http://creativecommons.org/licenses/by-nc/3.0) which permits unrestricted non-commercial use, distribution, and reproduction in any medium, provided the original work is properly cited.
INTRODUCTION
The human immune system maintains the balance be- tween protecting the host from pathologic microorganisms and avoiding excess immune reactions that could be harm- ful to the host [1]. Aberrant immune reactions can cause serious damage to host, such as various autoimmune and inflammatory diseases. Naturally occurring thymus-derived CD4+CD25+ regulatory T-cells (Tregs) play a critical role in the control of immune responses in various clinical settings, including autoimmune diseases, allergic disorders, infec-
tions, transplantations, and cancers [2-5].
A number of previous studies reported a high percentage of Tregs in tumor tissues and peripheral blood (PB) from patients with various cancers, including lung cancer, breast cancer, hepatocellular carcinoma, gastric, and ovarian can- cer [6-9]. They showed that a high percentage of Tregs or a low ratio of CD8+ T-cells to Tregs was associated with poor prognosis and more advanced stage [7, 10, 11]. In addition to solid tumors, a few recent studies have demonstrated in- creased Tregs in hematologic malignancies. The increase of Tregs was stage dependent and correlated with unfavorable cytogenetics [12-14]. However, some earlier studies were limited in that they used less specific detection markers for Tregs [13, 15, 16].
In spite of the many advanced diagnostic tools, differen- tial diagnoses between clonal or neoplastic hematologic dis- eases and non-clonal conditions are sometimes challenging.
Since most non-clonal conditions such as aplastic anemia (AA) and primary immune thrombocytopenic purpura (ITP) are based on autoimmune processes, we can speculate that the proportion of Tregs might differ between neoplastic and autoimmune hematologic diseases. To the best of our knowl-
edge, no previous study has directly compared Tregs betw- een neoplastic and autoimmune hematologic diseases. In addition, most studies have shown the data for Tregs in PB, and the data on Tregs in bone marrow (BM) have been very sparse. BM Tregs have only been evaluated in neoplastic he- matologic diseases.
In this study, we wanted to explore the status of Tregs and compare the proportion of Tregs between neoplastic and autoimmune hematologic diseases. Because we wanted to determine suitable conditions for Treg measurement in rou- tine diagnostic practice, we also evaluated the technical as- pects of Treg measurement, including sample types and the combination of detection markers.
MATERIALS AND METHODS
1. Study population
A total of 68 subjects were enrolled in this study from June 2009 until July 2010. There were 36 males and 32 females, and their median age was 57 yr (range, 18-85 yr). Twenty- nine subjects were diagnosed with various hematologic dis- eases: 11 patients with AML, 8 with MDS, 2 with AA, 5 with ITP, and 3 with autoimmune disease-related cytopenia such as systemic sclerosis or Sjogren’s syndrome. The 8 patients with MDS included 1 patient with refractory anemia with ring sideroblasts (RARS), 2 with refractory cytopenia and multilineage dysplasia (RCMD), and 5 with refractory ane- mia and excess blasts (RAEB). The diagnoses were made by 2 hematologists following the WHO classification [17]. The
patients with MDS were divided into 2 groups (low-grade and high-grade MDS) because the role of immune responses in the pathogenesis of these 2 groups is known to be differ- ent. Autoimmune processes have been suggested especially in low-grade MDS [18-20]. The low-grade MDS group in- cluded low/intermediate-1 risk, and the high-grade MDS group included intermediate-2/high risk, based on the In- ternational Prognostic Scoring System (IPSS) score. AA, ITP, and autoimmune disease-related cytopenia were categoriz ed as the autoimmune group.
The control group (N=39) consisted of 11 patients with no evidence of specific hematologic diseases on BM exami- nations and 28 healthy subjects who received regular check- ups. The study groups did not differ in terms of age and sex (Table 1). This study was approved by the institutional ethics committee and informed consent was obtained from each enrolled subject.
2. Flow cytometry analysis for Tregs
PB and BM samples were obtained from all subjects, ex- cept for 28 healthy subjects in the control group, from whom only PB samples were available. The samples were collected in sterile EDTA tubes during routine diagnostic or check- up visits, and mononuclear cells (MNC) were separated by density gradient centrifugation using Ficoll (Ficoll-Paque;
GE Healthcare Life Sciences, Milan, Italy). Isolated MNC layers were resuspended in phosphate buffered saline (PBS) at the concentration of 1×10⁶ cells/mL.
For the analysis of Tregs, a Human Regulatory T Cell Stain-
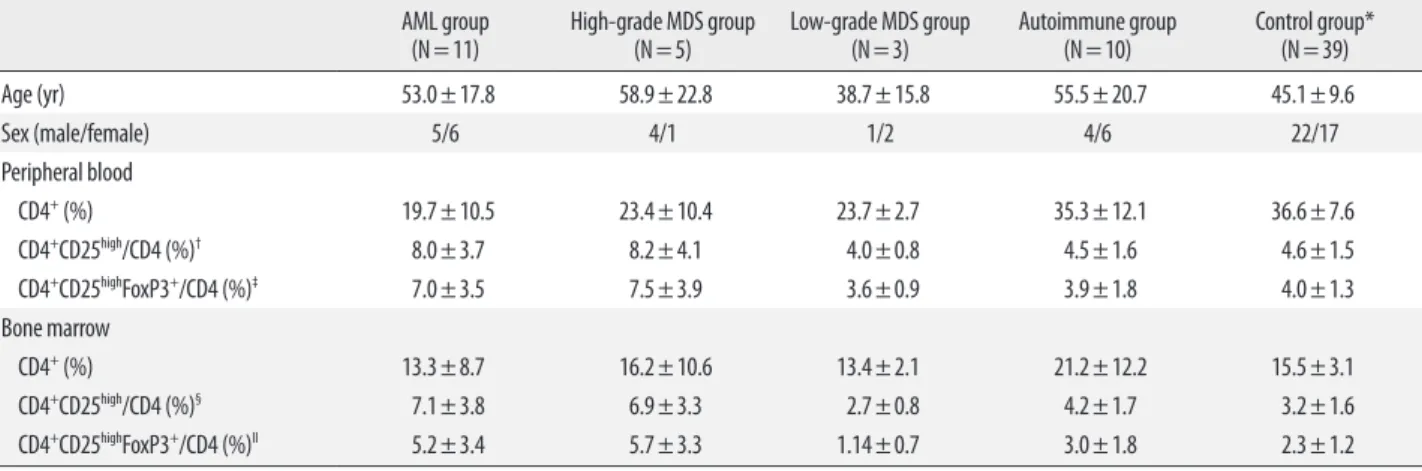
Table 1. Characteristics and distribution of cell subpopulations in hematologic disease and control groups AML group
(N=11) High-grade MDS group
(N=5) Low-grade MDS group
(N=3) Autoimmune group
(N=10) Control group*
(N=39)
Age (yr) 53.0±17.8 58.9±22.8 38.7±15.8 55.5±20.7 45.1±9.6
Sex (male/female) 5/6 4/1 1/2 4/6 22/17
Peripheral blood
CD4+ (%) 19.7±10.5 23.4±10.4 23.7±2.7 35.3±12.1 36.6±7.6
CD4+CD25high/CD4 (%)† 8.0±3.7 8.2±4.1 4.0±0.8 4.5±1.6 4.6±1.5
CD4+CD25highFoxP3+/CD4 (%)‡ 7.0±3.5 7.5±3.9 3.6±0.9 3.9±1.8 4.0±1.3
Bone marrow
CD4+ (%) 13.3±8.7 16.2±10.6 13.4±2.1 21.2±12.2 15.5±3.1
CD4+CD25high/CD4 (%)§ 7.1±3.8 6.9±3.3 2.7±0.8 4.2±1.7 3.2±1.6
CD4+CD25highFoxP3+/CD4 (%)II 5.2±3.4 5.7±3.3 1.14±0.7 3.0±1.8 2.3±1.2
*In the control group, bone marrow analysis was done in 11 patients with no evidence of specific hematologic diseases on bone marrow examination; †AML vs autoimmune and control group: P =0.028 and 0.026, AML/high-grade MDS vs autoimmune and control group: P =0.007 and 0.004; ‡AML vs autoimmune and control group: P =0.041 and 0.035, AML/high-grade MDS vs autoimmune and control group: P =0.012 and 0.006; §AML/high-grade MDS vs autoimmune and control group: P =0.015 and 0.003; IIAML/high-grade MDS vs autoimmune and control group: P =0.045 and 0.029.
Data are expressed as mean±SD.
Abbreviation: FoxP3, forkhead box P3.
ing Kit (eBioscience, San Diego, CA, USA), including fluo- rescein isothiocyanate (FITC) CD4, phycoerythrin (PE) CD- 25, and phycoerythrin-cyanin 5 (PE-Cy5) FoxP3 (forkhead box P3) was used. Tregs were analyzed according to the ma- nufacturer’s instructions. Isotype-negative controls included a mouse isotype matched non-relevant immunoglobulin to define the positive population. After gating the lymphocyte population, the CD4+CD25high population and the CD4+CD 25highFoxP3+ population were sequentially gated and analyz ed.
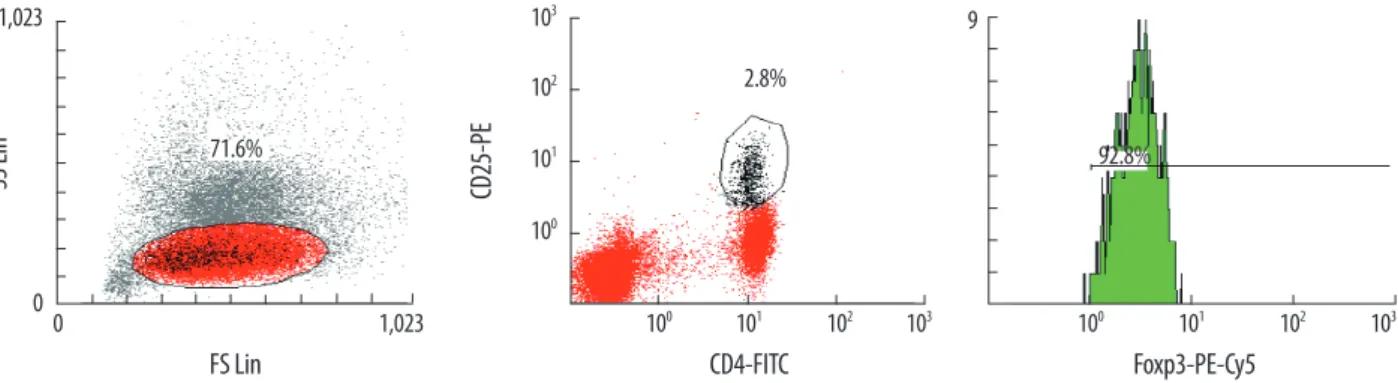
The percentage of FoxP3+ cells (CD4+CD25highFoxP3+) was counted in the CD4+ population (Fig. 1). Multicolor flow cytometry analysis was performed using Cytomics FC500 and CXP software (Beckman Coulter, Fullerton, CA, USA).
3. Statistical analysis
Chi-square test or Fisher’s exact test was used for categor- ical variables and Student’s t-test or Kruskal-Wallis test was used for continuous variables, as appropriate. Pearson’s cor- relation was used for comparisons. The statistical analysis was performed using SPSS Software (version 14.0; SPSS Inc., Chicago, IL, USA) and MedCalc Statistical Software (ver- sion 11.2.1; Mariakerke, Belgium). P values of ≤0.05 were considered statistically significant.
RESULTS
1. PB Tregs in each group
In general, the populations of CD4+CD25high/CD4 and CD4+CD25highFoxP3+/CD4 cells were significantly correlated (Y=0.9326X-0.2901, R=0.9674, P <0.0001). The CD4+CD 25high/CD4 population (5.56±2.82%) was slightly larger than the CD4+CD25highFoxP3+/CD4 population (4.90±2.67%)
with a mean difference of 0.66% [CD4CD25 -CD4CD 25high FoxP3+] (Fig. 2).
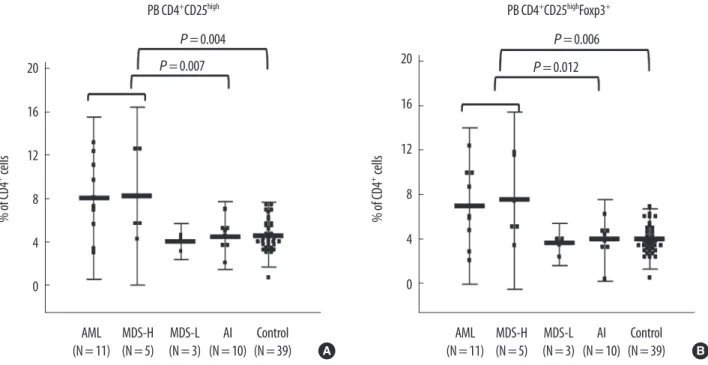
The populations of CD4+CD25high/CD4 and CD4+CD 25highFoxP3+/CD4 cells in the AML group were significantly larger than those in the autoimmune (P =0.028 and 0.041, respectively) and control groups (P =0.026 and 0.035, re- spectively). The high-grade MDS group also had larger pop- ulations of CD4+CD25high/CD4 (8.2±4.1%) and CD4+CD 25highFoxP3+/CD4 (7.5±3.9%) cells than the low-grade MDS (4.0±0.8%; 3.6±0.9%), autoimmune (4.5±1.6%; 3.9±1.8%), and control groups (4.6±1.5%; 4.0±1.3%); however, the dif- ference was not statistically significant (Table 1, Fig. 3). When the AML and high-grade MDS groups were analyzed toge- ther as a single category, they had significantly larger popu- lations of CD4+CD25high/CD4 and CD4+CD25highFoxP3+/ CD4 cells than the autoimmune group (P =0.007 and 0.012, respectively) and the control group (P =0.004 and 0.006, re- spectively, Fig. 3). There were no differences in the Treg po- pulations among the low-grade MDS, autoimmune, and con- trol groups.
2. BM Tregs in each group
The populations of CD4+CD25high/CD4 and CD4+CD 25highFoxP3+/CD4 cells were also significantly larger in the AML and high-grade MDS groups than in the autoimmune group (P =0.015 and 0.045, respectively) and the control group (P =0.003 and 0.029, respectively, Table 1, Fig. 4). In spite of the small number of patients, the high-grade MDS group had significantly larger populations of CD4+CD25high/ CD4 and CD4+CD25highFoxP3+/CD4 cells than the low-grade MDS group (P =0.044 and 0.034, respectively; Table 1, Fig.
4). There were no statistically significant differences in the
Fig. 1. Analysis of Tregs using flow cytometry. Mononuclear cells were stained with CD4-FITC, CD25-PE, and FoxP3-PE-Cy5 antibodies. After gating the lympho- cyte population, the CD4+CD25high population and the CD4+CD25highFoxP3+ population were sequentially gated and analyzed. The percentage of FoxP3+ cells (CD4+ CD25highFoxP3+) within the CD4+ population was calculated. In the case shown above, the proportion of CD4+CD25high cells is 2.8% of CD4+ population and 92.8%
of that population is Foxp3 positive (2.59% of CD4+ population), defined by isotype control.
Abbreviations: SSC, side scatter; FSC, forward scatter; FITC, fluorescein isothiocyanate; PE, phycoerythrin; PE-Cy5, phycoerythrin-cyanin 5; FoxP3, forkhead box P3.
0 1,023
SS Lin
FS Lin
1,023 0
71.6%
100 101 102 103
CD25-PE
CD4-FITC
103
100 101 102
2.8%
Foxp3-PE-Cy5 92.8%
103 102 101
100 9
Treg populations among the low-grade MDS, autoimmune, and control groups.
3. Comparison of Tregs in PB and BM
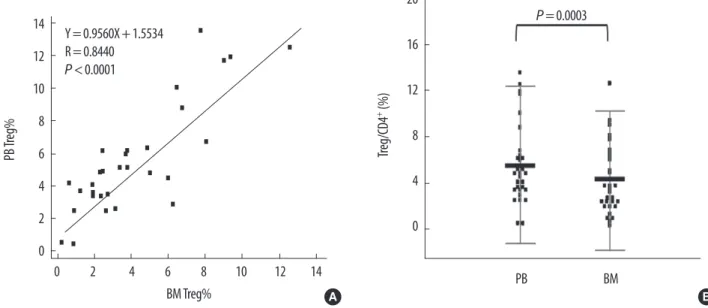
The populations of Tregs (CD4+CD25highFoxp3+/CD4) in PB
and BM were significantly correlated (Y=0.9560X+ 1.5534, R=0.8440, P <0.0001). However, the Treg population was significantly larger in PB than in BM (mean difference, 1.37±
1.83%; P =0.0003) (Fig. 5).
Fig. 2. Correlation and difference between the CD4+CD25high/CD4 and CD4+CD25highFoxP3+/CD4 populations in peripheral blood. (A) The 2 populations were sig- nificantly correlated (Y=0.9326X - 0.2901, R=0.9674, P <0.0001). (B) The CD4+CD25high/CD4 population (5.56±2.82%) was slightly larger than the CD4+CD 25highFoxP3+/CD4 population (4.90±2.67%) with mean difference of 0.66%.
Abbreviation: FoxP3, forkhead box P3.
14 12 10 8 6 4 2 0 CD4+ CD25high Foxp3+ /CD4 (%)
CD4+CD25high/CD4 (%)
0 2 4 6 8 10 12 14 16
Y=0.9326X-0.2901 R=0.9674 P <0.0001
4.0 3.5 3.0 2.5 2.0 1.5 1.0 0.5 0.0 -0.5 -1.0 CD25high -Foxp3+ (%)
Average of CD25high and Foxp3+ (%)
0 5 10 15 20
+1.96 SD 1.68 Mean 0.66 -1.96 SD -0.35
A B
20
16
12
8
4
0
% of CD4+ cells
AML
(N=11) MDS-H (N=5) MDS-L
(N=3) AI
(N=10) Control (N=39) PB CD4+CD25high
P =0.004
P =0.007 20
16
12
8
4
0
% of CD4+ cells
AML
(N=11) MDS-H (N=5) MDS-L
(N=3) AI
(N=10) Control (N=39) PB CD4+CD25highFoxp3+
P =0.006 P =0.012
A B
Fig. 3. Peripheral blood CD4+CD25high/CD4 (A) and CD4+CD25highFoxP3+/CD4 populations (B) in each group. Both PB CD4+CD25high/CD4 and PB CD4+CD25highFoxp3+/ CD4 populations were significantly larger in the AML and high-grade MDS groups compared with the autoimmune and control groups, by Student’s t-test. Shown are the mean (middle bar) and 2SD (error bar) for each group.
Abbreviations: PB, peripheral blood; FoxP3, forkhead box P3; MDS-H, high-grade MDS; MDS-L, low-grade MDS; AI, autoimmune group.
DISCUSSION
Tregs, a small subpopulation (5-10%) of CD4+ T-cells,
were first described by Sakaguchi et al. [4]. Accumulating evidence shows that Tregs maintain immunologic tolerance by suppressing the activation and expansion of self-reactive 20
16
12
8
4
0
% of CD4+ cells
AML
(N=11) MDS-H (N=5) MDS-L
(N=3) AI
(N=10) Control (N=11) P =0.015
P =0.044 P =0.003
20
16
12
8
4
0
% of CD4+ cells
AML
(N=11) MDS-H (N=5) MDS-L
(N=3) AI
(N=10) Control (N=11) P =0.029
P =0.045
P =0.034
A B
Fig. 4. Bone marrow (BM) CD4+CD25high/CD4 and CD4+CD25highFoxP3+/CD4 populations in each group. (A) The BM CD4+CD25high/CD4 population was significantly larger in the AML and high-grade MDS groups than in the autoimmune and control groups. (B) The BM CD4+CD25highFoxP3+/CD4 population was significantly larger in the AML and high-grade MDS groups than in the autoimmune and control groups. The low-grade MDS group had significantly smaller populations of CD4+CD25high/CD4 and CD4+CD25highFoxP3+/CD4 cells compared with the high-grade MDS group. Shown are the mean (middle bar) and 2SD (error bar) for each group.
Abbreviations: BM, bone marrow; FoxP3, forkhead box P3; MDS-H, high-grade MDS; MDS-L, low-grade MDS; AI, autoimmune group.
Fig. 5. Comparison of Tregs (CD4+CD25highFoxP3+/CD4) in peripheral blood (Y axis) and bone marrow (X axis). (A) The 2 populations were significantly correlated (Y=0.9560X+1.5534, R=0.8440, P <0.0001). (B) The percentage of PB Tregs (5.52±3.41%) was significantly higher than that of BM Tregs (4.16±3.00%) (mean difference 1.37±1.83%, P =0.0003 by paired t-test).
Abbreviations: PB, peripheral blood; BM, bone marrow; Treg, regulatory T-cells.
14 12 10 8 6 4 2 0
PB Treg%
0 2 4 6 8 10 12 14
BM Treg%
Y=0.9560X+1.5534 R=0.8440 P <0.0001
20
16
12
8
4
0 Treg/CD4+ (%)
PB BM
P =0.0003
A B
immune cells, including CD4+CD25- T-cells, CD8+ T-cells, dendritic cells, natural killer cells, and B-cells, by cell-to-cell contact in a dose-dependent manner [1, 21, 22]. In addition to naturally-occurring Tregs, several subsets of Tregs, inclu- ding antigen-induced Tregs (e.g., Tr1 and Th3 cells), and adaptively induced CD4+ Tregs in the periphery by conver- sion of CD4+CD25- T-cells and CD8+ T-cells, have been re- cently identified [6, 22].
In this study, we evaluated the proportion of CD4+CD25+ FoxP3+ Tregs in PB and BM samples from patients with var- ious hematologic diseases. To the best of our knowledge, no previous study has directly compared the PB and BM Treg populations among clonal and autoimmune hematologic diseases. Moreover, there has been very little data on the dis- tribution of Tregs in normal healthy Asian populations.
According to our data, the percentage of CD4+CD25high FoxP3+ Tregs in the control group was 4.0±1.3% in PB and 2.3±1.2% in BM. Treg data in control individuals varied widely across studies, ranging from 0.5% to 12% in PB; and the percentage of Tregs in BM was consistently lower than in PB [15, 23-26]. Such wide variation may be due to differ- ences in detection markers, gating strategies, and parame- ters. Although most studies analyzed the percentage of Tregs within the CD4+ cell population using CD4, CD25, and Fox- P3, some studies used only CD4 and CD25 or other param- eters such as absolute counts and percentages in total lym- phocytes [12, 24]. In almost all these studies, the number of control subjects was very limited. Moreover, very heteroge- neous groups of patients were used as controls, and most of them could not be considered as true healthy, reference in- dividuals. Therefore, both assay standardization and deter- mination of the reference range in each ethnic population using large numbers of healthy individuals are needed for the routine clinical use of Tregs.
In our study, the AML and high-grade MDS groups had significantly increased Treg populations in both PB and BM compared with the control and autoimmune groups. Re- cently, an increased proportion of Tregs in PB was reported in hematologic malignancies such as AML, multiple my- eloma, chronic lymphocytic leukemia, lymphoma, and high- grade MDS [22, 25]. In clonal hematologic diseases, increased Tregs in BM was also significant, which was in agreement with previous studies [16, 18]. Although the results for Tregs in BM and PB were well correlated, the proportion of Tregs was lower in BM, and the difference in BM between groups was less significant.
Regarding autoimmune hematologic diseases such as AA and ITP, a few recent studies reported reduced proportion and function of Tregs in PB [24, 26, 27]. In addition, there
is evidence for an association between early-stage MDS and autoimmune manifestations, which has not been shown for high-grade MDS [19]. A recent study reported a lower pro- portion of PB Tregs in early MDS [18]. In our study, the low- grade MDS group also had a low proportion of Tregs in both PB and BM, which was comparable to those of the autoim- mune and control groups.
Tregs are identified by the expression of CD25, which is a component of the high affinity interleukin 2 receptor, and is functionally essential for Treg development. However, CD25 is known to be not specific for Tregs, since it is also expressed by effector T-cells. To date, expression of FoxP3, a member of the forkhead/winged-helix family of transcriptional fac- tors, is considered an optimal marker for Tregs [1, 28]. Nev- ertheless, our data showed that CD4+CD25high/CD4 and CD 4+CD25highFoxP3+/CD4 cell populations were significantly correlated (P <0.0001). In addition, the PB CD4+CD25high/ CD4 and PB CD4+CD25highFoxP3+/CD4 populations were significantly different between the groups with neoplastic disease and the autoimmune and control groups (Fig. 3).
Regarding sample type, the Tregs in PB differed more sig- nificantly between groups than those in BM. Previous stud- ies showed that increased Tregs in cancer is a generalized phenomenon, both in the tumor microenvironment and in PB [22]. From a technical point of view, BM processing is more difficult due to fat tissues and lower lymphocyte pro- portions; thus, sampling from PB would be better than sam- pling from BM for Treg measurement in routine clinical set- tings. However, the clinical significance of Tregs in PB and/
or BM needs to be further evaluated using large clinical data sets.
In conclusion, this study directly compared Tregs in vari- ous hematologic diseases, including AML, MDS, and auto- immune hematologic diseases. In spite of the limited study population, our data would be useful in understanding the different immunologic bases of various hematologic diseases.
Measurement of Tregs using CD4, CD25, and/or FoxP3 in PB rather than BM seems to be practical for routine hema- tologic purposes. The diagnostic role of Treg measurement needs to be further evaluated with a larger clinical data set.
Authors’ Disclosures of Potential Conflicts of Interest No potential conflict of interest relevant to this article was reported.
Acknowledgment
This study was supported by Konkuk University in 2011.
REFERENCES
1. Sakaguchi S, Yamaguchi T, Nomura T, Ono M. Regulatory T cells and immune tolerance. Cell 2008;133:775-87.
2. Hori S, Nomura T, Sakaguchi S. Control of regulatory T cell devel- opment by the transcription factor Foxp3. Science 2003;299:1057- 61.
3. Ozdemir C, Akdis M, Akdis CA. T regulatory cells and their coun- terparts: masters of immune regulation. Clin Exp Allergy 2009;39:
626-39.
4. Sakaguchi S. Regulatory T cells: key controllers of immunologic self-tolerance. Cell 2000;101:455-8.
5. Kim JM, Rasmussen JP, Rudensky AY. Regulatory T cells prevent catastrophic autoimmunity throughout the lifespan of mice. Nat Immunol 2007;8:191-7.
6. Wang HY and Wang RF. Regulatory T cells and cancer. Curr Opin Immunol 2007;19:217-23.
7. Curiel TJ, Coukos G, Zou L, Alvarez X, Cheng P, Mottram P, et al.
Specific recruitment of regulatory T cells in ovarian carcinoma fos- ters immune privilege and predicts reduced survival. Nat Med 2004;
10:942-9.
8. Woo EY, Chu CS, Goletz TJ, Schlienger K, Yeh H, Coukos G, et al.
Regulatory CD4(+)CD25(+) T cells in tumors from patients with early-stage non-small cell lung cancer and late-stage ovarian can- cer. Cancer Res 2001;61:4766-72.
9. Yang ZZ, Novak AJ, Stenson MJ, Witzig TE, Ansell SM. Intratu- moral CD4+CD25+ regulatory T-cell-mediated suppression of in- filtrating CD4+ T cells in B-cell non-Hodgkin lymphoma. Blood 2006;107:3639-46.
10. Ichihara F, Kono K, Takahashi A, Kawaida H, Sugai H, Fujii H. In- creased populations of regulatory T cells in peripheral blood and tumor-infiltrating lymphocytes in patients with gastric and esoph- ageal cancers. Clin Cancer Res 2003;9:4404-8.
11. Sato E, Olson SH, Ahn J, Bundy B, Nishikawa H, Qian F, et al. In- traepithelial CD8+ tumor-infiltrating lymphocytes and a high CD- 8+/regulatory T cell ratio are associated with favorable prognosis in ovarian cancer. Proc Natl Acad Sci U S A 2005;102:18538-43.
12. Kordasti SY, Ingram W, Hayden J, Darling D, Barber L, Afzali B, et al. CD4+CD25high Foxp3+ regulatory T cells in myelodysplastic syndrome (MDS). Blood 2007;110:847-50.
13. Motta M, Rassenti L, Shelvin BJ, Lerner S, Kipps TJ, Keating MJ, et al. Increased expression of CD152 (CTLA-4) by normal T lympho- cytes in untreated patients with B-cell chronic lymphocytic leuke- mia. Leukemia 2005;19:1788-93.
14. Beyer M, Kochanek M, Giese T, Endl E, Weihrauch MR, Knolle PA, et al. In vivo peripheral expansion of naive CD4+CD25high FoxP3+
regulatory T cells in patients with multiple myeloma. Blood 2006;
15. Nadal E, Garin M, Kaeda J, Apperley J, Lechler R, Dazzi F. Increased frequencies of CD4(+)CD25(high) T(regs) correlate with disease relapse after allogeneic stem cell transplantation for chronic my- eloid leukemia. Leukemia 2007;21:472-9.
16. Wang X, Zheng J, Liu J, Yao J, He Y, Li X, et al. Increased popula- tion of CD4(+)CD25(high), regulatory T cells with their higher apoptotic and proliferating status in peripheral blood of acute my- eloid leukemia patients. Eur J Haematol 2005;75:468-76.
17. Swerdlow S, Campo E, et al. eds. WHO classification of tumours of hematopoietic and lymphoid tissue. Lyon: IARC Press, 2008.
18. Kotsianidis I, Bouchliou I, Nakou E, Spanoudakis E, Margaritis D, Christophoridou AV, et al. Kinetics, function and bone marrow trafficking of CD4+CD25+FOXP3+ regulatory T cells in myelo- dysplastic syndromes (MDS). Leukemia 2009;23:510-8.
19. Sloand EM and Rezvani K. The role of the immune system in my- elodysplasia: implications for therapy. Semin Hematol 2008;45:39- 48.
20. Aggarwal S, van de Loosdrecht AA, Alhan C, Ossenkoppele GJ, Westers TM, Bontkes HJ. Role of immune responses in the patho- genesis of low-risk MDS and high-risk MDS: implications for im- munotherapy. Br J Haematol 2011;153:568-81.
21. Azuma T, Takahashi T, Kunisato A, Kitamura T, Hirai H. Human CD4+ CD25+ regulatory T cells suppress NKT cell functions. Can- cer Res 2003;63:4516-20.
22. Beyer M and Schultze JL. Regulatory T cells in cancer. Blood 2006;
108:804-11.
23. Feyler S, von Lilienfeld-Toal M, Jarmin S, Marles L, Rawstron A, Ashcroft AJ, et al. CD4(+)CD25(+)FoxP3(+) regulatory T cells are increased whilst CD3(+)CD4(-)CD8(-)alphabetaTCR(+) Double Negative T cells are decreased in the peripheral blood of patients with multiple myeloma which correlates with disease burden. Br J Haematol 2009;144:686-95.
24. Solomou EE, Rezvani K, Mielke S, Malide D, Keyvanfar K, Viscon te V, et al. Deficient CD4+ CD25+ FOXP3+ T regulatory cells in ac- quired aplastic anemia. Blood 2007;110:1603-6.
25. Szczepanski MJ, Szajnik M, Czystowska M, Mandapathil M, Strauss L, Welsh A, et al. Increased frequency and suppression by regula- tory T cells in patients with acute myelogenous leukemia. Clin Can- cer Res 2009;15:3325-32.
26. Yu J, Heck S, Patel V, Levan J, Yu Y, Bussel JB, et al. Defective circu- lating CD25 regulatory T cells in patients with chronic immune thrombocytopenic purpura. Blood 2008;112:1325-8.
27. Chong BH. ITP: Tregs come to the rescue. Blood 2010;116:4388- 90.
28. Alatrakchi N and Koziel M. Regulatory T cells and viral liver dis- ease. J Viral Hepat 2009;16:223-9.