To improve the quality of magnetic resonance (MR) angiography, various performance enhancing MR se- quences and scanning protocols have been adopted (1- 7). The development of higher performance MR scan- ners has facilitated these trials (5, 8, 9), and contrast-en- hanced MR angiography (CEMRA) has thus become a feasible method of vascular imaging. Various amounts
of contrast media have been used for CEMRA, ranging from the standard dose of 0.05 mmol / kg to 60 mL per patient (2, 5, 8, 10-14). High-dose CEMRA was general- ly believed to allow a higher signal-to-noise ratio and easier scanning, though its cost-effectiveness and safety issues were questionable (11). Currently, the preferred amount of contrast medium is that of the standard dose, on the basis of bolus injection, although double or triple dose contrast continues to be used in cases involving prolonged acquisition (7, 11-13). While involved in work to optimize the amount of contrast medium used for routine CEMRA, we examined the usage of dosages lower than those normally employed. In this study we e- valuated the effectiveness of low-dose CEMRA by com- paring it with conventional digital subtraction angiogra-
Low-dose Contrast-enhanced Magnetic Resonance Angiography with Less than the Standard Dose of Gadolinium Chelate: Comparison with Conventional
Digital Subtraction Angiography
1Jongmin J. Lee, M.D., Yongmin Chang, Ph.D., Yongsun Kim, M.D., Ph.D., Yongjoo Kim, M.D., Ph.D., Duk-Sik Kang, M.D., Ph.D.
P
Puurrppoossee:: To evaluate the effectiveness of contrast-enhanced MR angiography (CEM- RA) using gadolinium chelate at less than the standard dose.
M
Maatteerriiaallss aanndd MMeetthhooddss:: Eight patients with occlusive arterial disease underwent 16 CEMRA scans of the lower extremities following bolus injection of 0.075 mmol/kg gadolinium, using a 1.5T scanner and 3D-turbo-FLASH sequence. The arterial phase was compared with that obtained by digital subtraction angiography (DSA). After grouping arteries according to their diameter, arterial detectability (AD), stenosis grad- ing (SG), and the detectability of significant stenosis (SD) were compared.
R
Reessuullttss:: The AD of CEMRA showed high specificity (Sp, 98%-100%) in all groups, and sensitivity (Sn) was high (>90%) in groups I, II, and III. SG showed a correlation coefficient of 0.65* and 0.60* in groups I and II, though CEMRA tended to overesti- mate. SD was high (Sn,100%) in all groups, but Sp was low(<70%).
C
Coonncclluussiioonn:: Low-dose CEMRA is an excellent way to exclude significant arterial ob- struction in the lower extremities, even in small arteries. Stenosis grading was possible in large arteries but consideration must be paid to the technique’s overestimating characteristic.
IInnddeexx wwoorrddss :: Magnetic resonance (MR), angiography
Magnetic resonance (MR), contrast enhancement Extremities, MR
1Department of Diagnostic Radiology, School of Medicine, Kyungpook National University
This research was supported by the Medical Research Institute of Kyungpook National University Hospital.
Received September 26, 1999 ; Accepted May 2, 2000
Address reprint requests to : Jongmin J. Lee, M.D., Department of Diagnostic Radiology, School of Medicine, Kyungpook National University. 50, 2-Ga, Samduk-Dong , Jung-Gu, Taegu, 700-412, Korea.
Tel. 82-53-420-5472 Fax. 82-53-422-2677 E-mail: jonglee@knu.ac.kr
phy (DSA).
M
Maatteerriiaallss aanndd MMeetthhooddss S
Suubbjjeeccttss
Eight patients with occlusive arterial diseases of the lower extremities underwent 16 CEMRA scans. The sex ratio was 6: 2 (male: female) and their ages ranged from 44 to 71 (average, 63) years. Patients were scheduled to be examined by conventional DSA, but before this, low- dose CEMRA was carried out with the patients’com- plete agreement of the patients. After CEMRA, conven- tional DSA was performed within one week.
M
MRR IImmaaggiinngg PPrroottooccooll
For CEMRA, a 1.5 Tesla MR scanner (Magnetom Vision Plus, Siemens, Erlangen, Germany) was used.
The pulse sequence was three-dimensional turbo fast low angle shot (turbo - FLASH). The scanning parame- ters were 4.0 msec repetition time, 1.6 msec echo time, 30 degree flip angle, a matrix of 155×255 and a slice thickness of 1.5 mm. Acquisition time ranged from 17 to 20 seconds according to the size of the field of view. The RF coil used was the whole body rather than surface type.
The examination of a patient involved the use of two stations, and this allowed coverage from the common il- iac to the distal tibial artery. The acquisition planes of both stations were coronal, with slight inclinations along the courses of the superficial femoral and tibial arteries.
After measuring arterial peak enhancement time and calculating the scan delay time, preliminary non-en- hanced mask images were acquired at both the proxi- mal and distal stations. The mask image for the second station was acquired by scanning with the same se- quencing after stepping the table to the pre-selected co- ordinates. Subsequently, contrast-enhanced acquisitions were obtained with as long an intermission as possible between the two stations. At each station, to avoid miss- ing the arterial phase acquisition, three-phase images were acquired. The first phase was started at the calcu- lated scan delay time and the second was acquired im- mediately afterwards; these two phases were expected to cover the early and late arterial phases. So as to in- clude the later venous phase, the third-phase scan was obtained 50 seconds after completion of the second phase.
The calculation of scan delay time was achieved by monitoring the time-intensity curve. After 2ml of con-
trast medium (Omniscan, Nycomed Imaging AS, Oslo, Norway) was injected, repeated two-dimensional FLASH scans with 1-second intervals continued for 60 seconds.
The injection rate of the contrast medium (3 ml / sec) was controlled using an automated power injector (Medrad, Indianola, Pa., U.S.A.). After injection of the test-dose of contrast medium, and to push the contrast bolus, 20 ml of normal saline was infused at the same rate. The acqui- sition plane was single and axial, and located at the level of the lower pole of the right kidney. During the scan- ning procedure, the patient’s breathing was not restrict- ed. The region of interest (ROI) was drawn at the in- frarenal abdominal aorta and a time-intensity curve was plotted. After measuring the arterial peak enhancement time from the time-intensity curve, the scan delay time was calculated using the formula below.
τd = τp- [1]
τd=Scan delay time, τp=Arterial peak enhancement time, τa=Acquisition time of main scan for MR angiography
Contrast-enhanced scanning was performed using the same protocol as for unenhanced scanning, which was used as a mask image during digital subtraction, except for the contrast enhancement and station priorities. To reduce table movement, acquisitions of the contrast-en- hanced stations were performed in reverse order of un- enhanced acquisitions. The dose of contrast medium used was 0.075 mmol / kg at each station and the total dose per patient amounted to 0.15 mmol / kg. Bolus in- jection of the main dose of contrast medium was carried out using the same method as for test-dose injection. To reduce venous and soft tissue enhancement by the pre- vious contrast injection, the period between the former and latter stations was intentionally delayed by approxi- mately 15 minutes.
After the reconstruction of raw data, and in order to e- liminate the background signal, each mask image was subtracted from the corresponding station of the con- trast-enhanced image. The venous phase image was ob- tained by subtracting the first arterial phase from the third phase, to remove the arterial signal. Subsequently, maximum intensity projection was performed, and pro- jections were made along ten different planes, from 0 to 180 degrees, with increments of 18 degrees.
C
Coonnvveennttiioonnaall aannggiiooggrraapphhyy
DSA was performed by fluoroscopy (Advantx, GE τa
4
Medical Systems, Milwaukee, Wis., U.S.A.), radiograph- ic projection being made in the anteroposterior direc- tion. After puncturing the right common femoral artery, a 5-F visceral catheter (Cook, Bloomington, Ind., U.S.A.) was introduced, and using the Seldinger technique, was moved up to the aortic bifurcation. Iodinated contrast medium (Ultravist 370, Schering, Berlin, Germany) was then injected at a rate of 9 mL / sec using a power injec- tor (Angiomat 6000, Liebel-Flarsheim Co, Cincinnati, Ohio, U.S.A.). The total injected amount was 80-100 ml. Both lower extremities from the common iliac to the distal tibial arteries were examined simultaneously by manual stepping of the table to chase the bolus of con- trast medium. Four or five steps were required to cover the whole of the lower extremity, and during each step, two to four images were acquired.
D
Daattaa aannaallyyssiiss
Arteries of the lower extremity were divided into five groups, in order of size (Table 1). Group I included the largest arteries of the lower extremities, such as the common iliac, whereas group V contained the smallest arteries, such as the circumflex iliac. A ‘blind method’
was used to arrive at an interpretation of both CEMRA
and DSA, with an interval of at least one-week between the two, the interpretation being concluded by agree- ment between two radiologists. The arteries depicted by both examinations were compared in three ways.
Firstly, the arterial detectability of low-dose CEMRA was assessed. Visualized arteries in each arterial group were counted, and the numbers summated for both CEMRA and DSA images (Table 1). Based on the result of DSA, true and false depictions were counted in each group and a cross-table analysis was performed.
Secondly, the ability of low-dose CEMRA to estimate the severity of stenosis was examined. All stenotic le- sions visualized by CEMRA were graded using a five- point method: normal, grade 0; mildly stenotic (50%), grade 1; moderately stenotic (51%-75%), grade 2; se- verely stenotic (76%-99%), grade 3; and occluded or not visualized, grade 4 (14). Using bi-directional correla- tive analysis, this result was then compared with the findings of DSA. The arteries included in group V were too small to allow the objective grading of stenosis, and accordingly, this group was excluded from this compari- son.
Thirdly, the detectability of significant stenosis (more than 50% of a vessel’s diameter) by low-dose CEMRA was assessed. The number of significantly stenotic le- sions was counted in each angiogram, and true and the false depictions by CEMRA were analyzed and correlat- ed with the results of DSA.
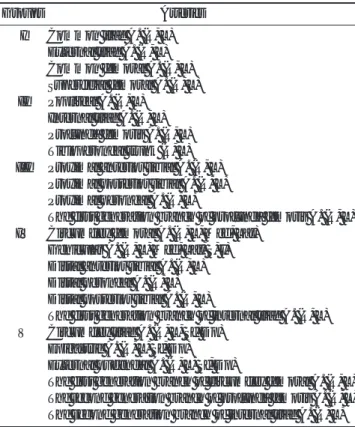
Table 1. The Grouping of Arteries of Lower Extremity, by Their Sizes
Groups Arteries
I Common iliac A. (R, L) External iliac A. (R, L) Common femoral A. (R, L) Superficial femoral A. (R, L) II Popliteal A. (R, L)
Internal iliac A. (R, L) Profunda femoris A. (R, L) Tibioperoneal trunk (R, L) III Proximal anterior tibial A. (R, L)
Proximal posterior tibial A. (R, L) Proximal peroneal A. (R, L)
The first generation branch of profunda femoris A. (R, L) IV Circumflex femoral A. (R, L, Med, Lat)
Genicular A. (R, L, Med, Lat, S, I) Distal anterior tibial A. (R, L) Distal peroneal A. (R, L) Distal posterior tibial A. (R, L)
The first generation branch of internal iliac A. (R, L) V Circumflex iliac A. (R, L, Sf, Dp)
Epigastric A. (R, L, Sf, Dp) External pudendal A. (R, L, Sf, Dp)
The first generation branch of circumflex femoral A. (R, L) The second generation branch of profunda femoris A. (R, L) The second generation branch of internal iliac A. (R, L) A = artery, R = right, L = left, Med = medial, Lat = lateral, S = superior, I = inferior, Sf = superficial, Dp = deep
Fig. 1. The arterial detectability of low-dose contrast-enhanced MR angiography was evaluated on the basis of conventional digital subtraction angiography. In whole groups, the positive predictive value (PPV) and specificity (Sp) were high which is in contrast to its low sensitivity (Sn) and negative predictive value (NPV). Although PPV and Sp were high in all groups, Sn and NPV showed an abrupt decrease in groups IV and II, re- spectively. The accuracies (Acc) in groups I, II, and III, were high (over 90%), however, in the other groups the accuracy de- creased to less than 70%.
R Reessuullttss
A total count of arterial groups in all patients was con- ducted, with 223 arteries depicted by CEMRA, and 319 by conventional DSA. Overall arterial depiction by CEMRA had a relatively high specificity (Sp, 99%) and positive predictive value (PPV, 99.6%), in contrast to its relatively low sensitivity (Sn, 70%) and negative predic- tive value (NPV, 47%). Although Sn and accuracy (Acc) were greater than 90% throughout group III, both de- creased dramatically in groups IV and V, and in group II, NPV was also sharply reduced. Sp and PPV, howev- er, maintained high values in all groups (Table 2, Figure 1). Fisher’s exact test. Showed that the results were sta- tistically significant (p<0.01). In summary all arteries vi- sualized by low-dose CEMRA were also visualized by D- SA, though the converse was not true (Fig. 2).
CEMRA detected 60 stenotic lesions. A comparison of stenosis grading scores awarded to CEMRA and DSA images demonstrated an overall correlation coefficient of 0.35*. In groups I and II, the correlation coefficient was 0.63*, but in the other groups the coefficient de- creased markedly, resulting in no statistical significance (Fig. 3). By plotting the grading scores, the tendency of CEMRA to overestimate became apparent, and despite the lack of statistical significance, this was more obvious in groups III and IV (Fig. 4). The grade of stenosis awarded by the two methods to arteries larger than the tibioperoneal trunk correlated well, although DSA gave a grading score about 0.6 times lower than that of CEM- RA (Fig. 5).
Among the total of 60 stenotic lesions depicted by
CEMRA, 47 were regarded as having significant steno- sis. According to the findings of DSA, however, signifi- cant stenosis was confirmed in only 25. Overall Sn and NPV reached 100%, whereas Sp, PPV, and Acc were 37%, 53%, and 63%, respectively. Although PPV and Acc showed relatively high values of over 70% in groups I and II, in the other groups these values de- creased to below 50% (Table 3, Figure 6). CEMRA tend- ed to overestimate in this comparison, too. The PPV of significant stenosis decreased extensively in arteries s- maller than the proximal tibial, though it was better than 70% in larger arteries. Where low-dose CEMRA
Table 2. Arterial Detectability of Low-dose Contrast-enhanced MR Angiography Based on Conventional Digital Subtraction Angiography
Group I II III IV V Global
TP40 046 051 050 35 222
TN8 005 003 040 29 085
FP0 000 000 001 00 001
FN1 004 003 049 40 097
Sn (%) 098 092 094 51 047 70.0
Sp (%) 100 100 100 98 100 99.0
PPV (%) 100 100 100 98 100 99.6
NPV (%) 089 056 050 45 042 47.0
Acc (%) 098 093 095 64 062 76.0
All statistical results are significant to (p < 0.01) by Fisher’s exact test.
TP = True positive, TN = True negative, FP = False positive, FN = False negative, Sn = Sensitivity, Sp = Specificity, PPV = Positive predictive value,
NPV = Negative predictive value, Acc = Accuracy
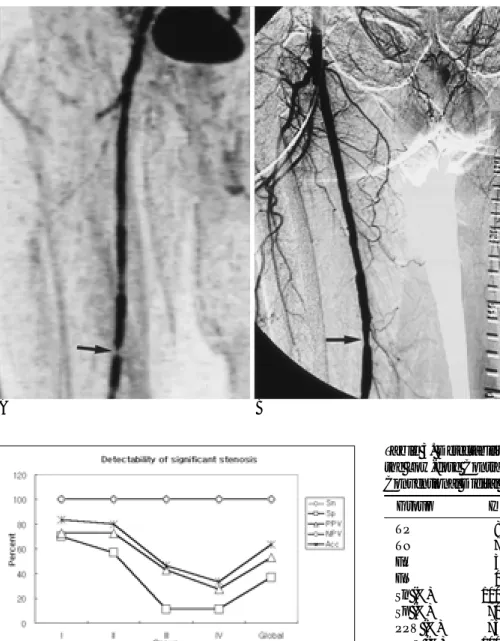
Fig. 2. Comparison of arterial detectability. In low-dose con- trast-enhanced MR angiography (A), 34 arteries were detected in the whole of the lower extremities, whereas 43 arteries were found in conventional digital subtraction angiography (B). The sensitivity and specificity were 79% and 100%, re- spectively. All arteries depicted in MR angiography (A), were also observed in conventional angiography (B). Although there was false negative depiction, no false positive angiography was observed in MR angiography. Two stations were united in (A), and five stations were united in (B).
A B
did not detect significant stenosis, this suggested, cor- rectly, that the condition would not be detected by DSA, either. This was true of all arterial groups visualized by CEMRA.
D
Diissccuussssiioonn M
MRR IImmaaggiinngg PPrroottooccooll
Since subjects were examined by two-station MR an- giography, the contrast dose per station was set to 0.075 mmol / kg in order to limit the total quantity adminis- tered per patient to 0.15 mmol / kg. This low dose be- came a practical possibility because of the bolus injec- tion of contrast medium and the scan timing calculation performed for each subject. In previous reports dealing with MR aortography (5, 8), doses of gadolinium chelate as large as 60 mL have been used to ensure adequate ar- terial enhancement. Other reports, however, have claimed that 0.1 mmol / kg is sufficient to acquire ade- quate artery-to-background contrast, if the central k- space can be filled at the critical time and bolus injection of contrast medium can be performed (12, 13). Accord- ing to the latter suggestion, we used a contrast medium level of 0.1 mmol / kg per station. At a later stage of this work the amount of contrast medium was reduced fur- ther to 0.075 mmol/Kg, at which level satisfactory CEMRAs of the lower extremities were acquired.
Although 2-D TOF CEMRA using 0.05 mmol / Kg con- trast medium has been shown to be superior to the con- ventional 2-D TOF technique (10), we adopted 3-D tur- bo-FLASH and the result was compared with conven- tional digital subtraction angiography.
Since the variables for the scan delay time calculation were arterial peak enhancement time and acquisition time, information about the time of venous enhance- ment or optimum bolus length was not obtained. Thus, the acquisition time was set at the minimum, in spite of the lower resolution. A surface coil was not used in this study because it was not able two stations to cover the whole length of the lower extremities, and this provides another possible way of improving the quality of CEM- RA. In the case of short coverage, the surface coil could be used to increase the signal-to-noise ratio between the arteries and the background.
The timing examination was performed at the in- frarenal abdominal aorta because the respiratory motion was less severe and enhancement was strong in this area. Respiratory motion produced a radial pattern cen- tered in the area of the aorta, and no marked shifting of
aorta beyond the ROI boundary occurred. In the litera- ture, several methods of determining scan delay time have been suggested (7, 5, 13, 16), the most commonly used having been suggested by Prince (5). This formula (arterial peak enhancement time+half of contrast-injec- tion duration - half of acquisition time) allowed a specif- ic scan delay time to be calculated for each patient. In this method, in order to match the center of the main bolus to the center of the k-space, half the contrast-injec- tion duration was added. This procedure is based on the premise that the length of the bolus is equal to the dura- tion of injection, but for the main bolus, this is not in fact the case: the time-intensity curve produced by test- bolus injection showed that the bolus length was up to 16 times greater (13). In this work, this kind of mis- match was also generally observed, and because of these discrepancies we excluded the injection duration parameter and produced our own protocol.
D
Daattaa AAnnaallyyssiiss
The ability of low-dose CEMRA to detect arteries was compared to that of conventional DSA, assuming that D- SA displays arteries perfectly, and the number depicted by DSA was 1.8 times greater than that detected by CEMRA. The practical difference between the two methods is best demonstrated by the number of false depictions by CEMRA, almost all of which were false negatives. Only one depiction was a false positive;
CEMRA detected an artery not revealed by DSA. This Fig. 3. The correlation of stenosis-grading scores between low- dose contrast-enhanced MR angiography and conventional digital subtraction angiography revealed statistical significance in group I, II and in global groups. In group III and IV, there were no significant correlations.
was because the anterior tibial artery was accidentally subtracted during DSA’s computerized image assembly, a fact attributed to motion during exposure. This artery was identified by Doppler ultrasonography; the same artery identified by CEMRA was not imaginary, and there was, therefore, no case of a false positive detection of an artery by CEMRA. All false values were caused by omissions. Because of these facts, we are convinced that the PPV of low-dose CEMRA was 100%. Thus, if arter- ies are detected by CEMRA, complete arterial obstruc- tion can be excluded. In arteries greater than the superfi- cial femoral artery (group I), the NPV of CEMRA was al- so high enough to predict the absence of the artery. Due to the high Sp and PPV of low-dose CEMRA, for the de- tection of arteries, this method could be used as a screening test for the purpose of arterial identification.
For these in group I, the method could also be used to i-
dentify obstruction.
It is apparent that the depiction of an artery by CEM- RA excludes the possibility of complete arterial obstruc- tion, though the severity of stenosis can not be estimat- ed on this basis. Measurement of the severity of stenosis by low-dose CEMRA was analyzed in order to augment the technique in some way and allow low-dose CEMRA to be used for the diagnostic study of arterial stenosis.
As can be seen from the results, it is clear that low-dose CEMRA overestimated stenosis, a tendency which is understood to be the main drawback of this modality (1). The statistically significant correlation in groups I and II was, however, noteworthy, and armed with an understanding of the degree of overestimation by CEM- RA, the severity of stenotic lesions in arteries larger than the tibioperoneal trunk could be estimated. In arteries s- maller than this, the tendency of CEMRA to overesti- Fig. 4. The grading scores of stenotic lesions were plotted by group. The whole-data plotting regardless of groups (A) revealed that most plots were located in the ‘MR angiography’side showing a deviated trend-line (solid line) towards the X-axis. This result im- plies the overestimating tendency of contrast-enhanced MR angiography. This tendency was exaggerated in group III and IV (D, E).
Actually there was no plot on the ‘conventional angiography’side in group II, III, and IV (C-E). In groups I and II, which showed a statistically significant correlation, the fitting equation disclosed a stenosis-grading score for conventional angiography a factor of 0.6 times lower than that of MR angiography. The number of points on the graph (A) is not equal to the total number of recorded stenosis (n=60), because some of the points overlap.
A B C
D E F
mate was very large, and this led to the conclusion that the differences noted between CEMRA and DSA were not statistically significant. Prediction of the severity of stenosis in smaller arteries was thus thought inadvis- able.
In the literature, hemodynamically significant stenosis is defined as the narrowing of a vascular diameter by more than 50% and a decrease of cross sectional area to less than 25% (17). From the viewpoint of clinicians, the concept of significant stenosis is more important than its
grading. Thus, the detectability of significant stenosis would be a more practical criterion to apply to the eval- uation of a stenotic lesion. Several reports have been published in which more than the standard dose of con- trast medium has been used, and these have verified the sensitivity and specificity of CEMRA in arteries of the lower extremity as 100% and 69% (18), 92% and 88%
(1), and 100% and 97% (19). In this study, the overall sensitivity and specificity were 100% and 37%, a rela- tively low specificity compared to that of previous re- ports. In group I arteries, however, which were the sub- ject of these earlier reports, specificity was 70%. In Fig. 6. In low-dose contrast-enhanced MR angiography, the de-
tectability of significant stenosis, more than 50% in diameter, disclosed a sensitivity (Sn) and negative predictive value (NPV) of 100% in all groups. Whereas, specificity (Sp), positive pre- dictive value (PPV), and accuracy (Acc) showed an abrupt de- crease in groups III and IV. The whole data group revealed high Sn and NPV, although the other parameters were relative low.
A B
Fig. 5. The overestimating tendency of low-dose contrast-enhanced MR an- giography. CEMRA (A) shows grade III stenosis at distal portion of right super- ficial femoral artery, whereas DSA (B) shows grade I or II stenosis at the same point (arrows).
Table 3. Detectability of Significant Stenosis (more than 50%) in the Low-dose Contrast-enhanced MR Angiography Compared to Conventional Digital Subtraction Angiography
Group I II III IV Global
TP 008 008 006 003 025
TN 007 004 001 001 013
FP 003 003 008 008 022
FN 000 000 000 000 000
Sn (%) 100 100 100 100 100
Sp (%) 070 057 011 011 037
PPV (%) 073 073 043 027 053
NPV (%) 100 100 100 100 100
Acc (%) 083 080 047 033 063
TP = True positive, TN = True negative, FP = False posi-tive, FN = False negative, Sn = Sensitivity, Sp = Specificity, PPV = Positive predictive value,
NPV = Negative predictive value, Acc = Accuracy
terms of this comparison, it is apparent that there is no marked difference in the detectability of significant stenosis between the low-dose CEMRA method and CEMRA using higher doses of contrast medium.
Because of the tendency of CEMRA to overestimate, its accuracy is not as high as its sensitivity or its negative predictive value. This latter also reached 100% in all ar- terial groups, showing the usefulness of low-dose CEM- RA for the screening of significant stenosis, which could thus be excluded if not revealed by low-dose CEMRA.
In this study, DSA, due to its clear depiction of arter- ies, was regarded as the standard. By comparison, the pitfalls of CEMRA are thought to arise because of ve- nous enhancement, the overestimation of stenosis, and motion induced subtraction failure. The tendency to overestimate is believed to be due to spin dephasing, caused by turbulent flow, that cannot be compensated for by using gadolinium chelate (1). In Korea, the cost of CEMRA is another disadvantage, because of a lack of support by the medical insurance companies. Its ability to depict subtle eccentric plaque, however, which can not be detected by DSA in an en face projection, is re- garded as a value of CEMRA (5, 7, 20, 21). The evalua- tion of tortuous arteries was also reported to be easier by CEMRA than by DSA (5, 14, 20, 21). The other advan- tages which CEMRA has over DSA are that ionizing ra- diation and iodine contrast media are not required, it has a large field of view, multiplanar reprojection, is less invasive and easier to apply, and is safer in terms of out- patient examination (1).
S Suummmmaarryy
Low-dosage CEMRA has a high positive predictive value in arterial detection and a high negative predictive value of significant arterial stenosis in all arterial groups of the lower extremities. A statistically significant corre- lation with stenosis grading was noted in greater arter- ies, although its tendency to overestimate persisted. We thus conclude that the use of low-dose contrast-en- hanced MR angiography can exclude the possibility of significant stenosis or complete obstruction in arteries of the lower extremities, and can grade stenosis in arteries greater than the tibioperoneal trunk. Due consideration must be given, however, to the tendency of CEMRA to overestimate.
References
1. Yamashita Y, Mitsuzaki K, Ogata I, Takahashi M, Hiai Y. Three-di-
mensional hihg-resolution dynamic contrast-enhanced MR angiog- raphy of the pelvis and lower extremities with use of a phased ar- ray coil and subtraction: Diagnostic accuracy. J Magn Reson Imaging 1998;8:1066-1072
2. Ho KY, Haan MW, Kessels AGH, Engelshoven JMA. Peripheral vascular tree stenoses: Detection with subtracted and nonsubtract- ed MR angiography. Radiology 1998; 206:673-681
3. Borrello JA, Li D, Vesely TM, Vining EP, Brown J, Haacke EM.
Renal arteris: Clinical comparison of three-dimensional time-of- flight MR angiographic sequences and radiographic angiography.
Radiology 1995; 197:793-799
4. Cobelli FD, Vanzulli A, Sironi S, et al. Renal artery stenosis:
Evaluation with breath-hold, three-dimensional, dynamic, gadolini- um-enhanced versus three-dimensional, phase-contrast MR angiog- raphy. Radiology 1997;205:689-695
5. Prince MR, Narasimham DL, Stanley JC, et al. Breath-hold gadolin- ium-enhanced MR angiography of the abdominal aorta and its ma- jor branches. Radiology 1995;197:785-792
6. Slosman F, Stolpen AH, Lexa FJ, et al. Extracranial atherosclerotic carotid artery disease: Evaluation of non-breath-hold three-dimen- sional gadolinium-enhanced MR angiography. AJR Am J Roent- genol 1998;170:489-495
7. Ho KYJAM, Leiner T, Haan MW, Kessels AGH, Kitslaar PJEHM, Engelshoven JMA. Peripheral vascular tree stenoses: Evaluation with moving-bed infusion-tracking MR angiography. Radiology 1998;206:683-692
8. Holland GA, Dougherty L, Carpenter JP, et al. Breath-hold ultra- fast three-dimensional gadolinium-enhanced MR angiography of the aorta and the renal and other visceral abdominal arteries. AJR Am J Roentgenol 1996;166:971-981
9. Shetty AN, Shirkhoda A, Bis KG, Alcantara A. Contrast-enhanced three-dimensional MR angiography in a single breath hold: a novel technique. AJR Am J Roentgenol 1995;165:1290-1292
10. Lee HM, Wang Y, Sostman HD, et al. Distal lower extremity arter- ies: Evaluation with two-dimensional MR digital subtraction an- giography. Radiology 1998;207:505-512
11. Douek PC, Revel D, Chazel S, Falise B, Villard J, Amiel M. Fast MR angiography of the aortoiliac arteries and arteries of the lower extremity: Value of bolus-enhanced, whole-volume subtraction technique. AJR Am J Roentgenol 1995;165:431-437
12. Prince MR. Body MR angiography with gadolinium contrast agents.
Magn Reson Imaging Clin N Am 1996;4:11-24
13. Earls JP, Rofsky NM, DeCorato DR, Krinsky GA, Winreb JC.
Breath-hold single-dose gadolinium-enhanced three-dimensional MR aortography: Usefulness of a timing examination and MR power injector. Radiology 1996;201:705-710
14. Prince MR. Gadolinium-enhanced MR aortography. Radiology 1994;
191:155-164
15. Thurnher SA, Dorffner R, Thurnher MM, et al. Evaluation of ab- dominal aortic aneurysm for stent-graft placement: Comparison of gadolinium-enhanced MR angiography versus helical CT angiogra- phy and digital subtraction angiography. Radiology 1997;205:341- 352
16. Kopka L, Vosshenrich R, Mueller D, Fischer U, Rodenwaldt J, Grabbe E. Results of a contrast-enhanced three-dimensional MR angiography in a single breath-hold after optimization of the con- trast material bolus. Fortschr Roentgenstr 1997;166:15-20
17. Kohler TR. Hemodynamics of arterial occlusive disease. In: Strand- ness DE, Jr., Breda AV, ed. Vascular diseases: Surgical and interven- tional therapy. 1st ed. New York, Churchill Livingstone Inc., 1994;
65-71
18. Adamis MK, Li W, Wielopolski PA, et al. Dynamic contrast-en-
hanced subtraction MR angiography of the lower extremities:
Initial evaluation with a multisection two-dimensional time-of- flight sequence. Radiology 1995;196:689-695
19. Laissy JP, Debray MP, Menegazzo D, et al. Prospective evaluation of peripheral arterial occlusive disease by 2D MR subtraction an- giography. J Magn Reson Imaging 1998;8:1060-1065
20. Kent KC, Edelman RR, Kim D, Steinman TI, Porter DH, Skillman
JJ. Magnetic resonance imaging: a reliable test for the evaluation of proximal atherosclerotic renal arterial stenosis. J Vasc Surg 1991;
13:311-318
21. Gibson M, Cook G, Gedryc WM. Case report: renal transplant artery stenosis - three cases where magnetic resonance angiogra- phy was superior to conventional arteriography. Br J Radiol 1995;
68:89-92
대한방사선의학회지 2000;42:909-917
표준용량이하의 Gadolinium Chelate를 이용한 조영증강 자기공명혈관촬영술:
고식적 디지털감산혈관촬영술과의 비교11경북대학교 의과대학 의학과 진단방사선학교실
이종민・장용민・김용선・김용주・강덕식
목적: 표준용량 이하의 조영제를 이용한 조영증강 자기공명 혈관촬영술의 효과판정을 위해 본 연구를 시행하였다.
대상과 방법: 8명의 환자의 하지를 대상으로 총 16회의 검사를 시행하였다. 조영제는 검사 당 0.075 mmol/kg 의 용
량을 3 ml/sec의 속도로 급속 주입하였다. 1.5 Tesla 자기공명기에서 3D turbo-FlASH 기법으로 촬영하였다. 촬영 후 동맥기 영상을 고식적인 디지털감쇄혈관촬영 사진을 기준으로 비교 분석하였다. 하지 동맥들을 크기에 따라 5개 의 그룹으로 분류하고 각 그룹에서 인지된 동맥의 수, 협착의 정도, 유의협착의 수를 비교하였다.
결과:조영증강 혈관조영술의 동맥검출능은 모든 그룹에서 높은 특이도 (98%-100%)를 보였고 1, 2, 3 그룹에서는 높은 민감도 (>90%)을 보였다. 협착정도 판정에 있어서는 1, 2 그룹에서 각각 0.65*와 0.60*의 상관계수를 보였으 나 과대 측정하는 경향을 보였다. 유의협착 검출능은 모든 그룹에서 높은 민감도 (100%)를 보였으나 특이도는 낮았 다 (<70%).
결론: 저용량 조영증강 자기공명 혈관촬영술은 하지 동맥에서 유의협착을 발견하는데 유용하였고 과다측정정도를 고 려한다면 경골비골동체보다 큰 동맥에서는 협착정도 판정에도 이용될 수 있을 것이다.
대한방사선의학회의 홈페이지에 접속하는 방법
1) 인터넷에 접속된 상태에서 넷스케이프사의 네비게이터 4.0이상 또는 마이크로소프트사의 익스플로러 4.0이 상의 버전을 실행해야 합니다.
2) 익스플로러의 경우에는“주소”라는 입력란에, 네비게이터의 경우에는“위치(Location) 또는 Netsite”라는 입력란에 http://www.radiology.or.kr을 입력한 다음 엔터를 치면 대한방사선의학회의 홈페이지로 연결됩 니다.