http://dx.doi.org/10.7841/ksbbj.2019.34.3.173 ISSN 1225-7117 / eISSN 2288-8268
배지 성분의 통계적 최적화를 이용한 북극 미세조류 Chlamydomonas sp. KNM0029C의 지질 생산 증대
김은재1,2, 정웅식1,3, 김상희1, 최한구1*, 한세종1,2*
Enhancing Lipid Production in the Arctic Microalga
Chlamydomonas sp. KNM0029C by Using Statistical Optimization of Medium Components
Eun Jae Kim1,2, Woong Sic Jung1,3, Sanghee Kim1, Han-Gu Choi1*, and Se Jong Han1,2*
Received: 10 July 2019 / Revised: 30 July 2019 / Accepted: 30 July 2019
© 2019 The Korean Society for Biotechnology and Bioengineering
Abstract: A sequential statistical optimization was applied to the components of Tris-acetate-phosphate (TAP) medium, to enhance the cell density and lipid production of Arctic microalga Chlamydomonas sp. KNM0029C. The evaluation was preformed through an elimination process and Plackett- Burman design to select for significant factors, contributing toward cell growth. NH
4Cl, MgSO
4·7H
2O, potassium phos- phate, and trace elements were established as the effective components and used as variable factors in Box-Behnken design test, - a response surface methodology (RSM). The final opti- mized concentrations were 0.54, 0.16, 0.04, and 0.08 g/L of NH
4Cl, MgSO
4·7H
2O, potassium phosphate, and trace ele- ments, respectively. Overall, 9.9% enhanced lipid production was achieved by using optimized TAP medium at 4°C. The
results of the present study could potentially contribute toward large-scale lipid production at low temperatures.
Keywords: arctic microalgae, Chlamydomonas sp. KNM0029C, lipid, response surface methodology, statistical optimization, tris–acetate-phosphate
1. INTRODUCTION
Bacteria, yeast, algae, and fungi, that inhabit cold environments, have developed various adaptations to compensate for the adverse effects of low temperatures [1]. Cold-adapted microorganisms are the source of valuable products, including cold-active enzymes, and antifreeze proteins [2,3]. Recently, the microalga Chlamydomonas sp. KNM0029C - a species, capable of oil production, was isolated from the Arctic sea [4]. The organism which displays high total fatty acid content, exhibits promising potential as a potent biodiesel producer at low temperatures.
The major benefit of Chlamydomonas sp. KNM0029C is its ability to grow under cold climate conditions, most prominently during the winter season. Our study focuses on investigating the effective medium composition for optimal Arctic microalga growth, and establishing the efficient lipid production conditions for this microorganism. The classical medium optimization method of changing one independent variable, while keeping
1한국해양과학기술원 부설 극지연구소 극지생명과학연구부
1Division of Polar Life Sciences, Korea Polar Research Institute, Incheon 21990, Korea
HGC: Tel: +82-32-760-5511, Fax: +82-32-760-5509 e-mail: [email protected]
2과학기술연합대학원대학교 극지과학전공
2Department of Polar Sciences, University of Science and Technology, Incheon 21990, Korea
SJH: Tel: +82-32-760-5521, Fax: +82-32-760-5509 e-mail: [email protected]
3지디이 연구소
3Department of Research and Development, GDE, Siheung, Gyeonggi 14985, Korea
Research Paper
2.1. Strain and culture media
The Arctic marine microalga Chlamydomonas sp. KNM0029C (KCTC 12730BP, formerly KOPRI-ArM0029C) was isolated from sea ice near the Dasan station in Ny-Alesund, Spitsbergen, Norway [4]. The culture was maintained on Tris–acetate- phosphate (TAP) medium. The unoptimized medium contained the following (g/L): Tris base, 2.42; NH
4Cl, 0.375; MgSO
4·7H
2O, 0.1; CaCl
2·2H
2O, 0.05; potassium phosphate, 0.432 (K
2HPO
4, 0.288 and KH
2PO
4, 0.144), plus 1 mL acetic acid, along with 1mL/L trace elements, composed of (g/L): Na
2EDTA·2H
2O, 50; ZnSO
4·7H
2O, 22; H
3BO
3, 11.4; MnCl
2·4H
2O, 5; FeSO
4·7H
2O, 5; CoCl
2·6H
2O, 1.6; CuSO
4·5H
2O, 1.6; (NH
4)
6MoO
3, 1.1.
2.2. Culture conditions
Approximately 2.0×10
5cells mL
-1were inoculated in TAP medium and cultured for 2 weeks at 4°C under cool, white, fluorescent lamps (40 µmol photon m
-2s
-1) on a 16:8 light-dark cycle. For the nitrogen starvation study, cultures were grown for 2 weeks before being centrifuged at 4000 rpm for 5 min at 4C. The cell pellets were retained, washed twice with nitrogen- free TAP (TAP-N) and then resuspended in same medium for further growth and lipid production.
2.3. Statistical optimization
The Plackett-Burman design [10] was used to identify the essential components, influencing the growth of KNM0029C.
Based on its results, seven elements of the TAP medium were isolated and examined at two levels, low (−) and high (+),
is the response (number of cells), b
0, b
i, b
ij, and b
iiare the constant and regression coefficients of the model, and X
iand X
jrepresent the independent nutrient component.
2.4. Cell growth monitoring and assay of lipid
The growth of KNM0029C was monitored by visualizing the number of cells using a hemocytometer and an optical microscope (Zeiss Axio Imager.A2, Germany). Total lipids were extracted from 20 mg of freeze-dried samples, and fatty acid methyl esters (FAMEs) were prepared and analyzed as described by Kim et al [4]. Fatty acids were quantified against the internal standard (1 mg of C16:0 in hexane), and the values were summed and expressed as milligrams of FAME per gram of dry cell weight (DCW). In general, 1.0×10
6cells corresponded to 0.09 ± 0.002 mg DCW.
3. RESULTS AND DISCUSSION
3.1. Components selection
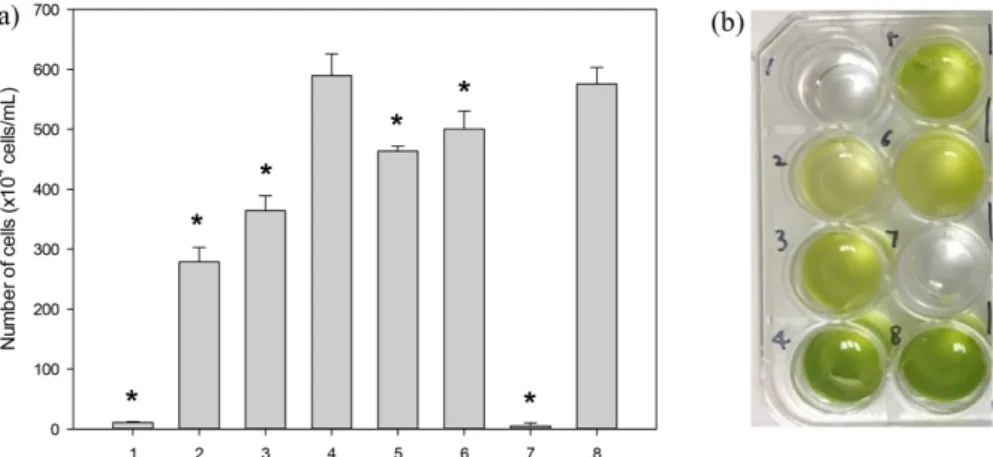
To eliminate unnecessary medium constituents, each of the seven elements was individually tested. Table 1 summarizes the test levels, effects, t-statistics, and P-values. Results with a P-value of <0.05 were accepted as significantly affecting the KNM0029C growth. CaCl
2·2H
2O displayed a result >0.05, indicating that this compound was not a significant factor (Fig.
1). The other components, (Tris base, NH
4Cl, MgSO
4·7H
2O, potassium phosphate, trace elements, and acetic acid), all exhibited P-values of <0.05, and were therefore retested using Table 1. Statistical analysis of medium components, using the initial Plackett–Burman experiment
Variable Medium component + value (g/L) − value (g/L) Effect t-statistic P-value
X1 Tris base 0 2.42 564.6 17.19 0.000
X2 NH4Cl 0 0.375 296.7 9.03 0.000
X3 MgSO4·7H2O 0 0.1 211.3 6.43 0.000
X4 CaCl2·2H2O 0 0.05 −13.7 −0.42 0.683
X5 Potassium phosphate 0 0.432 111.7 3.40 0.004
X6 Trace elements 0 0.0977 75.0 2.28 0.036
X7 Acetic acid 0 1.0 570.3 17.36 0.000
a secondary Plackett-Burman design. Potassium phosphate and trace elements were identified as negatively effective while NH
4Cl and MgSO
4·7H
2O were found to be positively correlated with KNM0029C growth (Table 2).
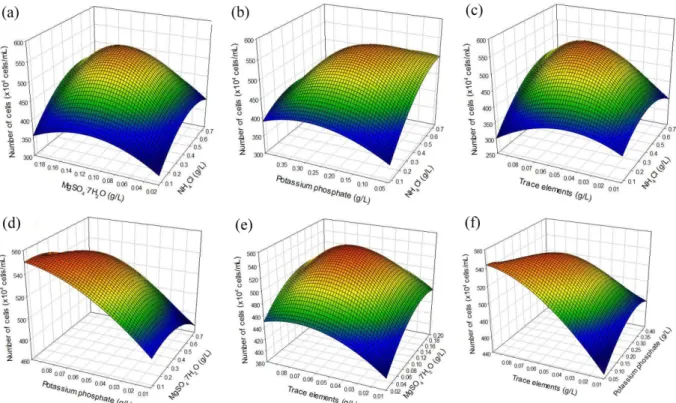
3.2. Optimization of medium components for KNM0029C growth
The effects of the six established elements were further studied, using a Box-Behnken design. The amounts of potassium
Fig. 1 Effect of medium components on the KNM0029C cell growth. (a) Number of cells (b) Image of cell growth in the absence of 1, Tris base; 2, NH4Cl; 3, MgSO4·7H2O; 4, CaCl2·2H2O; 5, Potassium phosphate; 6, Trace elements; 7, Acetic acid; 8, Control (no absence). Asterisks denote P < 0.05.Table 2. Statistical analysis of selected medium components, using the secondary Plackett–Burman design
Variable Medium component − value (g/L) + value (g/L) Effect t-statistic P-value
X1 Tris base 0.484 4.84 −22.0 −1.11 0.279
X2 NH4Cl 0.075 0.75 57.4 2.90 0.009
X3 MgSO4·7H2O 0.02 0.2 57.4 2.90 0.009
X4 Potassium phosphate 0.0864 0.864 −47.0 −2.37 0.028
X5 Trace elements 0.01954 0.1954 −320.3 −16.18 0.000
X6 Acetic acid 0.2 2.0 −23.1 −1.17 0.257
Table 3. Box-Behnken optimization of selected significant medium components
Variable Medium component − value (g/L) 0 value (g/L) + value (g/L)
X1 NH4Cl 0.075 0.4125 0.75
X2 MgSO4·7H2O 0.02 0.11 0.2
X3 Potassium phosphate 0.0432 0.2376 0.432
X4 Trace elements 0.00977 0.053735 0.0977
Table 4. Response surface regression for selected medium component, using Box-Behnken design
Term Coefficient SE coefficient T P
Constant 542.3 27.46 19.749 0.000
X1 (NH4Cl) 40.0 13.73 2.913 0.015
X2 (MgSO4) 26.4 13.73 1.922 0.084
X3 (Potassium phosphate) −15.1 13.73 −1.103 0.296
X4 (Trace elements) 19.6 13.73 1.426 0.184
X12 −128.6 20.60 −6.244 0.000
X22 −33.5 20.60 −1.627 0.135
X32 −5.4 20.60 −0.262 0.799
X42 −57.5 20.60 −2.791 0.019
X1X2 11.1 23.78 0.466 0.651
X1X3 −35.9 23.78 −1.510 0.162
X1X4 36.3 23.78 1.528 0.158
X2X3 −5.2 23.78 −0.217 0.832
X2X4 −5.4 23.78 −0.228 0.824
X3X4 −29.5 23.78 −1.240 0.243
R
2=88.9%, R
2(adj)=71.1%
3.3. Comparison of KNM0029C growth and lipid production in original vs optimized
To confirm our results KNM0029C growth was evaluated in different media via the Box-Behnken design. Figure 3 illustrates the number of microalga cells per unit of time in identical culture conditions, but in the two different TAP-environments.
Maximal concentrations of 5.28 and 5.37×10
6cells/mL were obtained in original and optimized- medium, respectively, indicating slightly enhanced cell growth in the latter conditions and the adequacy of our mathematical model. To evaluate the production of lipids, a nitrogen starvation study was performed.
KNM0029C cells were cultivated for 2 weeks at 4
oC in
original and optimized TAP medium, before being deprived of viable nitrogen sources- NH
4Cl and trace elements were also not added. After an additional two-week period, the cells were harvested and analyzed (Fig. 4). Our data indicate higher lipid production of 120.1 mg FAME/g DCW and a 9.9% yield increase in the optimized TAP medium.
Fig. 2. Three-dimensional response plot showing the effect of (a) NH4Cl and MgSO4·7H2O, (b) NH4Cl and potassium phosphate, (c) NH4Cl and trace elements, (d) MgSO4·7H2O and potassium phosphate, (e) MgSO4·7H2O and trace elements, and (f) Potassium phosphate and trace elements.
Fig. 3. Time profile of KNM0029C cell growth. Solid circle conveys original and open circle represents optimized TAP conditions.
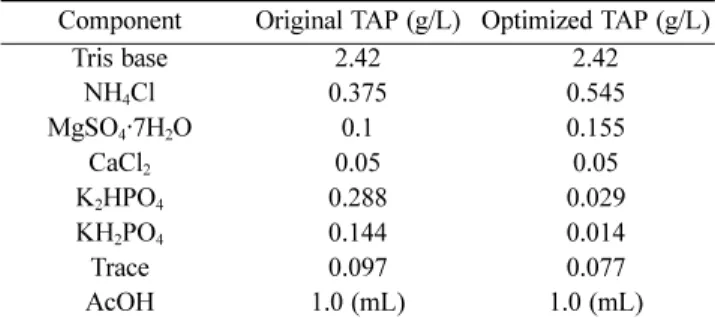
4. CONCLUSION
To enhance the growth of Arctic microalga Chlamydomonas sp. KNM0029C, medium components were statistically optimized via the Plackett-Burman and Box-Behnken designs. The final composition was as follows (g/L): Tris, 2.42; NH
4Cl, 0.545;
MgSO
4·7H
2O, 0.155; CaCl
2, 0.05; K
2HPO
4, 0.029; KH
2PO
4, 0.014; trace, 0.077; and one mL of AcOH (Table 5). The amounts of negatively effective components, like K
2HPO
4, KH
2PO
4, and trace were diminished, whereas those, correlated with growth, including NH
4Cl and MgSO
4·7H
2O were elevated.
Overall, 9.9% increase in lipid production was obtained by a sequential statistical analysis.
Until recently, no practical information was available on the optimal environmental conditions of Arctic microalgae growth.
The present study provides a suitable medium composition for raising and improving lipid production by Chlamydomonas sp.
KNM0029C.
Acknowledgements
The research was supported by a grant from the Korea Polar Research Institute (PE19180). This project was also supported by a grant (PN15070) by iPET (Korea Institute of Planning and Evaluation for Technology in Food, Agriculture, Forestry and Fisheries), Ministry of Agriculture, Food and Rural Affairs, Korea.
REFERENCES
1. Gerday, C., M. Aittaleb, M. Bentahir, J. P. Chessa, P. Claverie, et al. (2000) Cold-adapted enzymes: from fundamentals to biotech- nology. Trends Biotechnol. 18: 103-107.
2. Kim, S., A. R. Wi, H. J. Park, D. Kim, H. W. Kim, et al. (2015) Enhancing extracellular lipolytic enzyme production in an Arctic bacterium, Psychrobacter sp. ArcL13, by using statistical optimi- zation and fed-batch fermentation. Prep. Biochem. Biotechnol. 45:
348-364.
3. Lee, J. H., S. G. Lee, H. Do, J. C. Park, E. Kim, et al. (2013) Opti- mization of the pilot-scale production of an ice-binding protein by fed-batch culture of Pichia pastoris. Appl. Microbiol. Biotechnol.
97: 3383-3393.
4. Kim, E. J., W. Jung, S. Lim, S. Kim, S. J. Han, and H. G. Choi (2016) Growth and lipid content at low temperature of Arctic alga Chlamydomonas sp. KNM0029C. Bioproc. Biosyst. Eng. 39: 151- 157.
5. Govarthanan, M., S. H. Park, J. W. Kim, K. J. Lee, M. Cho, et al.
(2014) Statistical optimization of alkaline protease production from brackish environment Bacillus sp. SKK11 by SSF using horse gram husk. Prep. Biochem. Biotechnol. 44: 119-131.
6. Lo, C. F., C. Y. Yu, I. C. Kuan, and S. L. Lee (2012) Optimization of lipase production by Burkholderia sp. using response surface methodology. Int. J. Mol. Sci. 13: 14889-14897.
7. Wang, Q., C. Zhang, Y. Hou, X. Lin, J. Shen, and X. Guan (2013) Optimization of cold-active lipase production from psychrophilic bacterium Moritella sp. 2-5-10-1 by statistical experimental meth- ods. Biosci. Biotechnol. Biochem. 77: 17-21.
8. Ramani, K., P. Saranya, S. Chandan Jain, and G. Sekaran (2013) Lipase from marine strain using cooked sunflower oil waste: pro- duction optimization and application for hydrolysis and thermody- namic studies. Bioproc. Biosyst. Eng. 36: 301-315.
9. Kazemi, A., S. Rasoul-Amini, M. Shahbazi, A. Safari, and Y.
Ghasemi (2014) Isolation, identification, and media optimization of high-level cellulase production by Bacillus sp. BCCS A3, in a fermentaion system using response surface methodology. Prep.
Biochem. Biotechnol. 44: 107-118.
10. Plackett, R. L. and J. P. Burman (1946) The design of optimum multifactorial experiments. Biometrika 37: 305-325.
11. Box, G. E. P. and D. W. Behnken (1960) Some new three level designs for the study of quantitative variables. Technometrics 2:
455-475.
Fig. 4. Comparison of KNM0029C lipid production in different conditions, where solid bars illustrate cells cultured in original TAP and open bars represent those grown into the optimized medium.
Table 5. Comparison of medium composition of original TAP medium and optimized TAP medium
Component Original TAP (g/L) Optimized TAP (g/L)
Tris base 2.42 2.42
NH4Cl 0.375 0.545
MgSO4·7H2O 0.1 0.155
CaCl2 0.05 0.05
K2HPO4 0.288 0.029
KH2PO4 0.144 0.014
Trace 0.097 0.077
AcOH 1.0 (mL) 1.0 (mL)