Article
https://doi.org/10.14478/ace.2020.10581. Introduction
1)Phosphate is one of the most well-known compounds associated with wastewater streams and is a major nutrient that contributes toward eutrophication, a universal pollution problem faced by fresh water ecosystems. The industrial and municipal effluent streams, containing phosphate, are usually released into water bodies. The accumulated phosphate in the surface water, although having a low concentration, induces algae and plant growth. It depletes the quantity of dissolved oxygen, which, in turn, may lead to fish kills and loss of other aquatic life. This disturbs the balance in the aquatic ecosystem and deteriorates the quality of water. Therefore, it is essential to reduce phosphate lev- els in the wastewater streams before they are discharged into the fresh water ecosystems[1].
To reduce phosphate levels in wastewater streams, several biological, chemical, physical, and physicochemical methods have been employed [2,3]. The adsorption process is more promising in comparison to other procedures owing to its ease of operation, simplicity of design, and economics, provided that low-cost sorbents are used.[4]. Several ad- sorbents such as metal oxides and hydroxides[5,6], layered double hy- droxide (LDH)[7], clay materials[8], industrial by-products such as fly ash[9], metal loaded carbon[10], anion exchange resins[11], and metal loaded silica[12] have been studied for phosphate adsorption.
† Corresponding Author: Pyeongtaek University,
Department of Integrated Environmental Systems, Pyeongtaek 17869, Korea Tel: +82-31-659-8309 e-mail: [email protected]
pISSN: 1225-0112eISSN: 2288-4505 @ 2020 The Korean Society of Industrial and Engineering Chemistry. All rights reserved.
Metal-Organic Frameworks (MOFs), formed by a combination of metallic clusters with organic ligands, have attracted considerable atten- tion as novel adsorbents for catalysis, gas storage and separation, and drug delivery owing to their large surface areas and pore volume[13].
Recently, MOFs have been widely studied for applications in selective adsorption and removal of toxic dyes[14], pharmaceuticals[15], nitro- gen compounds[16], sulfur compounds[17], and heavy metal ions[18].
A major disadvantage of many MOF materials is their limited stabil- ity with regard to temperature fluctuations, and a high reactivity with water, oxygen, along with other chemicals. For example, some Zn
2+- based MOFs, including MOF-5, are liable to hydrolysis when stored at ambient temperature[19]. Very few reports are available on phosphate adsorption using zirconium-based MOFs in the literature. However, re- cently, Zr
4+-based MOFs have attracted researchers’ interest owing to their thermal stability and non-reactivity with water. Moreover, phos- phate adsorption from water and urine via zirconium-based MOFs, UIO-66, and UIO-66-NH
2[20], as well as the adsorption of glyphosate [N-(phosphonomethyl) glycine], an organic phosphate, via a zirco- nium-based MOF (UIO-67) have been reported[21].
In the present study, MOF-801 (zirconium fumarate) was sol- vothermally synthesized and characterized by PXRD and N
2sorption isotherms measured at 77 K. The ability of MOF-801 to adsorb for phosphate from aqueous solutions at 25 ℃ was investigated. The pa- rameters affecting the phosphate removal efficiency (PRE) such as ad- sorbent dosage, contact time and initial phosphate concentration were evaluated. In addition, the experimental data were examined using a nonlinear isotherm model and the pseudo-first-order and pseudo-sec- ond-order kinetic equation.
Adsorptive Removal of Phosphate Ions from Aqueous Solutions using Zirconium Fumarate
Phani B. S. Rallapalli and Jeong Hyub Ha
†Department of Integrated Environmental Systems, Pyeongtaek University, Pyeongtaek 17869, Korea (Received July 27, 2020; Revised August 17, 2020; Accepted August 17, 2020)
Abstract
In this study, zirconium fumarate of metal-organic framework (MOF-801) was solvothermally synthesized at 130 ℃ and char- acterized through powder X-ray diffraction (PXRD) analyses and porosity measurements from N
2sorption isotherms at 77 K. The ability of MOF-801 to act as an adsorbent for the phosphate removal from aqueous solutions at 25 ℃ was investigated. The phosphate removal efficiency (PRE) obtained by 0.05 g/L adsorbent dose at an initial phosphate concen- tration of 60 ppm after 3 h was 72.47%, whereas at 5 and 20 ppm, the PRE was determined to be 100% and 89.88%, re- spectively, after 30 min for the same adsorbent dose. Brunauer-Emmett-Teller (BET) surface area and pore volume of the bare MOF-801 sample were 478.25 m
2/g and 0.52 cm
3/g, respectively, whereas after phosphate adsorption (at an initial con- centration of 60 ppm, 3 h), the BET surface area and pore volume were reduced to 331.66 m
2/g and 0.39 cm
3/g, respectively.
The experimental data of kinetic (measured at initial concentrations of 5, 20 and 60 ppm) and isotherm measurements fol- lowed the pseudo-second-order kinetic equation and the Freundlich isotherm model, respectively. This study demonstrates that MOF-801 is a promising material for the removal of phosphate from aqueous solutions.
Keywords: Eutrophication, Phosphate removal, Metal-organic frameworks, Kinetics, Chemisorption
2. Materials & Methods
2.1. Materials
Zirconium (IV) oxychloride octahydrate (ZrOCl
2⋅8H
2O, 99%), fu- maric acid (C
4O
4H
4, extra pure), formic acid (HCOOH, 85%, extra pure), dimethylformamide (DMF, guaranteed reagent) potassium phos- phate monobasic (KH
2PO
4, 99%), L(+)-ascorbic acid (Special grade, 99.5%), and ammonium molybdate tetrahydrate were purchased from Samchun Chemicals Ltd., South Korea. Potassium antimonyl tartarate sesquihydrate (> 99%) was purchased from Acros Organics, USA.
2.2 Methods
2.2.1. Preparation of MOF-801
The procedure was adopted from Ke et al.[22]. A solution was cre- ated by dissolving 3.2 g of ZrOCl
2ㆍ8H
2O and 1.16 g of fumaric acid in 54 mL DMF-14 mL formic acid solution. Afterwards, the clear sol- ution was put into an autoclave for crystallization at 130 ℃ for 6 h.
After reaction, the obtained product was filtered and washed with wa- ter and ethanol, and then dried overnight at 100 ℃.
2.2.2. Instrumentation
The powder X-ray diffraction (PXRD) patterns for MOF-801 were measured at ambient temperature by a PHILIPS X’pert MPD diffrac- tometer in the 2θ range of 2°~60°, at a scan speed of 0.1 °/s using CuKα1 (λ = 1.54056 Å) radiation. The BET surface area, pore vol- ume, and pore diameter of the MOF-801 were determined in a static volumetric gas adsorption system (Micromeritics Instrument Corporation, USA, model ASAP 2020) using the N
2adsorption-desorption isotherm at 77.4 K up to a relative pressure of 1 bar. The BET equation and the single point adsorption methods were employed for estimating the surface area and the pore volume, respectively. Fourier transform infra- red (FTIR) spectra were collected on a Jasco FTIR-6100 spectrometer at room temperature with 1.0 cm-1 resolution. The phosphate concen- tration was measured by the molybdenum blue method using Orion Aquamate-8000, which is a UV-VIS spectrophotometer (Thermo Fischer Inc., USA).
2.2.3. Phosphate Adsorption measurements
2.2.3.1. Effect of initial phosphate concentration, contact time and adsorbent dose
To determine the effect of initial phosphate concentration on phos- phate removal, 50 mg of MOF-801 sample was taken in to 100 mL phosphate solution. The initial concentrations of the phosphate sol- utions were in the range of 5~80 ppm. The suspensions were placed on a shaker and stirred for 3 h. The suspensions were then filtered, and the residual phosphate concentration was measured.
The effect of contact time on phosphate removal was also examined.
For this study, 50 mg of MOF-801 sample was taken in to 100 mL of three different phosphate solutions with initial concentrations of 5, 20 and 60 ppm. The suspensions were placed on a shaker and stirred for 180 min. The suspensions were taken out from the shaker at speci- fied time intervals and filtered. This filtrate was diluted to 10 times
and the residual phosphate concentration was measured.
The adsorbent dosage on phosphate removal was investigated at three different initial phosphate concentrations of 5, 20 and 60 ppm.
Various doses of MOF-801 sample, ranging between 0.025~0.075 mg, were added to 100 mL phosphate solutions. The suspensions were placed on a shaker and stirred for 3 h. After completion of the experi- ment, the suspensions were filtered and the residual phosphate concen- trations were measured.
2.2.3.2. Phosphate adsorption studies using real wastewater Influent wastewater was collected from the Poseung wastewater treatment plants, located in Pyeongtaek city. Before phosphate adsorp- tion experiments, the wastewater was filtered and autoclaved at 120 ℃ for 3 h. Various doses of MOF-801 sample between 0.025-0.075 mg, were added to a 100 mL sample solution and the rest of experiments were carried out as mentioned in Section 2.2.3.1.
2.2.3.3. Determination of phosphate concentration
The phosphate concentration was measured by the molybdenum blue method using the Orion Aquamate-8000. The percentage of PRE was calculated by the following equation:
PRE (%) =
×
(1)
The phosphate removal capacity (PRC) at equilibrium was calculated by the following equation:
PRC (mg/g) =
× (2)
where
and
are the initial and equilibrium concentrations of phos- phate ion in mg/L, is the volume of the sample solution in L, and
is the dosage of adsorbent in grams.
3. Results and Discussion
3.1. Characterization
Initially, the synthesis of MOF-801 was reported by using zirconium
tetrachloride and fumaric acid as the metal and organic linker pre-
cursors, respectively, with formic acid as the modulator in this syn-
thesis[19]. Later, the MOF-801 was produced using zirconium oxy-
chloride as the metal precursor[22]. It is composed of 12-connected
Zr-based clusters[Zr
6O
4(OH)
4(-COO)
12], joined by fumarate linkers into
a three-dimensional, extended microporous framework of face-centered
cubic topology[19]. The PXRD pattern of MOF-801 sample was exam-
ined (data not shown) and was found to match well with the previous
reports[19,22]. In addition, the N
2sorption isotherms were examined
(data not shown). The isotherms of Type-1 showed that the MOF-801
is a microporous material which matched well with the previous re-
ports[19,22]. The BET surface area and pore volume of the bare
MOF-801 sample were measured to be 478.25 m
2/g and 0.52 cm
3/g,
0 20 40 60 80 0
10 20 30 40 50 60 70 80 90 100
PRE PRC
initial concentration (ppm)
PRE (%)
0 10 20 30 40 50 60 70 80 90
PRE (mg/g)
Figure 1. Effect of initial concentration on PRE (%) and PRC (mg/g).
At adsorbent dosage: 0.05 g, volume: 100 mL, adsorption time: 3 h, adsorption temperature: 25 ℃.
respectively.
3.2. Effect of initial concentration on phosphate removal The effect of changing the initial phosphate concentration (i.e., 5, 10, 20, 40, 60 and 80 ppm) on PRE (%) and PRC were studied while keeping the MOF-801 amount constant and the results are shown in Figure 1. The PRE (%) gradually decreased from 96.37% to 55.75%
as the initial phosphate concentration increased from 5 to 80 ppm. On the other hand, an increase in the removal capacity from 9.6~89.20 (mg/g) was observed with an increase in the initial phosphate concen- tration from 5 to 80 ppm. The decrease in the PRE with increasing ini- tial phosphate concentration can be attributed to the fact that at con- stant adsorbent dosage, the total number of available adsorption sites present in the MOF-801 surface are fixed. This implies that a certain amount of MOF-801 adsorbs almost the same amount of phosphate ions, resulting in a decrease in the PRE (%). However, the adsorption capacity at equilibrium increased with an increase in the initial phos- phate ion concentration. The initial concentration of the phosphate ions provides the necessary driving force to overcome the mass transfer re- sistance and enhances the interaction between the phosphate ions in the aqueous phase and the MOF-801 surface. Therefore, a higher initial concentration of phosphate ions results in an increased rate of adsorption.
Similar results were reported by Das et al.[23]. The experimental data was fitted to the nonlinear Langmuir and Freundlich isotherm models given by the equations (3) and (4), respectively[24]:
=
(3)
=
(4)
where
represents the equilibrium concentration of the phosphate ions,
(mg/g) represents the amount of phosphate adsorbed per unit mass of adsorbent at equilibrium,
(mg/g) is the Langmuir constant
0 5 10 15 20 25 30 35
0 20 40 60 80 100
experimental Langmuir model Freundlich model qe (mg/g)
Ce (ppm)
Figure 2. Experimental and nonlinear curve fittings for the Langmuir and the Freundlich isotherm models.
that represents maximum adsorption capacity by assuming a monolayer coverage of adsorbate over a homogenous adsorbent surface,
is a ki- netic parameter representing the adsorption energy of the adsorbent for the adsorbate phosphate,
(mg/g) is the Freundlich constant related to the adsorption capacity, and
is an empirical parameter related to adsorption intensity or surface heterogeneity. The results are shown in Figure 2.
As shown in Figure 2, the Freundlich model (R
2= 0.9819) was a considerably better fit than the Langmuir model (R
2= 0.8996), which suggests that the adsorption of the phosphate anions occurred on a het- erogeneous surface.
3.3. Effect of contact time on phosphate removal
The PRE (%) was considerably higher for initial phosphate concen- trations in the range of 5~20 ppm (99.9~97.7%). Increasing the initial phosphate concentrations over 60 ppm resulted in the lowering of PRE to below 60%. Hence, three different phosphate concentrations, 10, 20 and 60 ppm were chosen as low, medium and high phosphate concen- trations, respectively, and the effect of contact time on PRE (%) and PRC were studied using them. The effect of contact time on PRE (%) was studied for up to 150 min on the three different initial phosphate concentrations (5, 20 and 60 ppm) and the results are illustrated in Figure 3. In the case of 5 ppm initial phosphate concentration, 100%
PRE was obtained within 30 min. The PRE (%) at 5 and 15 min were further measured for the 5 ppm initial phosphate concentration and were observed to be 94.36% and 98.35%, respectively (these values are not shown in Figure 3 for simplicity). More than 90% of the phosphate ions were removed within 5 min in case of the 5 ppm sample, whereas for 20 and 60 ppm samples, the PRE (%) increased with the contact time and attained equilibrium after 120 min. Furthermore, no sig- nificant change in the rate of adsorption was observed until 150 min.
The PRE (%) at 150 min were calculated as 97.72% and 67.21% for
the 20 and 60 ppm samples, respectively. Beyond 30 min of contact
time, the amount of phosphate adsorbed on the MOF-801 sample in-
cludes diffusion through the fluid layer around the adsorbent particle
30 60 90 120 150 180 0
20 40 60 80 100
5 ppm 20 ppm 60 ppm
PRE (%)
time (min)
Figure 3. Effect of contact time on PRE (%) and PRC (mg/g). At initial phosphate concentrations: 5, 20 and 60 ppm, volume: 100 mL, adsorbent dosage: 0.05 g, adsorption temperature: 25 ℃.
and through the pores to the internal adsorption sites. In the initial stages of adsorption of phosphate, the concentration gradient between the layer and the available pore sites is large, and hence, the rate of adsorption is high. The rate of adsorption decreased in the later stages of the adsorption probably owing to reduced pore diffusion of the sol- ute ion into the bulk of the adsorbent[25], and it plateaued at about 120 min.
Estimation of adsorption kinetics provides information about the sorption rates and the sorption mechanism. The experimental adsorp- tion kinetics data was fitted to the nonlinear pseudo-first-order and pseudo-second-order kinetic models according to equations (5) and (6), respectively[26]:
=
(5)
=
(6)
where
(mg/g) and
(mg/g) are the amount of phosphate ions ad- sorbed per unit mass of the adsorbent at equilibrium and at any time
(min), respectively;
(per min) is the rate constant of the pseu- do-first-order kinetic model and
(g/mg per min) is the rate constant for the pseudo-second-order kinetic model. The kinetic model fittings for the 60 ppm sample are shown in Figure 4.
The experimental data corresponded well to the pseudo-second-order kinetic model (R
2= 0.9941) compared to the pseudo-first-order kinetic model (R
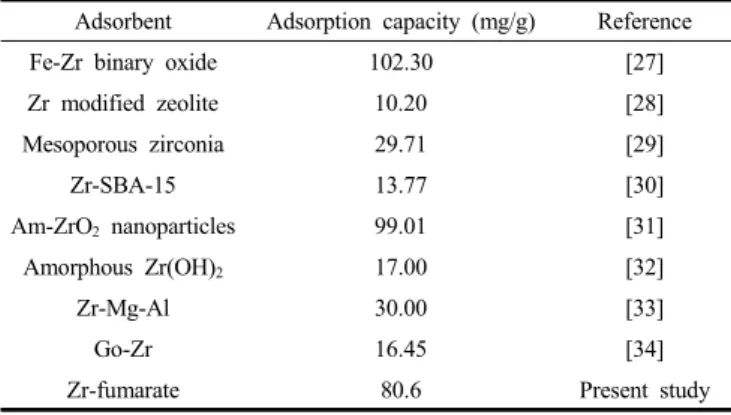
2= 0.9216). The calculated removal capacity at 150 min was 80.60 mg/g which is close to the experimental removal capacity (80.65 mg/g). The phosphate adsorption capacities of various adsorbents are given in Table 1. Zr-fumarate shows a higher phosphate adsorption ca- pacity compared to the modified zeolites, silica, and graphene oxide but a lower adsorption capacity than the Fe-Zr binary oxide and the amor- phous zirconium nano particles[27-34]. According to the kinetic model, the rate-limiting step here involves surface adsorption, a chemisorption
Adsorbent Adsorption capacity (mg/g) Reference
Fe-Zr binary oxide 102.30 [27]
Zr modified zeolite 10.20 [28]
Mesoporous zirconia 29.71 [29]
Zr-SBA-15 13.77 [30]
Am-ZrO2 nanoparticles 99.01 [31]
Amorphous Zr(OH)2 17.00 [32]
Zr-Mg-Al 30.00 [33]
Go-Zr 16.45 [34]
Zr-fumarate 80.6 Present study
Table 1. Phosphate Adsorption Capacities of Various Adsorbents
20 40 60 80 100 120 140 160
50 60 70 80 90
experimental PSO PFO
qt (mg/g)
t (min) 60 ppm
Figure 4. Experimental and nonlinear curve fittings for the pseudo- first-order and pseudo-second-order kinetic models.
process[28]. MOF-801 possesses plenty of hydroxyl groups that are present in the nodes of Zr (IV). These zirconium-bound hydroxyl groups in the nodes of the framework are expected to facilitate the ad- sorption of phosphate via the anion exchange property. Fluoride re- moval using MOF-801 via the exchange of zirconium-bound hydroxyl groups has been verified[22], and the experimental results in this study further confirmed that the phosphate removal on MOF-801 sample also follows chemisorption via the ligand exchange mechanism. The BET surface area and the pore volume of the MOF-801 sample were meas- ured after phosphate adsorption (at an initial phosphate concentration of 60 ppm, after 3 h, without washing the sample) and they were ob- served to be 331.66 m
2/g and 0.39 cm
3/g, respectively. Hence, a 30.65%
reduction was observed in the BET surface area after phosphate adsorption.
3.4. Effect of Adsorbent dosage on phosphate removal
Figure 5 illustrates the effect of adsorbent dosage on PRE (%) at three different initial phosphate concentrations: 5, 20 and 60 ppm.
100% PRE was observed in the case of the 5 ppm solution. In con-
trast, a constant increase of the PRE (%) was observed in the case of
the 60 ppm solution. The PRE obtained by a 0.075 mg adsorbent dose
for the 5, 20 and 60 ppm initial phosphate concentration samples were
0.025 0.050 0.075 0
20 40 60 80
100 5 ppm 20 ppm
60 ppm
PRE (%)
adsorbent dose (g)
Figure 5. Effect of MOF-801 dosage on the PRE (%). At initial pho- sphate concentrations: 5, 20 and 60 ppm, volume: 100 mL, adsorption time: 3 h, adsorption temperature: 25 ℃.
0.025 0.050 0.075
0 20 40 60 80
100 5 ppm 20 ppm
60 ppm
PRC (mg/g)
adsorbent dose (g)
Figure 6. Effect of MOF-801 dosage on PRC (mg/g). At initial pho- sphate concentrations: 5, 20 and 60 ppm, volume: 100 mL, adsorption time: 3 h, adsorption temperature: 25 ℃.
100, 99.90, and 88.81%, respectively. Figure 6 illustrates the effect of adsorbent dosage on PRC (mg/g) at the three different initial phosphate concentration solutions: 5, 20 and 60 ppm. PRC decreased with an in- crease in the adsorbent dosage. This indicates that MOF-801 was not completely utilized under high dosage conditions. It is likely that dur- ing phosphate adsorption process, the hydroxyl groups bound to MOF-801 surface (Zr-OH) were discharged and they accumulated in the vicinity of the MOF-801 surface, repelling the other phosphate anions and decreasing the phosphate removal capacity. Similar results were reported by Dexin et al.[35].
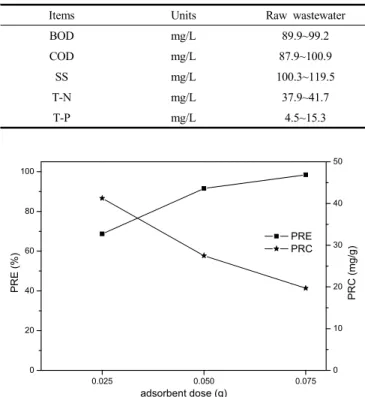
3.5. Experimental results using wastewater samples
The initial phosphate ion concentration in the Poseung wastewater treatment plant of Pyeongtaek city was measured to be 15.01 ppm and the composition of raw wastewater was presented in Table 2. The phosphate adsorption experiments were conducted at three different ad- sorbent doses, 25, 50 and 75 mg, using 100 mL of wastewater samples.
Items Units Raw wastewater
BOD mg/L 89.9~99.2
COD mg/L 87.9~100.9
SS mg/L 100.3~119.5
T-N mg/L 37.9~41.7
T-P mg/L 4.5~15.3
Table 2. Variations of Water Quality of Influent Wastewater in Poseung Wastewater Treatment Plant
0.025 0.050 0.075
0 20 40 60 80 100
PRE PRC
adsorbent dose (g)
PRE (%)
0 10 20 30 40 50
PRC (mg/g)