• 검색 결과가 없습니다.

Printing Morphology and Rheological Characteristics of Lead-Free Sn-3Ag-0.5Cu (SAC) Solder Pastes

N/A
N/A
Protected

Academic year: 2021

Share "Printing Morphology and Rheological Characteristics of Lead-Free Sn-3Ag-0.5Cu (SAC) Solder Pastes"

Copied!
7
0
0

로드 중.... (전체 텍스트 보기)

전체 글

(1)

Printing Morphology and Rheological Characteristics of Lead-Free Sn-3Ag-0.5Cu (SAC) Solder Pastes

Ashutosh Sharma

1

, Sabuj Mallik

2

, Nduka N. Ekere

3

and Jae-Pil Jung

1,†

1

University of Seoul, Department of Materials Science and Engineering, Seoul 130-743, Korea

2

University of Greenwich, Faculty of Engineering and Science, Chatham, Kent, ME4 4TB, UK

3

University of Wolverhampton, Dept. of Manufacturing Engineering, Wolverhampton WV1 1SB, UK (Received December 8, 2014: Corrected December 22, 2014: Accepted December 26, 2014)

Abstract: Solder paste plays a crucial role as the widely used joining material in surface mount technology (SMT).

The understanding of its behaviour and properties is essential to ensure the proper functioning of the electronic assemblies.

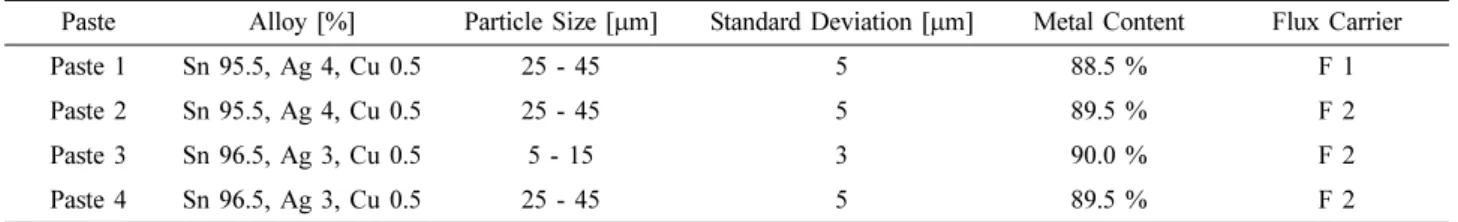
The composition of the solder paste is known to be directly related to its rheological behaviour. This paper provides a brief overview of the solder paste behaviour of four different solder paste formulations, stencil printing processes, and techniques to characterize solder paste behaviour adequately. The solder pastes are based on the Sn-3.0Ag-0.5Cu alloy, are different in their particle size, metal content and flux system. The solder pastes are characterized in terms of solder particle size and shape as well as the rheological characterizations such as oscillatory sweep tests, viscosity, and creep recovery behaviour of pastes.

Keywords: solder paste, flip chip packaging, rheology, stencil printing, viscosity.

1. Introduction

The solder pastes in electronic assemblies provide the mechanical strength to the solder joints as well as electrical continuity among various interconnections.

1)

In the past, SMT has been the choice for surface mounting of compo- nents on printed circuit boards (PCB), as it facilitates a higher number of components per unit area at lower costs in PCBs manufacturing.

2, 3)

A lot of modern products are based on SMT technology. The fundamental definition of a superior soldering performance is the ability of a metal substrate to be evenly wetted with an adherent solder finish layer. Optimum soldering performance occurs as a result of better design practice, specified materials and manufacturing process controls.

4, 5)

An important step in the microelectronic assembly processing is the selection of solder pastes. Solder pastes usually consist of the spherical solder alloy particles which are randomly suspended in a flux medium/carrier.

The selection of solder pastes for wafer bumping requires a good understanding of the solder paste properties. For example, the flow and deformation characteristics, known as rheological behaviours, of solder pastes are directly related to their printing quality as well as the post printing

behaviour.

In flip chip packaging, stencil printing of the fine particle solder pastes is an economical solution with a high output for fine pitch solder joint interconnects. The manufacturing challenges associated with solder paste printing increases with the device miniaturization in electronic packaging.

6, 7)

The choice of solder pastes depends upon several factors including the width and pitch of PCB, its physical/chemical properties, and the rheological property of the solder paste.

The rheological measurements can be used to simulate the printing behaviours and help to find the right solders paste for each process. Rheology is basically concerned with the deformation of the material under the influence of stresses.

However, the quantification of the rheological properties of solder pastes is still challenging.

8, 9)

It is now believed that correlation of the rheological properties of a solder paste to its printing quality is even a bigger challenge. Therefore, a proper understanding of the non-Newtonian flow behaviour of solder pastes is necessary to study the solder paste per- formance. Furthermore, rheology can be used as a tool to develop and understand the formulation of solder pastes.

The current industrial approach is to reduce the particle size and/or metal content in order to increase the paste flowabil-

Corresponding author E-mail: [email protected]

© 2014, The Korean Microelectronics and Packaging Society

This is an Open-Access article distributed under the terms of the Creative Commons Attribution Non-Commercial License(http://creativecommons.org/

licenses/by-nc/3.0) which permits unrestricted non-commercial use, distribution, and reproduction in any medium, provided the original work is

properly cited.

(2)

ity through the tiny stencil apertures. A smaller particle size is supposed to increase the flowability in comparison to big- ger particle sizes. However, a variation in particle size and/

or metal may change the rheology characteristics and affect the printing behaviour.

Therefore, this work is intended to study the printing of the four different types of solder pastes, differing in their particle shape and size, and flux carrier systems on Si Wafer at an ultra-fine pitch. The goal is to fabricate 50~70 μm diameter bump on Si wafer by screen printing. In this work, we also present the solder paste properties such as rheological properties, i.e., oscillation tests, viscosity, and creep recovery behaviour for wafer bumping.

2. Experimental Details

2.1. Material and methods

In this study four different samples of solder pastes are used. The detail of the four pastes is given in Table 1.

All the solder paste samples were stored in a refrigerator at a temperature between 2-4

o

C to avoid the degradation.

Prior to the experiment, the solder pastes were taken out of the refrigerator and left to attain the room temperature. Then the solder pastes were hand mixed with a spatula for about two minutes, and loaded onto the rheometer. The flux carrier is usually a mixture of chemicals that prevents flux from boiling at a sufficiently high temperature and also prevents mopping up of reaction products. The flux carrier composition is usually protected and is not disclosed by the manufacturer.

2.2. Stencil printing

The printing of the lead free solder pastes was accom- plished by using stencil printing (DEK-260 semi-automatic stencil printer with using rubber squeegee blades). The solder bumps were fabricated on Si wafers. The printing parameters are shown in Table 1.

The printing test was carried out on Si wafers. The various sub-process used in solder paste printing is shown in Fig. 1.

The printing results were visually observed using a scan- ning electron microscope (SEM, Hitachi-4300S). The solder ball height and diameter were measured after the printing

process, on Si wafers through 30 μm apertures at ultra-fine pitch.

2.3. Solder pastes behaviour 2.3.1 Oscillation test

The Oscillation test is typically used in rheology to study the visco-elastic behaviour of complex materials. In this test a sinusoidal stress (σ) is applied to the material. The measured strain ( ρ) has a sinusoidal form as well. The applied stress and the resultant strain can be

10, 11)

,

σ = σ

0

sin(ωt) (1)

γ = γ

0

sin(ωt + δ) (2)

Where, δ is the phase shift.

The ratio of applied shear stress and maximum strain is called complex modulus G* and is a measure of material’s resistance to deformation.

(3)

(4) The real and imaginary parts of the complex modulus are G

*

σ

0

γ

0

---

=

G* = G' iG'' + Table 1. Details of the solder pastes samples

Paste Alloy [%] Particle Size [μm] Standard Deviation [μm] Metal Content Flux Carrier

Paste 1 Sn 95.5, Ag 4, Cu 0.5 25 - 45 5 88.5 % F 1

Paste 2 Sn 95.5, Ag 4, Cu 0.5 25 - 45 5 89.5 % F 2

Paste 3 Sn 96.5, Ag 3, Cu 0.5 5 - 15 3 90.0 % F 2

Paste 4 Sn 96.5, Ag 3, Cu 0.5 25 - 45 5 89.5 % F 2

Table 2. Printing parameters

Printing Parameters Values Used Printing/Squeegee Speed 30 mm/sec Squeegee Loading (or pressure) 6 kg

Separation Speed 100 % (3 mm/sec) Snap-off/Print-Gap 0.0 mm (On-contact printing)

Fig. 1. Various sub-processes used in solder paste printing.

(3)

related as shown in the figure 2.

The elastic component is called storage modulus G’ and is defined as

(5)

G’ represents the stored energy in the material structure that can be recovered (storage modulus). The loss modulus G” shows the viscous component which represents the lost energy and disappears in the form of heat or internal friction.

G” is defined as

(6)

A well-structured and predominantly elastic sample exhibits a large G’, whilst a large G” values are exhibited by an in-elastic sample. The ratio of G’/G”, gives an indication of the elastic nature of a given material, for assessing the tackiness of a solder paste and flux medium. The oscillation test for all samples was performed for stress ranging from 0.5 to 500 Pa with a constant frequency of 1 Hz.

2.3.2 Viscosity test

The viscosity test is related to the evaluation of shear rate and shear stress relationship. The shear thinning behaviour of solder pastes is essential in aperture filling step in the printing process. A range of shear rate/stress was applied in either a continuous or stepped manner and the viscosity data were obtained. The viscosity as a function of shear rate change was studied. The range of the shear rates applied in this study was (a) 0.0005 to 0.05 sec

-1

, and (b) 0.05 to 10 sec

-1

.

2.3.3. Yield stress

The value of the shear stress at which the structure deforms and the flow occurs is called yield stress. In this study, the effect of temperature on the yield stress of solder paste has been investigated. This is important to understand for production outside of clean room conditions. In this test,

a range of temperatures from 15 to 35

o

C was applied to the solder pastes with an increment of 5

o

C.

2.3.4. Creep recovery test

The creep and recovery behaviours were investigated to understand low shear stress phenomena of pastes like slumping. In this test a constant shear stress ( σ) was applied over a period of time. Afterwards the shear stress was removed and the induced strain ( γ) in the sample was recorded. The result of test was obtained as the compliance (J

Creep

and J

Recovery

) of the material which is given by the equation below:

(7)

In this study a shear stress of 3.5 Pa over a period of 150 seconds is applied. This applied strain in the linear visco- elastic region (LVR) results in no internal structural breakdown. The recording time after the shear stress removed is 300 seconds. In a second test a shear stress of 50 Pa was applied which is over the LVR to simulate the structural breakdown.

3. Results and Discussion

3.1. Stencil printing - Solder bump and height measure- ments

The visual observation of the printing results on Si-wafer is given in figure 3. There was no appreciable change in the G' σ

0

γ

0

--- cos ( ) δ

=

G'' σ

0

γ

0

--- sin ( ) δ

=

J γ strain ( ) σ stress ( ) ---

= Fig. 2. Complex Modulus G*

Fig. 3. (a) Typical view of solder paste deposits with measurements

(top view), (b) a single solder paste deposit (top view), (c)

solder paste deposit with measurement, and (d) solder par-

ticles in the solder paste deposit. The paste diameter has

been measured at different locations due to the oval shape

of solder pastes and averaged out.

(4)

visual observation for all the solder paste types. The meas- urements were conducted for the paste diameters and heights. The results showed that the printed deposit diame- ters were higher than the target diameter for all the solder pastes. This behaviour could be related to the slumping nature of the solder pastes used.

12, 13)

We have obtained the printing results for only one solder paste, i.e., Paste 3. The microstructure images of Paste 1~4 are more or less similar due to a range of particle sizes. The corresponding paste height and paste diameters at different locations are given in the following Table 3.

All the solder pastes showed consistent print paste deposits across the boards. There were no sign of bridging and skipping among the solder pastes structures. The minimum gap for avoiding the bridging or skipping is suggested to be 160 μm.

3.2. Oscillation test results

The oscillatory sweep tests results of the four types of solder pastes were evaluated and compared as shown in figure 4.

The various regions were analyzed from the sweep test diagrams (Fig. 4), and tabulated. The LVR are chosen up to the nearly constant value of G’ and G”. LVR indicates a

region in the oscillatory sweep test curve where shear stress can be applied without destroying the structure.

11, 14)

Table 4 shows the linear visco-elastic region (LVR). In this region the amplitude of G’ and G” is nearly constant. Below this region the structure will be destroyed and the samples deform to viscous fluid.

It can be seen from the Table 4 that, Paste 1 has the largest LVR range among all solder pastes with a shear stress of ~ 10.1 Pa. This indicates a highest structural resistance against applied force in case of Paste 1. This can be attributed to the different flux system and the low metal content of 88.5 % (refer to Table 1). Similarly, the LVR range of ~ 7.1 Pa was shown for Paste 2 and 4. This indicates that an increase in silver content around (1%) has no effect on LVR range. However, The Paste 3 shows the lowest linear LVR range. This paste starts to deform and flows after a shear stress of about 5 Pa is applied. This difference was expected and correlated with the smallest particle size of all samples (~5 - 15 μm).

The effect of applied shear stress on G’ (storage modulus), G” (loss modulus), ratio of G’/G”, crossover stress at G’ = G”

and phase angle are given in Table 5.

The ratio of G’/G” gives a notice of the strength of interaction within the internal structure. The G’/G” value for Table 3. Solder paste print results

Location location 1 location 2 location 3 location 4 Paste Height

(μm) 10.47±1.2 8.99±0.5 5.68±0.3 6.33±0.4 Paste Diameter

( μm) 53±0.5 55±0.8 48±0.4 41±0.3

Fig. 4. Oscillatory stress sweep test for different solder pastes.

Table 4. Linaer visco-elastic region

Paste Linear Visco-elastic Region Range (Pa)

Paste 1 Up to 10.1

Paste 2 Up to 7.1

Paste 3 Up to 5

Paste 4 Up to7.1

(5)

Paste 2 is the highest (2.4), follow by Paste 4 (G’/G”=2.2) and Paste 1 (G’/G”=1.9). Paste 3 (G’/G”=1.6) indicate lowest solid like behaviour. The elastic to the viscous behaviour (i.e., the cohesiveness of the paste) change was noticed at crossover stress G’ = G”. A low phase angle, this indicates the paste could be tacky, while a high angle phase indicates a higher tendency towards the slumping.

15)

3.3. Viscosity test results

The viscosities of four different solder pastes at different shear rate range are shown in Fig. 5(a-b). All the solder pastes showed a similar trend, the viscosity increased up to a maximum value and then decreased. After the maximum point all solder pastes displayed the shear thinning behaviour. The reason for this behaviour could be related to the static inertial effect of solder paste structure. When the shear rate was applied to the solder pastes, paste structure got reorganized leading to an initial increase of the viscosity, followed by shear thinning behaviour after a critical value. The maximum values of the viscosity are tabulated in Table 6.

Case 1: Shear rate ~ 0.0005 - 0.05 sec

-1

Paste 3 showed the lowest rate of increase in this range.

This can be confirmed from the higher shear rate of 1.885×10

-3

sec

-1

, over the other solder pastes (Table 6). It can be attributed due to the fact that Paste 3 has the smallest particle size of all investigated samples. Paste 4 showed the

highest maximum viscosity of 104.1 kPa followed by Paste 1 with a value of 100.5 kPa. The lowest viscosity was shown by Paste 2 with 83.9 kPa.

Case 2: Shear rate ~ 0.05 to 10 sec

-1

The viscosity of all solder pastes was found to increase in the shear rate range of 0.05 to 0.054 sec

-1

. After that all solder pastes have shown shear thinning behaviour. When the applied shear rate exceeds over 1 sec

-1

, the viscosity is nearly constant and independent of increasing shear rate. It has been reported that a higher metal content will increase the viscosity of solder pastes.

12, 14)

This correlation could be confirmed to higher shear rate value for Paste 4 and Paste 3. For example, Paste 3 has a metal content of 90.0 %, and showed a higher viscosity than Paste 4 with a metal content of 89.5 %.

3.4. Yield stress test results

Figure 6 shows the effect of the temperature on the yield point of the different solder pastes. It is observed that increasing temperature leads to a decrease in yield point.

This can be attributed to the fact that the flux system became more liquidus with increased temperature. Paste 3 has shown the highest rate of decrease in yield stress with temperature, while Paste 4 has shown minimum dependence on temperature with respect to yield stress value.

3.5. Creep recovery test results Case 1: Shear stress: 3.5 Pa

The results of creep compliance J

C

and recovery compliance J

R

for all four pastes are shown in figure 7 (a-c).

The recovery behaviour can be compared by using the ratio of (J

C

/J

R

)/J

C

in percent is also shown (Fig. 7b-c). It was Table 5. Summary of oscillatory stress sweep parameter

Paste G’ [Pa] G” [Pa] G’/G” G’ = G” [Pa] Min δ [

o

] Max δ [

o

]

Paste 1 13263 7134 1.9 410 21.2 58.9

Paste 2 6269 2611 2.4 315 18.2 64.2

Paste 3 1596 990 1.6 360 27.4 53.1

Paste 4 6134 2755 2.2 380 21.1 59

Table 6. Maximum viscosity at the corresponding shear rate Paste 1 Paste 2 Paste 3 Paste 4

Viscosity [kPa] 100.5 83.9 97.6 104.1

Shear rate [sec

-1

] 1.273 ×10

-3

1.186 ×10

-3

1.885 ×10

-3

1.237 ×10

-3

Fig. 5. Viscosity as function of shear rate range of: (a) 0.0005 - 0.05 sec

-1

, and (b) 0.05 to 10 sec

-1

.

(6)

observed that highest relative recovery compliance (~62.3

%) was shown by Paste 4. In addition to that it shows the lowest value of J

C

(1.5 ×10

-3

Pa

-1

) and J

R

(5.5 ×10

-4

Pa

-1

).

Paste 3 exhibits the lowest recovery ratio of 26.1 % but the highest values of creep and recovery compliance with J

C

of 7.3×10

-3

Pa

-1

and J

R

of 5.4×10

-3

Pa

-1

. The reason the different creep recovery behaviour can be ascribed to the particle size. The smaller particle size of solder Paste 3 leads to a higher value of J

C

and J

R

and worse recovery behaviour.

In previous reports, it is reported that the solder pastes with high percentages of recovery and lower compliance are beneficial in terms of minimizing print defects.

16)

Therefore, it can be concluded that Paste 4 will show the best printing behaviour among the four solder pastes, because of it’s higher recovery percentage and lower compliance values. The comparison between Paste 2 and Paste 4 shows the effect of

different solder alloys in creep recovery behaviours. The increase of 1 % more silver in this solder paste resulted in a lower recovery ratio of 40.0 %. On the other hand the values of creep and recovery compliance were increased with J

C

of 2.1 ×10

-3

Pa

-1

and J

R

of 1.3 ×10

-3

Pa

-1

.

Case 2: Shear stress: 50 Pa

This section concerns with the creep recovery behaviour when a shear stress above the LVR region is applied, as shown in Fig. 7c. In general the value of creep compliance J

C

and recovery compliance J

R

were higher and therefore achieved different recovery ratio with a shear rate of 3.5 Pa. Paste 4 exhibits lowest value of creep compliance with J

C

of 2.6×10

-3

Pa

-1

and recovery compliance with J

R

of 1.4×10

-3

Pa

-1

. The recovery ratio was found to be 44.4 percent. In this case too, Paste 4 indicated the lowest proneness to bleeding.

4. Conclusions

This work presents the results from a series of stencil printing and rheological tests including yield stress, oscillation, viscosity and creep recovery characteristics of four different lead free solder pastes. The following conclusions can be drawn from this study:

1. The printing results showed that the printed deposit diameters were higher than the target diameter. This behav- iour could be related to the slumping nature of the solder paste used. The print deposits were consistent across the board with no sign of bridging and skipping.

Fig. 6. Yield stress as a function of temperature for different solder pastes.

Fig. 7. (a) Creep recovery with shear stress of 3.5 Pa, (b) Creep and recovery with shear stress of 3.5 Pa (%), and (c) Creep and recovery

with a shear stress of 50 Pa (%).

(7)

2. Paste 1 indicated the biggest linear visco-elastic region (LVR) and the highest value of G’ and G” which means Paste 1 will be needed a higher squeegee pressure in the printing process.

3. In the viscosity test all solder pastes shown a shear thinning behaviour in nature. Paste 4 exhibited the highest maximum viscosity. In the region of shear thinning behavior, paste 3 delivered the best results.

4. The yield stress results indicated a decreasing of the yield stress point if the temperature was increased. Paste 4 showed a minimum dependence of yield stress on temperature.

5. In the creep recovery test, Paste 4 showed the best recovery and the lowest values of creep and recovery compliance which indicated a good printing behaviour. It was also shown that the solder paste with smaller particle size (Paste 3) exhibited less recovery.

Acknowledgement

This study was supported by Seoul R& BD program and by Business for Cooperative R&D between Industry, Academy and Research Institute funded Korea Small and Medium business Administration (Grants No. C0213709).

References

1. R. P. Anjard Sr., “Solder Pastes for Microelectronics”, Micro- electr. J., 15(2), 53 (1984).

2. R. J. Rowland, “Surface Mount Manufacturing Technology Quality and Automation”, Microelectr. J., 17(3), 22 (1986).

3. J. Mahon, N. Harris and D. Vernon, “Automated Visual Inspection of Solder Paste Deposition on Surface Mount Technology PCBs”, Comput. Ind., 12, 31 (1989).

4. W.-S. Seo, B.-W. Min, J.-H Kim, N.-K Lee and J.-B. Kim,

“An Analysis of Screen Printing using Solder Paste”, J.

Microelectron. Packag. Soc., 17 (1), 47 (2010).

5. S.-H. Kwon, J.-H. Kim, C.-W Lee and S. Yoo, “Evaluation of Solder Printing Efficiency with the Variation of Stencil Aperture Size”, J. Microelectron. Packag. Soc., 18 (4), 71

(2011).

6. J. Pan , G. L. Tonkay, R. H. Storer, R. M. Sallade and D. J.

Leandri, “Critical Variables of Solder Paste Stencil Printing for Micro-BGA and Fine-Pitch QFP” IEEE Trans. Electron.

Packag. Manuf., 27(2), 125 (2004).

7. J. Kloeser, K. Heinricht, E. Jung, L. Lauter, A. Ostmann, R.

Aschenbrenner and H. Reichl, “Low cost bumping by stencil printing: process quali®cation for 200 lm pitch” Micron.

Reliab., 40, 497 (2000).

8. R. Durairaj, A. Seman and N. N. Ekere, “Development of Quality Control (QC) Tools for Solder Pastes used for Flip Chip Assembly based on Oscillatory Tests, Proc. Electronics Systemintegration Technology Conference, Dresden, Ger- many, 1, 347, IEEE (2006).

9. T. A. Nguty, M. H. A. Riedlin, N. N. Ekere, “Evaluation of Process Parameters for Flip Chip Stencil Printing”, Proc. Int.

Electronics Manufacturing Technology Symposium, Austin TX, 206 IEEE (1998).

10. E. H. Amalu, N. N. Ekere and S. Mallik, “Evaluation of rheo- logical properties of lead-free solder pastes and their relation- ship with transfer efficiency during stencil printing process”, Mater. Des., 32, 3189 (2011).

11. R. Durairaj, T. A. Nguty and N. N. Ekere, “Critical factors affecting paste flow during the stencil printing of solder paste”, Solder. Surf. Mount. Technol., 30, 1 (2001).

12. R. Durairaj, S. Ramesh, S. Mallik, A. Seman and N. N. Ekere,

“Rheological characterisation and printing performance of Sn/

Ag/Cu solder pastes”, Mater. Des., 30 3812 (2009).

13. J. W. Evans and J. K. Beddow, “Characterisation of particle morphology and rheological behaviour in solder pastes”, IEEE Trans. Compon. Hybrids Manuf. Technol., 10, 224 (1987).

14. R. Durairaj, S. Mallik, A. Seman, A. Marks and N. N. Ekere,

“Rheological characterisation of solder pastes and isotropic conductive adhesives used for flip-chip assembly”, J. Mater.

Proc. Technol., 209, 3923 (2009).

15. G. J. Jackson, M. W. Hendriksen, R. W. Kay, M. Desmulliez, R. K. Durairaj and N. N. Ekere, “Sub process challenges in ultra fine pitch stencil printing of type-6 and type-7 Pb-free solder pastes for flip chip assembly applications”, J. Solder.

Surf. Mount Technol., 17, 24 (2005).

16. X. Bao, N. C. Lee, R. B. Raj, K. P. Rangen and A. Maria,

“Engineering solder paste performance through controlled

stress rheology analysis”, J. Solder. Surf. Mount Technol., 10

(2) 26 (1998).

수치

Table 2. Printing parameters
Fig. 3. (a) Typical view of solder paste deposits with measurements (top view), (b) a single solder paste deposit (top view), (c) solder paste deposit with measurement, and (d) solder  par-ticles in the solder paste deposit
Fig. 4. Oscillatory stress sweep test for different solder pastes.
Figure 6 shows the effect of the temperature on the yield point of the different solder pastes
+2

참조

관련 문서