Sentinel-1A/B SAR 센서 기반 고해상도 토양수분 산정
Estimation of High-Resolution Soil Moisture based on Sentinel-1A/B SAR Sensors
김상우
a⋅이태화
b⋅신용철
c,✝Kim Sangwoo⋅Lee Taehwa⋅Shin Yongchul
ABSTRACT
In this study, we estimated the spatially-distributed soil moisture at the high resolution (10 m×10 m) using the satellite-based Sentinel-1A/B SAR (Synthetic Aperture Radar) sensor images. The Sentinel-1A/B raw data were pre-processed using the SNAP (Sentinel Application Platform) tool provided from ESA (European Space Agency), and then the pre-processed data were converted to the backscatter coefficients. The regression equations were derived based on the relationships between the TDR (Time Domain Reflectometry)-based soil moisture measurements and the converted backscatter coefficients. The TDR measurements from the 51 RDA (Rural Development Administration) monitoring sites were used to derive the regression equations. Then, the soil moisture values were estimated using the derived regression equations with the input data of Sentinel-1A/B based backscatter coefficients. Overall, the soil moisture estimates showed the linear trends compared to the TDR measurements with the high Pearson’s correlations (more than 0.7). The Sentinel-1A/B based soil moisture values matched well with the TDR measurements with various land surface conditions (bare soil, crop, forest, and urban), especially for bare soil (R: 0.885∼0.910 and RMSE: 3.162∼4.609). However, the Mandae-ri (forest) and Taean-eup (urban) sites showed the negative correlations with the TDR measurements. These uncertainties might be due to limitations of soil surface penetration depths of SAR sensors and complicated land surface conditions (artificial constructions near the TDR site) at urban regions. These results may infer that qualities of Sentinel-1A/B based soil moisture products are dependent on land surface conditions. Although uncertainties exist, the Sentinel-1A/B based high-resolution soil moisture products could be useful in various areas (hydrology, agriculture, drought, flood, wild fire, etc.).
Keywords: Satellite; sentinel-1A/B; soil moisture; SAR; TDR
Ⅰ. 서 론
최근 기후변화로 인한 가뭄, 홍수 및 산불발생의 빈도 및 규모가 지속적으로 증가하고 있으며, 이와 같은 물 관련 재해 에 대응하기 위해서 시⋅공간적으로 변하는 토양수분 관측이 필요하다. 토양수분은 수문 분석에 있어서 매우 중요한 인자 중 하나이다. 수자원 관리, 농업 생산성 예측, 작물 성장, 가뭄, 홍수 등에 직접적으로 영향을 미치며, 또한 날씨예측, 기후 변화 예측, 수자원 관리 등에도 간접적으로 사용되고 있다.
토양수분 측정 방법은 직접방법과 간접방법으로 구분된다.
직접방법으로는 TDR (Time Domain Reflectometry) 장비를 이
용하는 방법으로 현장에서 매우 빠른 시간 내 정확한 측정이 가능한 장점이 있지만, 공간적인 분포를 나타내지 못하는 단 점이 있다. 이러한 단점을 극복하기 위해 항공기 및 인공위성 을 이용한 간접적 방법이 제시되었다. 인공위성은 광학위성 과 레이더위성으로 나누어지며 광학위성은 수동형 센서로서 자연적으로 지면으로부터 방출되는 가시파장 및 열 적외선 파장을 감지하며 태양이 지구를 조명하는 시간 동안에만 존 재하는 반면에 레이더 위성 중 하나인 SAR (synthetic aperture radar) 위성영상은 지표면에 마이크로파를 송신하여 반사 및 산란되어 오는 마이크로파를 수신하여 후방산란계수 (backscatter coefficient)를 얻는다 (Sabins, 2007). 마이크로파는 구름, 눈, 연기, 안개 등을 투과하는 성질을 가지고 있어 광학위성영상 에 비해 날씨에 영향을 받지 않으며, 위상 데이터 (phase data) 및 진폭 데이터 (amplitude data)로 구성되어 있어 대상물체의 물리적인 특성을 추출 할 수 있는 장점이 있다 (Jang, 2018).
ESA (European Space Agency)에서 제공하는 Sentinel-1A/B는 SAR 센서를 탑재한 능동형 위성 중 하나로서 10 m×10 m의 공간해상도로 제공되기 때문에 기존의 토양수분 전용위성인 SMOS (Soil Moisture and Ocean Salinity, Kerr et al., 2001), SMAP (Soil Moisture Active Passive, Entekhabi et al., 2010)
a MS Student, Department of Agricultural Civil Engineering, Kyoungpook National University
b PhD Student, Department of Agricultural Civil Engineering, Kyoungpook National University
c Professor, Department of Agricultural Civil Engineering, Kyoungpook National University
† Corresponding author
Tel.: +82-53-950-5734 Fax: +82-53-950-6752 E-mail: [email protected]
Received: May 21, 2019 Revised: August 30, 2019 Accepted: September 2, 2019
및 GCOM-W1 (Global Change Observation Mission Water, Imaoka et al., 2010) 등 기존의 위성 산출물과 다르게 고해상 도 토양수분 관측이 가능한 장점이 있다. 그러나 현재 Sentinel-1A/B SAR 센서는 고해상도 지표 관측 이미지 자료 만 제공하며, 직접적으로 토양수분 자료를 제공하지 않는다.
SAR 센서에서 관측하는 후방산란계수는 지표면으로부터 수신된 마이크로파의 신호의 크기, 즉 수신된 후방산란의 단 위면적당 신호의 크기를 나타낸다. 이러한 후방산란계수는 지표면의 수분함량이 클수록 높게 나타나는 특성을 가지고 있으며, 후방산란계수의 특성을 이용하여 작물생육, 농업 생 산량과의 상관성 및 토양수분 산출 등 많은 연구들이 수행되 고 있다. Paloscia et al. (2013)은 후방산란계수와 토양수분과 의 관계를 이용하여 인공신경망 (Artificial Neural Network-ANN) 을 이용한 토양수분 산출 알고리즘을 제시하였고, Hornacek (2012)는 TU Wien 모델 (Wagner et al., 1999)을 이용하여 건조 토양에서의 후방산란 변화량을 이용하여 토양수분을 산정하 였으며, Gao et al. (2017)은 후방산란과 정규식생지수 (NDVI) 와의 선형적 관계를 이용하여 토양수분을 산정하였다. Lee et al. (2017)은 Sentinel-1 SAR의 후방산란과 토양수분과의 관계 를 이용하여 우리나라의 농업지역을 대상으로 토양수분을 산
출하였으며, Jang (2018)은 Sentinel-1A/B SAR 자료를 활용하 여 한반도 주변 해상풍을 산출하였다. 그러나 현재까지 Sentinel-1A/B 기반 우리나라의 고해상도 (10 m×10 m) 토양수 분 공간분포 산정에 관한 연구는 미비한 실정이다. 따라서 본 연구에서는 Sentinel-1A/B SAR 센서를 활용하여 우리나라의 후방산란계수를 산정하였으며, 후방산란계수와 농촌진흥청 에서 제공하는 51개지점의 TDR 토양수분 실측값과의 관계를 이용하여 회귀모형을 도출 및 우리나라의 토양수분 공간분포 를 산정하였다. 연구 목적은 1) Sentinel-1A/B SAR 센서를 활 용한 후방산란계수 산정, 2) 산정된 후방산란계수와 TDR 토 양수분 실측값과의 회귀분석 도출 및 3) 도출된 회귀식을 이 용하여 우리나라의 토양수분 공간분포를 산정하였다.
Ⅱ. 재료 및 연구방법
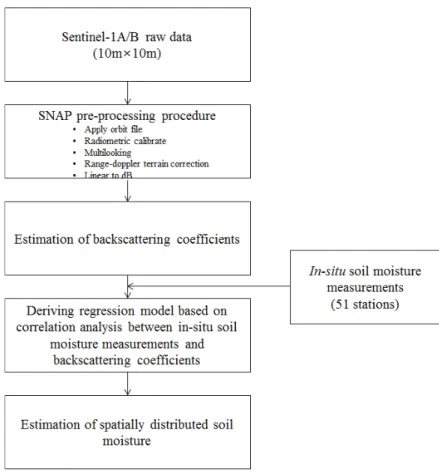
본 연구에서는 Sentinel-1A/B SAR 센서 전처리를 통한 후 방산란계수를 산정하였으며, 산정된 후방산란계수와 토양수 분 실측값의 관계를 이용한 회귀공식을 도출하여 우리나라의 토양수분 공간분포를 산정하였다. 후방산란계수는 2018년
Fig. 1 Schematics of this study
Sentinel-1A/B 이미지 자료를 Sentinel 위성 전용 전처리 도 구인 SNAP (Sentinel Application Platform)을 이용하여 전처 리하여 도출하였다. 또한 토양수분 실측값 (Time Domain Reflectometry-TDR)은 농촌진흥청에서 제공하는 51개 지점의 TDR 센서 기반 토양수분 시계열 자료를 이용하였다. Fig. 1 은 Sentinel 이미지 자료의 전처리 및 토양수분 산정 과정을 나타낸다.
1. Sentinel-1A/B 위성 이미지 기반 후방산란계수 산정
ESA (European Space Agency)에서 운영하는 Sentinel-1 위 성은 2014년 4월에 발사한 Sentinel-1A와 2016년 6월에 발사 한 Sentinel-1B로 두 개의 위성이 12일의 공전 주기로 지표면 을 관측하여 SAR 영상을 제공하고 있으며, 마이크로파의 송 수신 방향에 따라 VV (Vertical Transmit – Vertical Receive), VH (Vertical Transmit – Horizontal Receive), HH (Horizontal Transmit – Horizontal Receive), HV (Horizontal Transmit – Vertical Receive)의 4가지 편파영상을 제공한다. Sentinel-1A/B 의 영상모드는 해상도와 주사폭에 따라 달라지며 데이터 형 태는 SM (Stripmap), IW (Interferometric Wide Swath), EW (Extra Wide Swath), WV (Wave)의 4가지 영상취득모드가 있 으며, 각각의 영상모드에 따라 위상과 진폭을 모두 가지고 있 는 SLC (Single Look Complex)와 진폭만을 가지고 있는 GRD (Ground Range Detected)의 2가지의 데이터 형태로 구성된다(Lee et al., 2017). 본 연구에서는 주로 육지를 관측하는 IW 영상취득모드의 GRD 데이터를 이용하였으며, VV편파영상 과 VH편파영상 중에서 후방산란과 토양수분 실측값과의 상 관성이 높은 VH편파영상을 선정하여 Sentinel-1A/B SAR 위 성자료의 전처리 도구 SNAP을 이용하여 후방산란계수를 도 출하였다.
Fig. 2에 나타난 것처럼 일반적으로 Sentinel-1 위성의 경우
Acquistion mode Product Type Resolution (m) Pixel spacing (m)
SM (stripmap)
SLC 1.7×4.3 to 3.6×4.9 1.5×3.6 to 3.1×4.1
GRD
9×9 3.5×3.5
23×23 10×10
84×84 40×40
IW (interferometric wide swath)
SLC 2.7×22 to 3.5×22 2.3×14.1
GRD 20×22 10×10
88×87 40×40
EW (extra wide swath)
SLC 7.9×43 to 15×43 5.9×19.9
GRD 50×50 25×25
93×87 40×40
WV (wave) SLC 2.0×4.8 and 3.1×4.8 1.7×4.1 and 2.7×4.1
GRD 52×51 25×25
Table 2 Information of the Sentinel-1A/B Products
Date
Sentinel-1A 6/14 7/13 7/25 8/1 8/18 9/11 9/18 9/23 9/30 10/12 10/17
Sentinel-1B 6/13 7/14 7/26 7/31 8/19 9/12 9/17 9/24 9/29 10/11 10/18
Table 1 Dates observed by Sentinel-1A/B during June to October in 2018
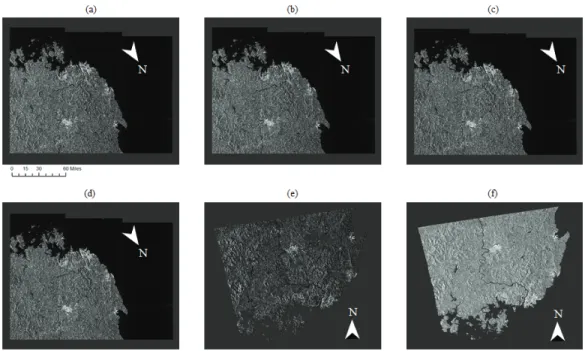
Fig. 2 High resolution (10m×10m) Sentinel-1A/B images (1A : July 13th and 1B : July 14th)
A 위성이 서울경기, 강원도, 충청북도, 충청남도, 전라북도, 및 전라남도를 관측한 다음날에 B 위성이 경상북도 및 경상 남도를 관측한다. Sentinel-1A/B 위성의 관측 날짜 및 제원은 Table 1 및 Table 2와 같다. 본 연구에서는 2018년 6월부터 10월까지 총 22일동안 관측된 Sentinel-1A (11장)/B (11장) 영상 자료를 전처리하였다. Fig. 3은 SNAP을 이용한 Sentinel-1A/B SAR의 전처리 과정을 나타낸다. Sentinel-1A/B의 초기 데이 터는 정확한 궤도정보가 포함되지 않기 때문에 위성 영상제 공일로부터 3주 후 제공되는 궤도 정보를 SNAP의 궤도보정 기능을 통하여 보정 할 수 있다. 후방산란 방사보정은 Fig. 4와 같이 기준 면적을 결정하며, 결정된 기준 면적에 해당하는 보정계수를 이용하여 지형, 대기 효과 등 왜곡되는 오차를 수정 및 지표면에 대한 보정된 반사값을 결정한다. 후방산란 방사보정을 통하여 기준 면적에 따라 3가지 (Sigma, Beta, Gamma) 후방산란계수가 공식 (1-3)을 이용하여 산정된다.
본 연구에서는 육지를 기준 면적으로 후방산란을 보정하는 Sigma nought 값을 이용하여 후방산란계수를 산정하였다.
SAR영상의 이미지를 분류하고 해석할 경우 불확실성을 유 발하는 잡음 (noise)와 스펙클 (speckle)은 Multilooking 기능 에 의해 보정하였다. 지형은 DEM (Digital Elevation Model) 을 이용하여 보정하였으며, 이러한 보정처리 된 후방산란 계수는 후방산란계수의 절대값 ( × log)을 취하여 dB (decibels)단위로 변환한다.
Fig. 4 Reference areas of backscatter normalisation
(1)
× sin (2) × tan (3)
여기서 : 기준 면적 에서의 후방산란계수 (beta nought), DN : 영상 수치 값 (digital number), : 경사 범위 Fig. 3 Calibration procedures for deriving backscatter coefficients using the SNAP (Sentinel Application Platform) tool;
a) Raw data, b) Apply orbit file, c) Calibrate sigma0, d) Multilooking, e) Geocoding, f) Linear to dB scale
방향인 기준 면적 (the area normalization is aligned to with the slant range), : 기준 면적 에서의 후방산란계수 (sigma nought), : 입사각 (incident angle), : 기준 면적
에서의 후방산란계수 (gamma nought)이다.
2. 후방산란계수 기반 모의 토양수분 산정
산정된 Sentinel-1A/B 기반 후방산란계수와 농촌진흥청에 서 제공하는 TDR 센서 기반 51개 지점의 토양수분 관측 자료 의 상관성을 분석하여 토양수분회귀공식을 도출하였다. 실측 토양수분 관측 지점의 위치 및 토지이용은 Table 3과 같다.
실측 토양수분은 지표면으로부터 약 10 cm 깊이에서 측정되 었으며, 단위는 전체 토양 부피중에서 수분이 차지하는 비율 (%)로 표시된다. 날짜별 공간회귀분석에 사용된 토양수분 관 측 지점의 개수는 Sentinel-1A/B 위성 이미지 및 실측 토양수 분의 이용가능 여부에 따라 총 개수가 달라진다. 10 m×10 m 공간해상도의 Sentinel-1A/B 후방산란계수 이미지와 10 m×10 m
공간해상도 내에 위치하고 있는 지점 (point-scale)에서 실측된 토양수분을 이용하여 후방산란계수와 토양수분의 상관성 분 석을 수행하였다. 비록 10 m×10 m 공간해상도와 지점에서 관측된 TDR (point-scale) 토양수분의 공간해상도가 불일치 하였으나, 일반적으로 10 m×10 m 공간해상도에서는 지표특 성 (토양특성, 지표피복, 지형 등) 변화가 크지 않기 때문에 지점의 토양수분이 10 m×10 m 공간해상도를 대표하는 것으 로 가정하였다. 후방산란계수는 일반적으로 토양수분과 선 형적 관계를 가지며 이러한 후방산란계수의 특성을 이용하 여 선형회귀분석을 이용한 토양수분 산출에 관한 많은 연구 가 수행되었다 (Lackshmi, 2013; Wagner et al., 2009; Le Morvan et al., 2008). 후방산란계수와 토양수분의 선형적 관 계를 이용하여 선형회귀식을 통한 모의 토양수분을 산출하 였으며, 산출된 모의 토양수분과 TDR 토양수분 실측값과의 상관성 분석을 통하여 Sentinel-1A/B 기반 모의 토양수분 산 출 정확도를 분석하였다.
Site Latitude Longitude Landuse Site Latitude Longitude Landuse
Aphae-eup 34.8995 126.3367 Crop Jeongu-myeon 35.6208 126.8963 Crop
Bongdam-eup 37.2203 126.9500 Urban Jinan-eup 35.7603 127.4375 Crop
Bongyang-eup 37.1616 128.1767 Forestry Jinbu-myeon 37.6701 128.5943 Crop
Buk-gu, Pohang-si 36.1131 129.3063 Crop Jusam-dong 34.7875 127.6543 Urban
Bukpyeong-dong 37.4852 129.1188 Crop Mandae-ri 38.1529 128.0811 Forestry
Buryang-myeon 35.7464 126.8515 Crop Muju-eup 36.0059 127.6779 Crop
Byeonggok-myeon 36.5683 129.3960 Crop Namil-myeon 36.5879 127.5065 Crop
Deokjin-myeon 34.8253 126.6731 Crop Okcheon-eup 36.3000 127.5965 Urban
Donwon-gu 37.2489 126.5912 Crop Omi-dong 35.9908 128.9253 Forestry
Duma-myeon 36.2617 127.2773 Crop Pungyang-myeon 34.5665 127.2581 Crop
Geochang-eup 35.6732 127.9213 Crop Samsan-myeon 34.5284 126.5596 Crop
Gonggeun-myeon 37.5275 127.9607 Crop Sangnam-myeon 35.4454 128.7570 Crop
Gunnae-myeon 34.5115 126.2977 Crop Seodun-dong 37.2736 126.9930 Urban
Gunseo-myeon 35.2823 126.4680 Crop Seokpo-myeon 37.0522 129.0031 Crop
Gurim-myeon 35.4382 127.0412 Bare soil Seonsan-eup 36.2316 128.2881 Crop
Gwangdo-myeon 34.9036 128.4046 Crop Simcheon-myeon 36.2069 127.7164 Crop
Gwangjeok-myeon 37.8205 126.9727 Forestry Sinam-myeon 36.7421 126.8145 Crop Gyuam-myeon 36.2592 126.8426 Bare soil Songcheon-dong 36.5382 128.8051 Urban
Hakgyo-myeon 35.0522 126.5417 Crop Taean-eup 36.7329 126.3048 Urban
Heungdeok-dong 36.6144 128.2077 Crop Ungyo-ri 37.5373 128.4492 Crop
Heungeop-myeon 37.2958 127.9150 Crop Yangmok-myeon 36.0398 128.3813 Crop
Hyeongyeong-myeon 35.0286 126.4457 Crop Yangpyeong-eup 37.5090 127.5130 Bare soil
Inje-eup 38.0597 128.1670 Urban Yecheon-eup 36.6771 128.4629 Crop
Jain-myeon 35.8171 128.8114 Crop Yeongwol-eup 37.1676 128.4772 Urban
Jangseong-eup 35.3185 126.7960 Crop Yeongyang-eup 36.6561 129.1464 Crop
Jangsu-eup 35.6198 127.5115 Crop - - - -
Table 3 The monitoring sites for validation of the Sentinel 1A/B-based soil moisture products
III. 결과 및 고찰
1. Sentinel-1A/B 기반 후방산란계수 산정 및 관측 토양수분과의 상관성 분석
Sentinel-1A/B 기반 후방산란계수를 산정하기 위하여 ESA 에서 제공하는 Sentinel-1A/B 전용 전처리 도구인 SNAP을 이 용하여 총 22개 이미지를 전처리하였다. 산정된 후방산란계수
와 TDR기반 관측 토양수분과의 상관성 분석을 위해 51개 지 점별 TDR 토양수분 관측자료와 관측 지점이 위치하는 후방산 란계수 (10 m×10 m)의 날짜별로 공간회귀분석을 수행하였다.
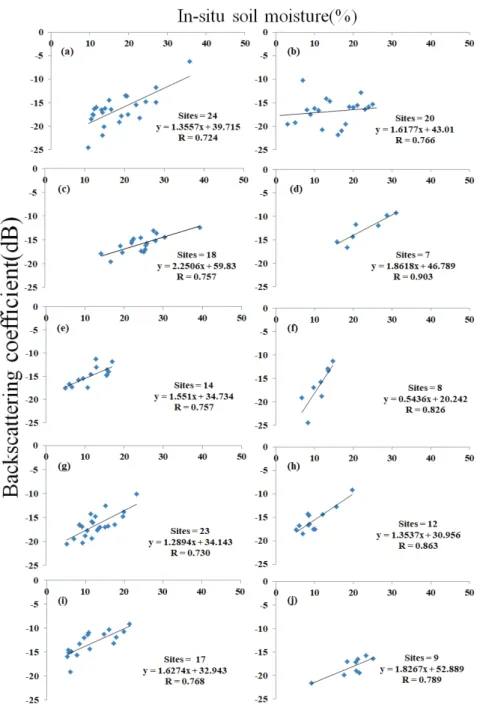
Fig. 5 및 Fig. 6은 Sentinel-1A/B 기반 후방산란계수와 실측 토양수분의 상관성 분석 결과를 나타낸다. 전체적으로 6-8/9-10월 기간에 산정된 후방산란계수와 토양수분의 상관
Fig. 5 The scatter plots between the backscatter coefficients and TDR (Time Domain Reflectometry)-based soil moisture measurements at the monitoring sites during the summer period (June to August) in 2018; a) June 13th, b) June 14th, c) July 13th, d) July 14th, e) July 25th, f) July 26th, g) July 31th, h) August 1st, i) August 18th, j) August 19th
Fig. 6 The scatter plots between the backscatter coefficients and TDR (Time Domain Reflectometry)-based soil moisture measurements at the monitoring sites during the fall period (September to October) in 2018; a) September 11th, b) September 12th, c) September 17th, d) September 18th, e) September 23th, f) September 24th, g) September 29th, h) September 30th, i) October 11th, j) October 12th, k) October 17th, l): October 18th
성 (R)이 0.7이상으로 높게 나타났으며, 특히 7월 14일에는 상관성 (R)이 0.903으로 매우 높게 나타났다. 일반적으로 관측 지점의 토양, 토지이용, 지형, 기상 등 지역적 환경특성이 토 양수분에 크게 영향을 미친다. 회귀분석 결과에서 회귀선의 기울기가 지점별 차이가 상당히 높은 것으로 나타나 실측 토 양수분 및 후방산란계수의 상관성이 지역적 환경특성을 잘 반 영하는 것으로 나타났다. 또한 Fig. 5 및 Fig. 6에 나타난 후방 산란계수와 실측 토양수분의 높은 상관성 결과 (R: 0.702∼
0.818)는 후방산란계수와 지표면 토양수분의 선형적 관계를 입증하는 것으로 판단되었다.
2. Sentinel-1A/B 후방산란계수 기반 지점별 시계열 토양수분 산정 및 검증
Table 4는 Fig. 4 및 Fig. 5에서 도출된 토양수분회귀식을
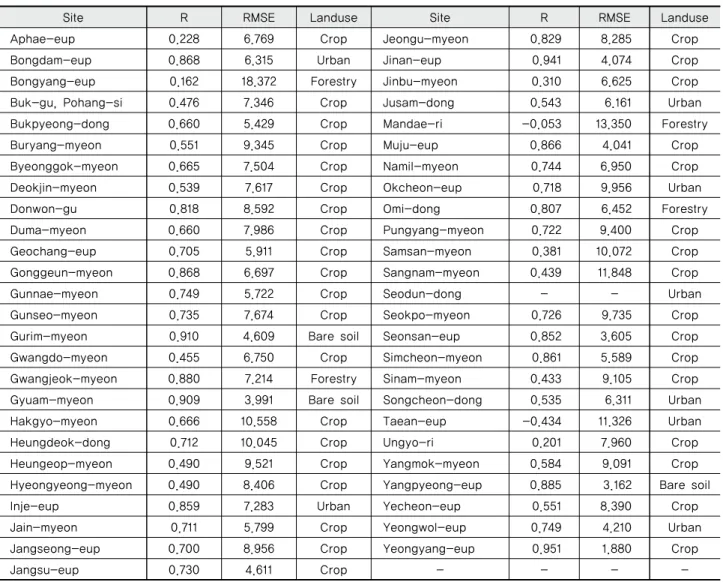
이용하여 산정된 모의 토양수분을 지점별 실측 토양수분과 시계열로 분석한 결과를 나타낸다. 51개 관측지점의 지표피 복은 농업지역 (crop), 도시지역 (urban), 산림 (forestry), 나지 (bare soil) 등으로 구성되어 있으며, 대부분의 토양수분은 농 업지역에서 관측되었다. 전체적으로 모의값과 실측값의 공간 분포와 비교하여 시계열 상관성의 지점별 변동성이 다소 높 은 것으로 나타났으나, 전체적으로 시계열 모의값 역시 실측 값을 잘 반영하는 것으로 나타났다. 지표피복 별로는 나지 피 복에서 상관성 (R)과 불확실성 (RMSE)가 0.885∼0.910 및 3.162∼4.609로 나타나 불확실성이 가장 낮게 나타났으며, 농 업지역, 산림 및 도시 지점에서도 대부분 모의값이 실측값이 잘 반영하는 것으로 나타났다. 그러나 토지이용이 산림지역 인 양구군 만대리 지점 (R: -0.053 및 RMSE: 13.350)과 도시지 역의 잔디밭에서 관측된 태안군 태안읍 지점 (R: -0.434 및
Site R RMSE Landuse Site R RMSE Landuse
Aphae-eup 0.228 6.769 Crop Jeongu-myeon 0.829 8.285 Crop
Bongdam-eup 0.868 6.315 Urban Jinan-eup 0.941 4.074 Crop
Bongyang-eup 0.162 18.372 Forestry Jinbu-myeon 0.310 6.625 Crop
Buk-gu, Pohang-si 0.476 7.346 Crop Jusam-dong 0.543 6.161 Urban
Bukpyeong-dong 0.660 5.429 Crop Mandae-ri -0.053 13.350 Forestry
Buryang-myeon 0.551 9.345 Crop Muju-eup 0.866 4.041 Crop
Byeonggok-myeon 0.665 7.504 Crop Namil-myeon 0.744 6.950 Crop
Deokjin-myeon 0.539 7.617 Crop Okcheon-eup 0.718 9.956 Urban
Donwon-gu 0.818 8.592 Crop Omi-dong 0.807 6.452 Forestry
Duma-myeon 0.660 7.986 Crop Pungyang-myeon 0.722 9.400 Crop
Geochang-eup 0.705 5.911 Crop Samsan-myeon 0.381 10.072 Crop
Gonggeun-myeon 0.868 6.697 Crop Sangnam-myeon 0.439 11.848 Crop
Gunnae-myeon 0.749 5.722 Crop Seodun-dong - - Urban
Gunseo-myeon 0.735 7.674 Crop Seokpo-myeon 0.726 9.735 Crop
Gurim-myeon 0.910 4.609 Bare soil Seonsan-eup 0.852 3.605 Crop
Gwangdo-myeon 0.455 6.750 Crop Simcheon-myeon 0.861 5.589 Crop
Gwangjeok-myeon 0.880 7.214 Forestry Sinam-myeon 0.433 9.105 Crop
Gyuam-myeon 0.909 3.991 Bare soil Songcheon-dong 0.535 6.311 Urban
Hakgyo-myeon 0.666 10.558 Crop Taean-eup -0.434 11.326 Urban
Heungdeok-dong 0.712 10.045 Crop Ungyo-ri 0.201 7.960 Crop
Heungeop-myeon 0.490 9.521 Crop Yangmok-myeon 0.584 9.091 Crop
Hyeongyeong-myeon 0.490 8.406 Crop Yangpyeong-eup 0.885 3.162 Bare soil
Inje-eup 0.859 7.283 Urban Yecheon-eup 0.551 8.390 Crop
Jain-myeon 0.711 5.799 Crop Yeongwol-eup 0.749 4.210 Urban
Jangseong-eup 0.700 8.956 Crop Yeongyang-eup 0.951 1.880 Crop
Jangsu-eup 0.730 4.611 Crop - - - -
Table 4 Correlations and uncertainties between the Sentinel-1A/B based soil moisture products and the TDR soil moisture measurements in 2018
RMSE: 11.326)의 모의값과 실측값의 역상관성이 나타났다.
일반적으로 Sentinel-1A/B에 탑재되어 있는 SAR 센서의 경우 지표피복의 투과깊이에 제약이 있기 때문에 산림유역에서 보 다 높은 불확실성이 발생한 것으로 판단되었다. 또한 도시지 역의 경우 관측지점은 일반적으로 나지, 잔디 등에서 관측되
지만, 관측지점에 해당하는 격자 내부에 잔디 등의 피복뿐만 아니라 인근의 건물, 도로 등 인공 구조물이 포함될 수 있기 때문에 불확실성이 높게 나타난 것으로 판단되었다.
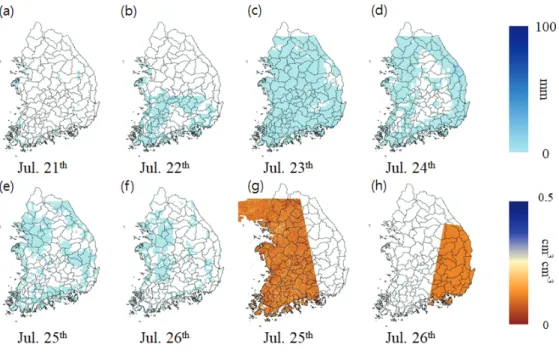
Fig. 7과 Fig. 8은 Sentinel-1A/B 토양수분과 GPM (Global Precipitation Measurement, Hou et al., 2014) 위성강우 이미지 Fig. 8 (a-f) GPM based precipitation amounts on September, 2018; (g-h) Sentinel-1A/B based soil moisture on
September, 2018
Fig. 7 (a-f) GPM based precipitation amounts on July, 2018; (g-h) Sentinel-1A/B soil moisture on July, 2018
를 나타낸다. Sentinel-1A/B 이미지가 관측되기 이전인 7월 22∼
26일 동안에 전국적으로 일평균 10 mm 미만의 적은 강우가 발생하여, 7월 25일과 26일에 전체적으로 낮은 토양수분공간 분포를 보였다. 그러나 7월 26일의 경우 서울 및 서부지역을 중심으로 약 2∼3 mm 이하의 매우 적은 강우가 발생하였으 며, 7월 25일에 관측된 Sentinel-1 토양수분 공간분포에서도 서울 및 서부지역을 중심으로 토양수분이 다소 높게 나타났 다. 9월 19일부터 21일까지 전국적으로 일평균 약 70 mm 정 도의 많은 강우가 발생하였으며, 특히 경기도와 강원도 지역 에 많은 양의 강우가 발생하여 9월 23일의 경우 강우발생 지 역의 토양수분이 다른 지역보다 상대적으로 높게 나타났다.
또한 22일부터 24일까지는 일평균 약 18 mm 정도의 강우가 서부와 남부지역을 중심으로 발생하였다. Sentinel-1A/B 토양 수분 이미지도 전체적으로 높은 것으로 나타났으며, 특히 22 일부터 24일까지 서부 및 남부 지역을 중심으로 발생한 강우 에 따라서 Sentinel-1A/B 이미지의 토양수분도 높게 나타나 강우 발생에 따른 토양수분 변화가 Sentinel 이미지에 잘 반영 되는 것으로 나타났다. SAR를 탑재한 Sentinel-1A/B는 기상 상태와 상관없이 고해상도로 지표면을 관측할 수 있는 장점 이 있지만, Fig. 7 및 Fig. 8에 나타난 것처럼 동일지점의 위성 재방문 기간이 일정하지 않고 약 3주 정도의 재방문 기간이 소요되기 때문에 일별 및 주별 토양수분을 제공하지 못하는 단점이 있다. 따라서 향후 수문, 수자원, 농업 등에 적용하기 위해서는 Sentinel-1A/B 위성의 낮은 시간해상도 문제 해결을 위한 추가 연구가 필요할 것으로 판단되었다.
IV. 결 론
본 연구에서는 Sentinel-1A/B 위성 이미지 자료를 이용하여 고해상도 (10 m×10 m)의 우리나라 토양수분 공간분포를 산정 하였다. ESA에서 제공하는 SNAP를 이용하여 Sentinel-1A/B 위성 이미지 자료를 전처리 및 후방산란계수를 산출하였으며, 산출된 후방산란계수와 농촌진흥청에서 운영하는 51개 지점 의 TDR 기반의 실측 토양수분의 관계를 회귀분석하여 토양 수분회귀공식을 도출하였다. 도출된 토양수분회귀공식을 이 용하여 Sentinel-1A/B 위성 이미지가 관측된 날짜별 우리나라 의 토양수분 공간분포를 산정하였다. 전체적으로 산출된 후 방산란계수와 토양수분의 상관성 (R)이 0.7 이상으로 후방산 란계수와 토양수분의 선형적인 관계가 높은 것으로 나타났다. 도출된 날짜별 토양수분회귀공식을 Sentinel-1A/B 기반 산출 된 후방산란계수에 적용하여 우리나라의 고해상도 토양수분 공간분포를 산정하였다. Sentinel-1A/B 기반 토양수분과 실측 값의 날짜별 공간분포와 비교하여 지점별 시계열 모의값의
상관분석 결과의 불확실성이 다소 높게 나타났으나, 전체적 으로 다양한 지표피복 (농업지역, 산림, 도시지역, 나지) 상 태의 Sentinel-1A/B 토양수분이 실측값을 잘 반영하는 것으 로 나타났다. 특히 지표피복이 나지인 지점에서 모의값 (R:
0.885∼0.910 및 RMSE: 3.162∼4.609)이 실측값과 유사한 경 향을 보였다. 그러나 산림지역인 양구군 만대리 지점 (R:
-0.053 및 RMSE: 13.350)과 도시지역의 잔디밭에서 관측된 태안군 태안읍 지점 (R: -0.434 및 RMSE: 11.326)의 경우 Sentinel-1A/B 토양수분이 실측값과 역상관성을 보였으며, 이 는 SAR 센서의 산림피복 투과성 제약 및 도시지역 내에서의 인공구조물이 위성 이미지에 포함되어 불확실성이 높게 나타 난 것으로 판단되었다. SAR 센서의 경우 기상상태와 상관없 이 주야로 지표를 관측할 수 있는 장점이 있기 때문에 다양한 분야 (홍수, 가뭄, 농업 등)에 사용될 수 있는 전천후 위성으로 알려져 있으나, 실제 SAR 센서의 지표층 투과깊이는 지표 피 복 정도에 크게 영향을 받는다. 따라서 우리나라와 같이 산림 이 우세한 지역의 경우 불확실성이 발생할 확률이 더욱 높을 것으로 판단되었으며, 이에 관한 추가적인 연구가 필요할 것 으로 사료된다. 비록 지표특성에 따라 불확실성이 다소 발생 하였으나, 전체적으로 SAR 센서 기반 Sentinel-1A/B 토양수 분이 실측값과 유사한 것으로 나타났다. 본 연구결과는 가뭄, 홍수, 산불, 수문, 농업 등 다양한 분야에서 기초자료로 활용 될 수 있을 것으로 사료된다.
감사의 글
본 연구는 2019년도 정부 (교육부)의 재원으로 한국연구재 단의 지원을 받아 연구되었음 (NRF-2016R1D1A3B03932106).
REFERENCES
1. Entekhabi, D., E. G. Njoku, P. E. O’Neill, K. H. Kellogg, W. T. Crow, W. N. Edelstein, J. K. Entin, S. D. Goodman, T. J. Jackson, J. Johnson, J. Kimball, J. R. Piepmeier, R.
D. Koster, N. Martin, K. C. McDonald, M. Moghaddam, S. Moran, R. Reichle, J. C. Shi, M. W. Spencer, S. W.
Thurman, L. Tsang, and J. Van Zyl, 2010. The soil moisture active passive (SMAP) mission. Proceedings of
the IEEE 98(5): 704-716. doi:10.1109/JPROC.2010.204
3918.2. Gao, Q., M. Zribi, M. J. Escorihuela, and N. Baghdadi, 2017. Synergetic use of Sentinel-1 and Sentinel-2 data for soil moisture mapping at 100 m resolution. Sensors 17(9):
1966. doi:10.3390/s17091966.
3. Hornacek, M., W. Wagner, D. Sabel, H. L. Truong, P.
Snoeij, T. Hahmann, E. Diedrich, and M. Doubková, 2012.
Potential for high resolution systematic global surface soil moisture retrieval via change detection using Sentinel-1.
IEEE Journal of Selected Topics in Applied Earth Observations and Remote Sensing 5(4): 1303-1311. doi:
10.1109/jstars.2012.2190136.
4. Hou, A. Y., R. K. Kakar, S. Neeck, A. A. Azarbarzin, C.
D. Kummerow, M. Kojima, R. Oki, K. Nakamura, and T.
Iguchi, 2014. The Global Precipitation Measurement(GPM) mission. Bulletin of the American Meteorological Society 95(5): 701-722.
5. Imaoka, K., M. Kachi, H. Fujii, H. Murakami, M. Hori, A. Ono, T. Igarashi, K. Nakagawa, T. Oki, Y. Honda, and H. Shimoda, 2010. Global Change Observation Mission (GCOM) for monitoring carbon, water cycles, and climate change. Proceedings of the IEEE 98(5): 717-734. doi:
10.1109/JPROC.2009.2036869.
6. Jang, J. C. 2018. Retrieval of sea surface wind from Sentinel-1A/B SAR data in the seas around Korea, doctoral dissertation. Seoul National University (in Korean).
7. Kerr, Y. H., P. Waldteufel, J. P. Wigneron, J. A. M. J.
Martinuzzi, J. Font, and M. Berger, 2001. Soil moisture retrieval from space: The Soil Moisture and Ocean Salinity (SMOS) mission. IEEE Transactions on Geoscience and
Remote Sensing 39(8): 1729-1735. doi:10.1109/36.942551.
8. Lakshmi, V. 2013. Remote Sensing of Soil Moisture. ISRN
Soil Science. doi:10.1155/2013/424178.
9. Le Morvan, A., M. Zribi, N. Baghdadi, and A. Chanzy, 2008. Soil moisture profile effect on radar signal measurement. Sensors 8(1): 256-270. doi:10.3390/s8010256.
10. Lee, S. J., S. W. Hong, J. Cho, and Y. W. Lee, 2017.
Experimental retrieval of soil moisture for cropland in South Korea using Sentinel-1 SAR Data. Korean Journal
of Remote Sensing 33(6): 947-960 (in Korean). doi:10.7780/
kjrs.2017.33.6.1.4.
11. Paloscia, S., S. Pettinato, E. Santi, C. Notarnicola, L.
Pasolli, and A. Reppucci, 2013. Soil moisture mapping using Sentinel-1 images: Algorithm and preliminary validation. Remote Sensing of Environment 134: 234-248.
doi:10.1016/j.rse.2013.02.027.
12. Sabins, F. F., 2007. Remote sensing: Principles and
applications. Waveland Press.
13. Wagner, W., D. Sabel, M. Doubkova, A. Bartsch, and C.
Pathe, 2009. The potential of Sentinel-1 for monitoring soil moisture with a high spatial resolution at global scale. In
Symposium of Earth Observation and Water Cycle Science.
14. Wagner, W., G. Lemoine, and H. Rott, 1999. A method for estimating soil moisture from ERS scatterometer and soil data. Remote Sensing of environment 70(2): 191-207.
doi:10.1016/S0034-4257(99)00036-X