Introduction
Coronavirus disease 2019 (COVID-19) has now become a pandemic since the first case of severe acute respiratory syn- drome coronavirus 2 (SARS-CoV-2) in Wuhan, China
1. The symptoms vary widely, from asymptomatic disease to pneu- monia, to life-threatening complications and ultimately death.
Sometimes it shows rapid progression of respiratory failure soon after the onset of dyspnoea and hypoxemia
2. It is impor- tant to unravel the risk factors associated with hypoxemia and identify patients who are susceptible to severe or critical ill- ness upon infection.
Older patients and those with pre-existing respiratory or
Factors Associated with Worsening
Oxygenation in Patients with Non-severe COVID-19 Pneumonia
Cho Rom Hahm, M.D.
1, Young Kyung Lee, M.D., Ph.D.
2, Dong Hyun Oh, M.D.
1, Mi Young Ahn, M.D., Ph.D.
1, Jae-Phil Choi, M.D.
1, Na Ree Kang, M.D.
1, Jungkyun Oh, M.D.
3, Hanzo Choi, M.D., M.S.
4and Suhyun Kim, M.D.
1Departments of
1Internal Medicine,
2Radiology, and
3Hospital Medicine, Seoul Medical Center, Seoul,
4Department of Emergency Medicine, Myong Ji St. Mary’s Hospital, Seoul, Republic of Korea
Background: This study aimed to determine the parameters for worsening oxygenation in non-severe coronavirus disease 2019 (COVID-19) pneumonia.
Methods: This retrospective cohort study included cases of confirmed COVID-19 pneumonia in a public hospital in South Korea. The worsening oxygenation group was defined as that with SpO
2≤94% or received oxygen or mechanical ventilation (MV) throughout the clinical course versus the non-worsening oxygenation group that did not experience any respiratory event. Parameters were compared, and the extent of viral pneumonia from an initial chest computed tomography (CT) was calculated using artificial intelligence (AI) and measured visually by a radiologist.
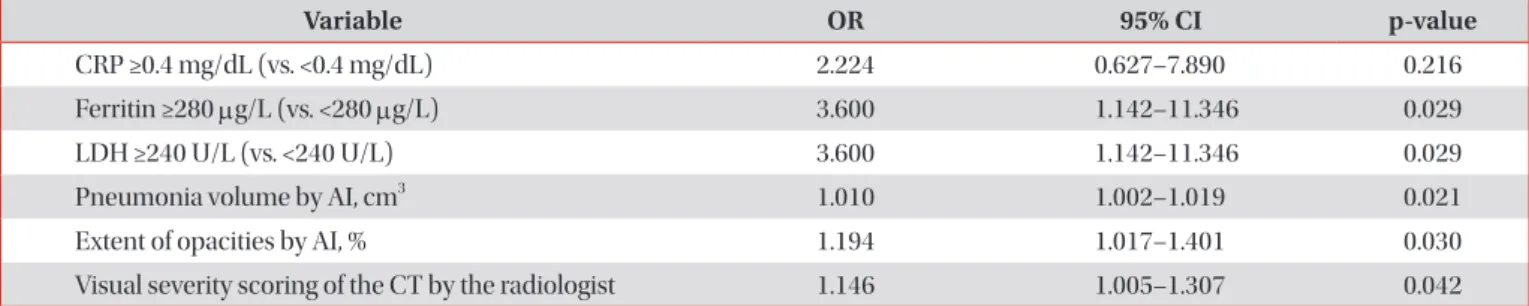
Results: We included 136 patients, with 32 (23.5%) patients in the worsening oxygenation group; of whom, two needed MV and one died. Initial vital signs and duration of symptoms showed no difference between the two groups; however, univariate logistic regression analysis revealed that a variety of parameters on admission were associated with an increased risk of a desaturation event. A subset of patients was studied to eliminate potential bias, that ferritin ≥280 μg/L (p=0.029), lactate dehydrogenase ≥240 U/L (p=0.029), pneumonia volume (p=0.021), and extent (p=0.030) by AI, and visual severity scores (p=0.042) were the predictive parameters for worsening oxygenation in a sex-, age-, and comorbid illness-matched case-control study using propensity score (n=52).
Conclusion: Our study suggests that initial CT evaluated by AI or visual severity scoring as well as serum markers of inflammation on admission are significantly associated with worsening oxygenation in this COVID-19 pneumonia cohort.
Keywords: Pneumonia; COVID-19; Computed Tomography; Artificial Intelligence; Oxygenation
Address for correspondence: Suhyun Kim, M.D.
Department of Internal Medicine, Seoul Medical Center, 156 Shinnae-ro, Jungnang-gu, Seoul 02053, Republic of Korea
Phone: 82-2-2276-7814, Fax: 82-2-2276-7820 E-mail: [email protected]
Received: Nov. 14, 2020 Revised: Dec. 29, 2020 Accepted: Jan. 1, 2021 Published online: Jan. 5, 2021
cc It is identical to the Creative Commons Attribution Non-Commercial License (http://creativecommons.org/licenses/by-nc/4.0/).
Copyright © 2021
The Korean Academy of Tuberculosis and Respiratory Diseases.
cardiovascular conditions, diabetes, hypertension, and cancer appear to be at the greatest risk for poor outcomes or severe complications
1,3-5. Leucocytosis, low lymphocyte count, serum levels of D-dimer, lactate dehydrogenase (LDH), ferritin, car- diac troponin, and higher concentrations of proinflammatory cytokines were reported to be risk factors associated with severe and fatal COVID-19 in hospitalized patients
1,6,7. Typical imaging features of COVID-19 were established to help early screening and evaluation of the severity and extent of disease.
Computed tomography (CT) involvement scores can assist in evaluation of the severity and extent of the disease
8. Previous studies estimating risk factors included mostly people with severe and fatal diseases at presentation, and data are lacking for subclinical or non-severe COVID-19 patients. We explored potential risk factors associated with worsening oxygenation in a retrospective cohort of patients with non-severe CO- VID-19 pneumonia.
Materials and Methods
1. Study design and participants
This retrospective, single-center study, recruited hospital- ized patients from 30 January to 15 April, 2020 in a public teaching hospital that also served as a COVID-19 dedicated hospital in Seoul, South Korea. We reviewed patients with CO- VID-19 pneumonia who routinely underwent non-contrast CTs at admission according to the hospital protocol. Ethical approval was provided by the institutional ethics review board of our hospital (2020-04-024). The requirement for informed consent was waived because of the retrospective study design.
All those who tested positive SARS-CoV-2 in Korea were either hospitalized or monitored in community isolation settings, and discharged after twice consecutive SARS-CoV2 tests con- verted to negative. The inclusion criteria were patients aged
≥18 years who (1) were positive for nucleic acid detection of SARS-CoV-2, (2) underwent a chest CT within 24 hours of admission, and (3) showed evidence of viral pneumonia in the initial chest CT scan. The presence of ground-glass opacity (GGO) or consolidation in the bilateral peripheral posterior lungs on chest CT scans without any other specified causes or pathogen in a COVID-19 confirmed patient was categorized as CT-documented COVID-19 pneumonia
9. The exclusion criteria were (1) patients with symptom onset more than 14 days; (2) normal findings on initial chest CT; and (3) lung ab- normalities other than viral pneumonia.
The clinician’s decision dictated treatment. Multidisci- plinary teams screened for signs of acute deterioration and the need for intensive care unit (ICU) admission daily using an in-hospital electronic-medical-record monitoring system.
2. Data collection and definitions
Demographic characteristics of the patients, laboratory and radiological data were reviewed. The need for oxygen devices such as nasal oxygen supply, high-flow oxygen therapy, or respiratory support such as invasive mechanical ventilation (MV) were assessed.
For classification of the clinical course with poor oxygen- ation throughout the hospitalization, we grouped patients into the worsening oxygenation group and the non-worsening group. The worsening oxygenation group was defined as hav- ing any of the following criteria for admission or transfer to the ICU: (1) desaturation event with peripheral oxygen saturation of hemoglobin (SpO
2) on room air with rest ≤94% in at least two consecutive measurements or (2) respiratory failure re- quiring high-flow oxygen therapy or MV. The non-worsening group referred to those who never desaturated and did not need supplemental oxygen.
According to the ‘Diagnosis and Treatment Program of Pneumonia of COVID-19,’ severe cases were defined as having any of the following criteria: (1) respiratory rate ≥30 breaths/min; (2) resting blood oxygen saturation ≤93%; or (3) partial pressure of arterial blood oxygen/fraction of inspired oxygen ≤300 mm Hg. Critical patients needed to meet one of the following conditions: (1) respiratory failure requiring MV, (2) shock, or (3) other organ failure requiring ICU monitoring or treatment
10. We defined “non-severe COVID-19 patients” as those who did not meet any of the severe or critical criteria on admission.
3. Chest CT acquisition
Chest CTs were performed using a 64-detector row CT scanner (SOMATOM Sensation 64, Siemens Healthcare, Er- langen, Germany) on admission (low-dose [reference mAs, 40] with automatic exposure control; slice thickness, 1.0 mm;
and reconstruction interval, 3.0 mm). Axial images were re- constructed with a sharp reconstruction kernel at a 3 mm slice thickness. The CTs were performed with the patient in the supine position at full inspiration without contrast medium.
Axial images were reconstructed with a sharp reconstruction kernel at a 3 mm slice thickness.
4. Quantitative CT analysis
CT images of each patient were uploaded in a free software for artificial intelligence (AI)–driven automatic CT analysis of COVID-19 pneumonia (MEDIP v1.2.0.0, MEDICALIP Co.
Ltd., Seoul, Korea), released on a website (http://medicalip.
com/mobile/shop/covid19.php) on March 18, 2020. The deep
learning software automatically generated a volumetric mask
of the lung and pneumonia. The CT parameters from the
automatic quantitative software were: the total lung volume
(cm
3), the pneumonia volume (cm
3), pneumonia extent, and the mean lung densities of the total lung and the pneumonia.
An experienced thoracic radiologist (Y.K.L), blinded to the clinical data and laboratory indicators, evaluated the visual se- verity scores of the CT images. The CT severity score is adapt- ed from a method previously used in patients after severe acute respiratory syndrome
11. The extent of lung lesions was scored from 0 to 5 in each lobe and summed up (0, normal;
1, 1%–5% involvement; 2, 6%–25% involvement; 3, 26%–50%
involvement; 4, 51%–75%; 5, 76%–100% involvement). The CT severity score was defined as the sum of the individual scores in the five lobes, which ranged from 0 to 25 points.
5. Statistical analysis
Continuous variables were represented as mean and stan- dard deviation or median and interquartile ranges (IQR).
A one-sample Kolmogorov-Smirnov test was performed to check the normality of all variables. To compare the two groups, the Mann-Whitney U test was used for continuous variables, and the chi-square or Fisher exact test was used for categorical variables. Correlation analysis was performed to identify associations between continuous variables. Univariate logistic regression analysis was performed to identify the clini- cal variables associated with worsening oxygenation events.
Finally, a propensity score matching analysis was performed to minimize the effect of potential confounding factors that could affect the worsening oxygenation of COVID-19 pneu- monia patients. The propensity score was estimated using a non-parsimonious logistic regression, with worsening oxygen- ation event as the dependent variable and all the character- istics as covariates (sex-, age-, and underlying-disease) based on their methodological, statistical, and clinical relevance.
The patients with worsening oxygenation were matched 1:1 with the patients without worsening event according to the propensity score using exact matching. To assess bias reduc- tion using the propensity score matching method, absolute
standardized differences were calculated, with a value of >20%
indicating a meaningful imbalance in the baseline covariate.
We selected 26 matched patients from each group to perform a case-control study at a ratio of 1:1, and a univariate logistic regression analysis was also performed with matched data.
All statistical analyses were performed using SPSS statistical software version 23.0 (IBM Corp., Armonk, NY, USA) and R software version 3.6.2 (R Foundation for Statistical Comput- ing, Vienna, Austria). p-values were based on a two-sided sig- nificance level of 0.05.
Results
1. Demographics and clinical courses of enrolled patients
A total of 244 patients were admitted with laboratory-con- firmed COVID-19 (Figure 1). After excluding 97 patients with normal baseline CT scans, four patients whose symptom on- set was >14 days, and seven patients with bacterial coinfection or mycobacterial disease, 136 patients were included in this study (56 men, 80 women; mean age, 44.8±17.4 years; range, 18–95 years). No patient received MV or high-flow oxygen therapy on admission, only one patient had SpO
2on room air
≤93%, and two patients showed respiratory rate ≥30 breaths/
min, there was no shock or organ failure at presentation. Most patients, except for three patients, were classified as having non-severe COVID-19 on admission
10.
Among the 136 patients, 32 patients (23.5%) were classified into the worsening oxygenation group, and 104 remained in the non-worsening group (76.5%). All patients in the worsen- ing oxygenation group had oxygen desaturation ≤94% in at least two consecutive measurements, and 10 patients required oxygen supplementation. Only two patients in the worsening oxygenation group needed MV, while a total of five patients needed high-flow oxygen therapy before or without MV.
147 CT-confirmed COVID-19 pneumonia
143 Patients whose symptom onset <14 days
136 Patients included
244 Admitted with laboratory-confirmed COVID-19 (>18 yr)
97 Normal baseline CT scan
4 Symptom onset >14 days
7 Combined bacterial pneumonia Exclusion
Figure 1. Study flow diagram. COVID-19:
coronavirus disease 19; CT: computed
tomography.
Table 1. Baseline characteristics of hospitalized COVID-19 pneumonia patients
Variable Total
(n=136)
Worsening oxygenation group
(n=32)
Non-worsening oxygenation group
(n=104) p-value
Age, yr 44.8±17.4 55.0±20.0 41.7±15.3 <0.001
Male sex 56 (41.2) 16 (50.0) 40 (38.5) 0.305
Comorbidities 36 (26.5) 13 (40.6) 23 (22.1) 0.038
Hypertension 28 (20.6) 10 (31.3) 18 (17.3) 0.088
Diabetes mellitus 12 (8.8) 5 (15.6) 7 (6.7) 0.153
Dementia 6 (4.4) 5 (15.6) 1 (1.0) 0.003
Obstructive airway disease 4 (2.9) 1 (3.1) 3 (2.9) 0.663
Immunosuppressive agents 3 (2.2) 1 (3.1) 2 (1.9) 0.556
Chronic renal disease 1 (0.7) 0 (0) 1 (1.0) 0.765
Residence in a nursing home or long-term facility 5 (3.7) 3 (9.4) 2 (1.9) 0.085
BMI, kg/m
223.6±4.0 25.1±3.6 23.4±3.3 0.009
BMI ≥25 kg/m
245 (33.1) 17 (53.1) 28 (26.9) 0.006
Interval between symptom or disease onset and admission, day
6.8±4.9 6.7±4.6 6.8±5.1 0.941
Initial symptoms
Asymptomatic 17 (12.5) 4 (12.5) 13 (12.5) 0.634
General (fever, chill, myalgia) 85 (62.5) 21 (65.6) 64 (61.5) 0.421
Respiratory (sore throat, rhinorrhea, cough, sputum, and dyspnoea)
71 (52.2) 12 (37.5) 59 (56.7) 0.057
Gastrointestinal 10 (7.4) 1 (3.1) 9 (8.7) 0.268
Others 32 (23.5) 5 (15.6) 27 (26.0) 0.167
First recorded vital sign
Heart rate, beats/min 87.2±14.2 87.8±14.1 87.0±14.3 0.791
Systolic blood pressure, mm Hg 128.2±14.9 125.9±12.6 128.9±15.5 0.674
Respiratory rate, breaths/min 18.9±2.7 19.5±4.4 18.8±1.9 0.775
Body temperature, °C 36.9±0.6 37.1±0.6 36.9±0.5 0.095
Oxygen saturation, SpO
2, % 97.4±1.5 96.4±1.9 97.7±1.2 <0.001
Severity scoring at presentation
MEWS 1.3±0.7 1.4±0.9 1.3±0.6 0.737
PSI 41.6±21.8 56.5±25.2 37.1±18.6 <0.001
MuLBSTA score 4.4±3.1 6.0±3.4 3.9±2.9 0.001
Initial laboratory finding
White blood cells, ×10
9/L 5.7±2.2 6.0±2.6 5.6±2.0 0.364
Neutrophils, ×10
9/L 3.4±1.9 4.0±2.5 3.2±1.6 0.062
Lymphocytes, ×10
9/L 1.6±0.6 1.4±0.4 1.7±0.7 0.003
Platelets, ×10
9/L 226.1±70.6 210.3±59.0 231.0±73.3 0.146
CRP, mg/dL 0.4 (0.1–1.2) 1.79 (0.35–4.28) 0.29 (0.10–0.77) <0.001
CRP ≥0.4 mg/dL 65 (47.8) 23 (71.9) 42 (40.4) 0.002
Ferritin, μg/L 149.2 (86.7–321.5)
(n=100)
355.6 (195.6–744.9) (n=27)
106.8 (70.2–219.3) (n=73)
<0.001
No patient needed extracorporeal membrane oxygenation (ECMO). During hospitalization, 10 patients were admitted to the ICU, including two patients who developed acute respi- ratory distress syndrome, and one patient died declining to apply the MV in accordance with a previously signed advance directive. Median hospitalized days were 31.4±1.1 without dif- ference among two groups. Among the patients in the worsen- ing oxygenation group, time intervals for oxygen desaturation
≤94% were a median 2 days (IQR, 1–5) from admission and 8 days (IQR, 6–11) from symptom or disease onset, respectively.
The oxygen support was started after a median 3 days (IQR, 1–7) from admission and 12 days (IQR 9–13) from symptom or disease onset.
2. Baseline characteristics and laboratory indices between the two groups
The baseline characteristics of COVID-19 patients accord- ing to the clinical course are summarized in Table 1. The aver-
age interval for admission from symptom or disease onset was 6.8 days. Only 71 of 136 patients (52.2%) complained of respiratory symptoms, and only 23 of 136 patients (16.9%) had a body temperature (BT) ≥37.5°C on admission. Intervals between symptom or disease onset and admission, and initial symptoms showed no difference between the two groups.
The first recorded vital signs were similar in the two groups.
Patients in the worsening oxygenation group were older (p<0.001) and had more underlying diseases than those in the non-worsening group (40.6% vs. 22.1%, p=0.038). Hyper- tension was the most common underlying disease in both groups, and dementia was more frequent (15.6% vs. 1.0%, p=0.003) in the worsening oxygenation group than in the non- worsening group. The worsening oxygenation group showed higher body mass index (BMI) and 53.1% had obesity based on a BMI ≥25 kg/m
2(vs. 26.9%, p=0.006).
There were numerous differences in laboratory findings between the two groups (Table 1), including higher serum levels of C-reactive protein (CRP), ferritin, and LDH as well as Table 1. Continued
Variable Total
(n=136)
Worsening oxygenation group
(n=32)
Non-worsening oxygenation group
(n=104) p-value
Ferritin ≥280 μg/L 29 (29.0) 16 (50.0) 13 (12.5) <0.001
LDH, U/L 245 (213–309)
(n=135)
305 (226–340) (n=32)
236 (212–289) (n=103)
0.006
LDH ≥240 U/L 51 (37.8) 19 (59.4) 32 (30.8) 0.003
Values are presented as mean±SD, number (%), or median (IQR).
p<0.05 was considered statistically significant.
COVID-19: coronavirus disease 19; BMI: body mass index; MEWS: modified early warning score; PSI: pneumonia severity index; MuLBSTA score: multilobe infiltration, hypo-lymphocytosis, bacterial coinfection, smoking history, hypertension, and age; CRP: C-reactive protein; LDH:
lactate dehydrogenase; SD: standard deviation; IQR: interquartile range.
Table 2. Comparison of parameters and scores of the initial low-dose chest CT scan between the two groups
Variable Total
(n=136)
Worsening oxygenation group
(n=32)
Non-worsening oxygenation group
(n=104) p-value Quantitative CT analysis by AI
Pneumonia volume, cm
313.8 (3.8–46.7) 45.2 (8.5–170.6) 10.7 (3.5–38.2) 0.001
Extent of opacities, % 0.7 (0.2–2.2) 2.4 (0.5–6.5) 0.5 (0.2–1.7) 0.001
Visually estimated CT scoring by the radiologist
Visual severity score 5.4±4.0 8.0±5.2 4.6±3.2 <0.001
0–5 90 (66.2) 16 (50.0) 74 (71.2)
6–10 29 (21.3) 4 (12.5) 25 (24.0)
≥11 17 (12.5) 12 (37.5) 5 (4.8)
Values are presented as median (IQR), mean±SD, or number (%).
p<0.05 was considered statistically significant.
CT: computed tomography; AI: artificial intelligence; IQR: interquartile range; SD: standard deviation.
lower lymphocyte counts in the worsening oxygenation group than in the non-worsening group (all p<0.05). The worsen- ing oxygenation group had higher pneumonia severity index (PSI); (56.5 vs. 37.1, p<0.001) and MuLBSTA score (6.0 vs. 3.9, p=0.001) than the non-worsening group, the modified early warning score (MEWS) showed no difference (1.4 vs. 1.3, p=0.737).
3. Relationships between CT features and worsening oxygenation
The pneumonia volume quantified using AI was signifi- cantly larger in the worsening oxygenation group (median, 45.2 cm
3vs. 10.7 cm
3; p=0.001) as well as the extent of opaci- ties (median, 2.4% vs. 0.5%; p=0.001). Visual severity scores of the CT images were also significantly higher in the worsening
Lung Pneumonia
Volume (cm )3 Mean (HU) Standard deviation
Pneumonia burden (g)
% extent (ACR) 2,353.8
550.5
647.1 246.1 - -
348.0 193.3 382.3 23.4% (0.2)
Lung Pneumonia
Volume (cm )3 Mean (HU) Standard deviation
Pneumonia burden (g)
% extent (ACR) 3,953.7
34.3
819.9 140.0 - -
462.2 180.1 19.6 0.9% (0.0)